22 August 2025
Global Market Outlook
Global Market Outlook
A delicate balancing act
We remain bullish on equities over the next 6-12 months, but short-term risks still loom. Fundamentals and quantitative models are bullish equities, but we remain vigilant about seasonality, policy and investor positioning risks in the near term.
Rotate from US to Asia ex-Japan equities. We would view US equity rallies as opportunities to reduce excessive US exposure and rotate to Asia ex-Japan equities. Equities in Japan and Europe remain core holdings.
Focus on Emerging Market (EM) local currency bonds and capture yield in USD bonds. Tight yield premiums on corporate bonds mean our preferred bond strategy is to lock in yields for longer, preferring high quality bonds over cash. Focus on mid-maturity profiles and add to EM local currency bonds.
How to build a resilient investment strategy?
Where are the short-term opportunities in equities?
What factors are driving your bullish quantitative models?
Strategy
Investment strategy and key themes
|
|
||||
|

12m Foundation Overweights:
- Global equities
- Asia ex-Japan equities
- Emerging Market (EM) local currency bonds
Opportunistic ideas – Equities
- US major banks, technology^
- Korea large-cap equities, China non-financial high-dividend state-owned entities (SOEs) and Hang Seng Technology index
- Europe industrials
Sector Overweights:
- US: Financials, technology, comms
- Europe: Financials, technology, comms, industrials
- China: Comms services, technology, cons. discretionary
Opportunistic ideas – Bonds
- UK Gilts (FX-unhedged)
- US Treasury Inflation-Protected Securities (TIPS), US short duration High Yield bonds
A delicate balancing act
- We remain bullish on equities over the next 6-12 months, but short-term risks loom. Fundamentals and quantitative models are bullish equities, but we remain vigilant about seasonality, policy and investor positioning risks in the near term.
- Rotate from US to Asia ex-Japan equities. We would view US equity rallies as opportunities to reduce excessive US exposure and rotate to Asia ex-Japan equities. Equities in Japan and Europe remain core holdings.
- Focus on Emerging Market (EM) local currency bonds and capture yield in USD bonds. Tight yield premiums on corporate bonds mean our preferred bond strategy is to lock in yields for longer, preferring high quality bonds over cash. Focus on mid-maturity profiles and add to EM local currency bonds.
A tough balancing act for the Fed
Most equity markets and other risky assets continue to deliver strong returns. Most major equity markets are now 2.0-3.5% higher in USD terms since mid-year, with Japan leading with over 4.5% returns. Bond yields remain rangebound, but credit spreads (yield premiums over government bonds) on corporate bonds continue to tighten amid strong risk appetite.
The macro debate over the past month centred around the likelihood of Fed rate cuts. A decidedly weak turn in US job market data over the past few months meant markets once again have started to price in a high likelihood of a Fed rate cut in September, despite remarkably hot producer prices. US tariff policy remains a risk, most recently manifested in the unexpected imposition of higher-than-expected tariffs on India and another 90-day extension of the tariff pause on China, but markets are becoming less sensitive to tariff announcements.
We continue to expect the Fed to cut rates in September, especially if job market data for August remains weak and inflation relatively contained, despite the introduction of higher tariffs from August. Moreover, interest rates remain well above the Fed’s own estimates of ‘neutral’ policy, which, on balance, sets the bias towards cutting rates. Fed rate cuts remain one key assumption behind our soft-landing expectation for the US economy, though we acknowledge inflation remains a key risk.
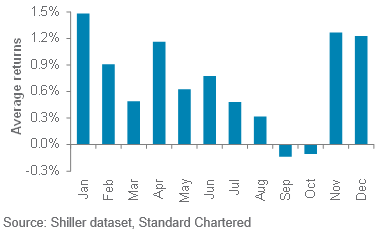
Fig. 1 Weak seasonality is a risk for the equity market in the coming months
S&P500 index average calendar month returns (1970-2024)
Stay bullish equities, but plan for volatility
We remain Overweight and bullish global equities over a 6-12-month horizon. However, the remarkable strength in major equity markets, especially US stocks, may have lowered investors’ guard when it comes to US trade policy and inflation risks. Therefore, we are vigilant about short-term volatility.
We continue to monitor three potential sources of risk that could hurt the ongoing rally. First is seasonality, with average monthly returns in August and September being among the weakest in the calendar year. Second is US policy, where the risks have shifted from trade policy to inflation. A spike in August inflation would make it harder for the Fed to cut rates in September. Finally, investor positioning among systematic, trend-following funds remains overbought, most so in EM equities.
Having said that, we believe any seasonality- or technical-driven pullback is likely to be shallow. The S&P500 index’s recent gains mean technical support now sits at 6,225, 6,092 and 6,000, less than 10% below current levels. Our short- and long-term quantitative models remain very supportive of further gains. This means that if we indeed witness a pullback, we would assess where we would add exposure.
From a long-term perspective, non-US equity markets enjoy support from a weak USD and relatively inexpensive valuations, especially compared to the US. Our top-ranked preference remains Asia ex-Japan equities, which should benefit from a weak USD and policy support. This view continues to perform well, thanks to policy stimulus in China and despite tariff headwinds in India. We remain Overweight on Asia ex-Japan, with a relative preference for China and Korea equities. However, we also view Japan and Euro area as core holdings, offering room to diversify away from excessive exposure to US markets alone.
A balancing act in bonds
While corporate bonds have benefited alongside equity markets in the current risky asset rally, the yield premium over government bonds is at very low levels, making them expensive. To put this in perspective, yield premiums are now close to the lows seen in July 2021, January 2020, October 2018 and June 2014 and within striking distance of May 2007 lows. Yield premiums rose significantly following
Fig. 2 Corporate bond premia have rarely been this tight over the past two decades
Developed Market IG and HY credit spreads
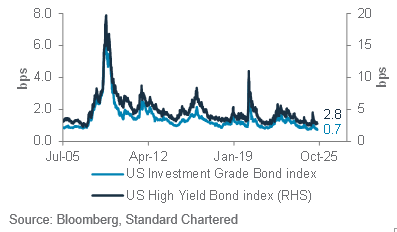
each of these periods, albeit with a different catalyst on each occasion.
We draw three conclusions from this perspective. First, equities offer more attractive prospects among risky assets, given greater room for upside in our base scenario of an economic soft-landing. Second, in bonds, the US government bond yield is the main driver of returns. Here, we continue to expect the 10-year bond yield to remain rangebound, with any rise towards 4.5-4.6% presenting an opportunity to add to exposure. Third, EM local currency bonds remain an attractive source of diversified returns.
USD gains likely capped
The grinding recovery in the USD index (DXY) since mid-year raises the question of whether a sustained rebound above 100 is a risk worth considering. However, we continue to hold the view that the USD index will not break sustainably over 100. Instead, over a 6-12 month horizon, we expect gains in the JPY and GBP to lead the next move lower in the USD, as the two currencies take over the baton from the EUR (which led gains during the bout of USD weakness in H1). This view is based on: (i) the JPY’s significant broad-based undervaluation and (ii) GBP’s undervaluation vs. the USD.
Opportunistic ideas
We close our bullish Asia local currency bonds idea, using recent gains to book profits. Within bonds, we continue to see current levels on US inflation-protected bonds as attractive to hedge against inflation risks. We continue to view short duration high yield bonds as an attractive route to earn attractive yields at a time when yield premiums are low.
Our equity opportunistic ideas remain unchanged. We would add the US technology sector on a pullback. We anticipate seasonality-driven weakness creating such an opportunity in the near term (see page 12 for pullback entry level).
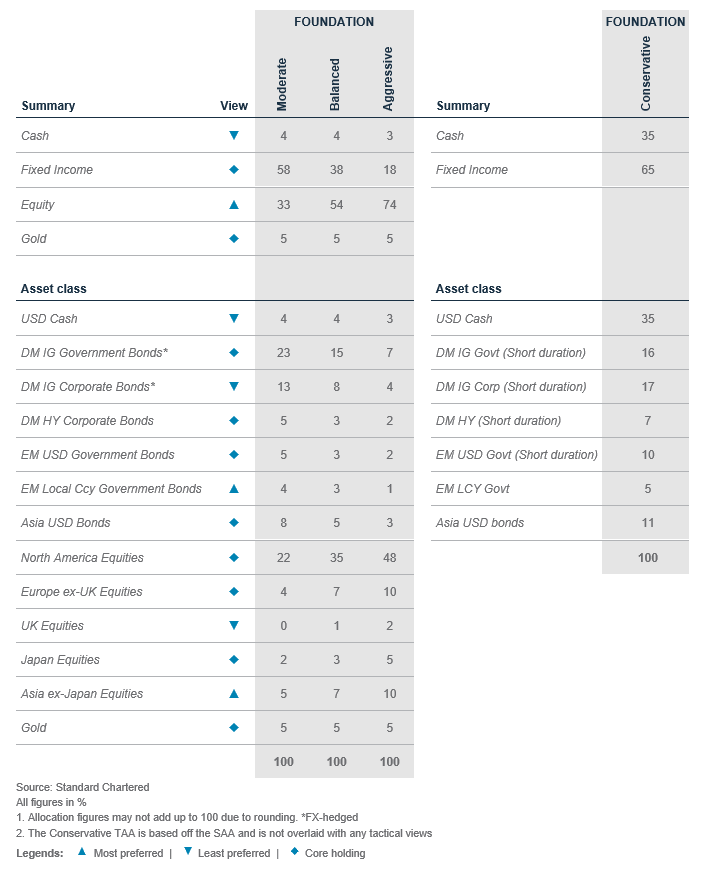
Foundation asset allocation models
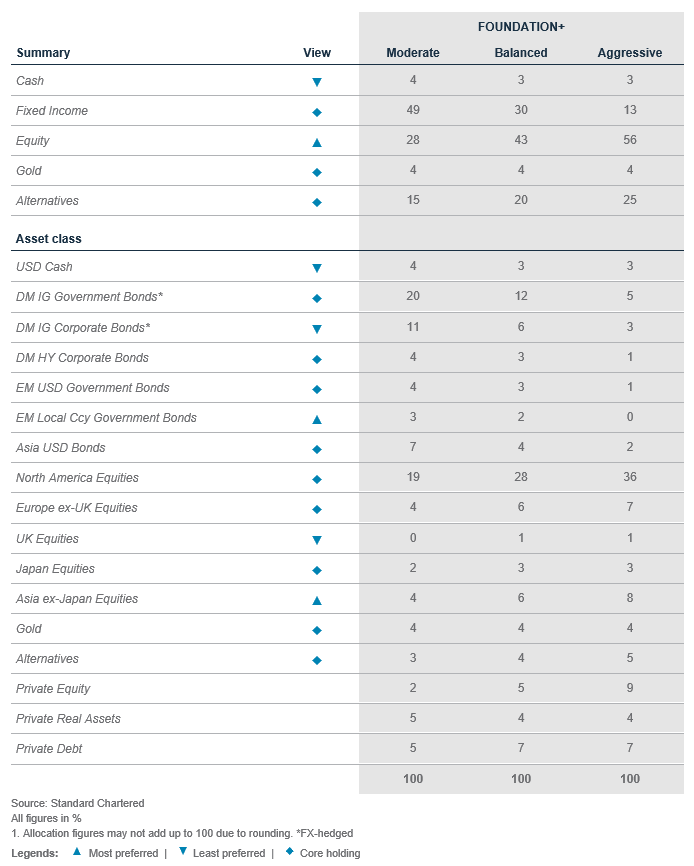
The Foundation and Foundation+ models are allocations that you can use as the starting point for building a diversified investment portfolio. The Foundation model showcases a set of allocations focusing on traditional asset classes that are accessible to most investors, while the Foundation+ model includes allocations to private assets that may be accessible to investors in some jurisdictions, but not others.
Fig. 3 Foundation asset allocation for a balanced risk profile
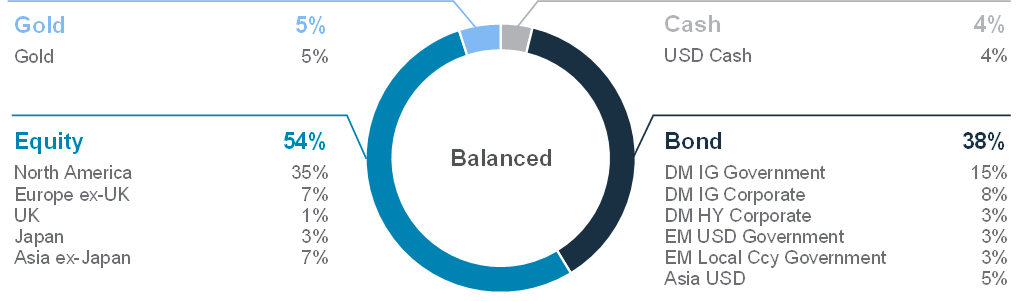
Fig. 4 Foundation+ asset allocation for a balanced risk profile
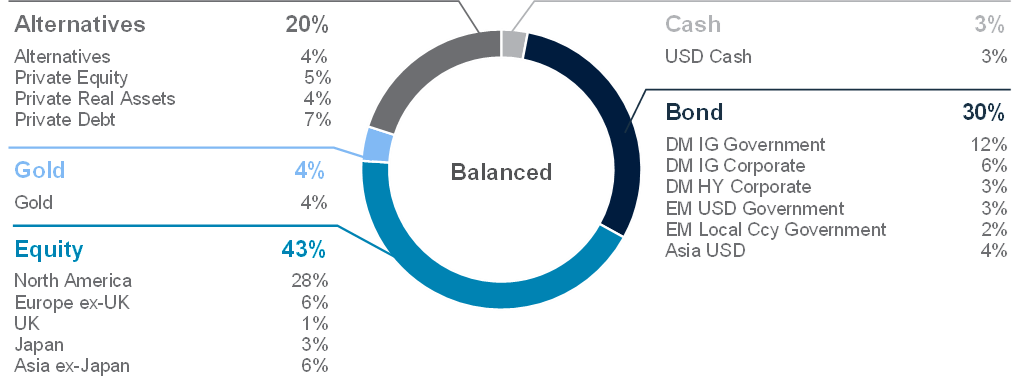
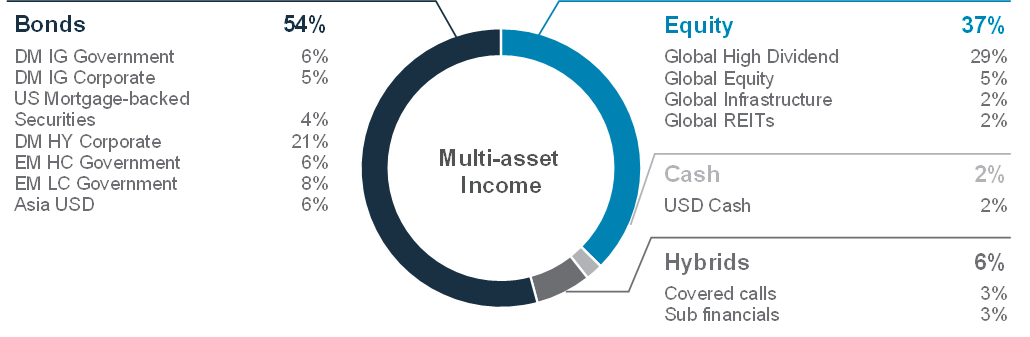
Fig. 5 Multi-asset income allocation for a moderate risk profile
Source: Standard Chartered
Foundation: Our tactical asset allocation views
Fig. 6 Performance of our Foundation Allocations*
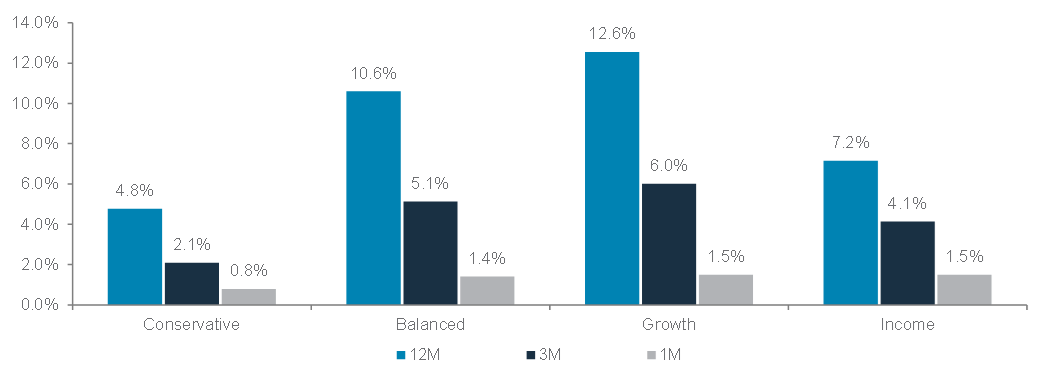
Source: Bloomberg, Standard Chartered; *12-month performance data from 20 Aug 2024 to 20 Aug 2025, 3-month performance from 20 May 2025 to 20 Aug 2025, 1-month performance from 18 Jul 2025 to 20 Aug 2025
Perspectives on key client questions
|
|
||||
Building a resilient investment strategy: Start with the foundation
When it comes to investing, it is tempting to chase what is trending – be it tech stocks, crypto or the latest thematic fund. However, long-term success is not built on hype. It is built on structure, discipline and a portfolio strategy that can weather the ups and downs of the market cycle.
A foundation-first approach
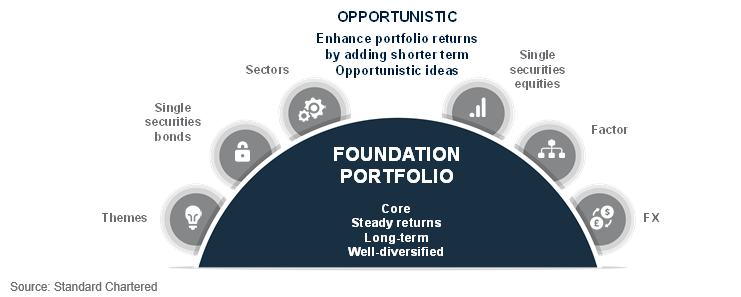
At the heart of a resilient investment strategy lies a simple, but powerful, concept: foundation vs opportunistic investing, where the foundation (core) provides consistency and the opportunistic (satellite) offers flexibility. A strong foundation portfolio is one which is: a) diversified across assets (equities, bonds, alternatives), b) geographically balanced, c) built to withstand market drawdowns, and most importantly, d) aligned with your long-term goals and life stage. It is the part of your portfolio you should be comfortable adding to – even (or especially) during periods of market volatility – because it is designed to compound steadily over time.
Opportunistic layer
Once a foundation portfolio is in place, one can add opportunistic investments. These are more-focused, higher-risk investments that aim to capture specific market trends or inefficiencies. Examples include equity/bond sector or thematic exposures, factor strategies (eg value, momentum), single securities (eg stocks, High Yield bonds) or even digital assets. These investments can offer outsized returns but come with greater volatility and downside risks. Sizing is key – limit opportunistic assets to only 10-30% of your portfolio.
Foundation portfolio: tailored to your life stage
A foundation portfolio can be tilted towards growth, income or a blend of both, depending on the investor’s stage of life and financial goals.
Growth-focused strategies prioritise total return and capital appreciation. They are ideal for investors with horizons over 10 years, minimal cash flow needs, and a focus on long-term wealth accumulation.

Fig. 7 A foundation-opportunistic portfolio approach pairs a diversified core with a flexible sleeve to boost returns
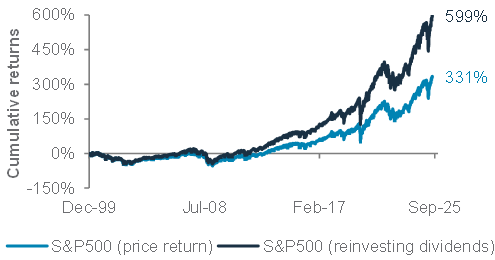
Investing success hinges on compounding returns: reinvested dividends and regular contributions significantly boost returns over time. Since 1999, the returns from reinvesting dividends have accounted for 268% difference in cumulative returns in the S&P500 index compared with not reinvesting (Fig 8).
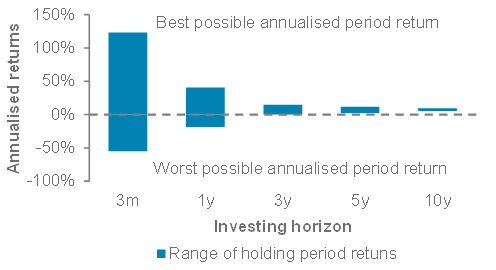
Crucially, time in the market matters more than timing the market. The longer the time horizon, the narrower the performance gap between the best and worst possible returns over an investment period (Fig 10).
Fig. 8 The S&P500 index with reinvested dividends vastly outperforms the price index alone
S&P500 with and without reinvestment of dividends
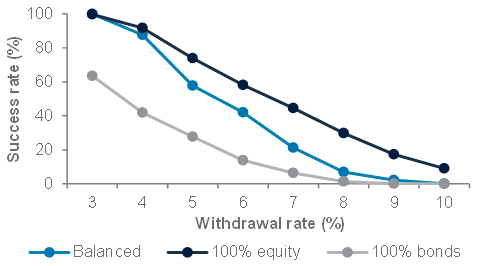
Income portfolios focus on generating regular cash flows, making them more relevant for retirees or those who need regular payouts. A key risk to this strategy is longevity risk, which is the risk of the portfolio being depleted too early, particularly if distributions are not reinvested. A balanced portfolio, which includes allocation to both bonds and equities, is crucial to protect against inflation. Historical simulations suggest that a balanced portfolio has a 90% probability to last through a 30-year retirement, with a 4% annual withdrawal rate, versus just 42% probability for a bonds-only portfolio.
Fig. 9 A bonds-only portfolio has a lower probability of lasting a 30-year retirement period
Success rate of US-only portfolios and withdrawal rates*
Blended portfolios suit investors seeking both regular cash flows and long-term capital appreciation. The key is not to over-allocate to income if payout isn’t essential, as this sacrifices the benefits of compounding to long-term portfolio growth. For example, if you require USD 1,000 per month in cashflows and your income portfolio yields 6%, only USD 200,000 needs to be dedicated to income generation. Excess capital beyond this threshold is better deployed to growth or opportunistic strategies to maximise long-term wealth accumulation.
Two considerations to take note for income investors:
- Hedge currency exposure in bonds. Currency swings often outweigh bond volatility and can have a significant impact on total returns
- Avoid value traps. Extremely high yields may be unsustainable, funded by alternative sources, rather than genuine operating earnings or income.
The role of cash: optionality vs opportunity cost
Cash is often overlooked in a portfolio discussion, but it plays a critical role. It offers optionality – the flexibility to act when opportunities arise or to cover unexpected expenses. However, holding too much cash can erode long-term returns, making it harder to beat inflation.
A good rule of thumb is to hold at least six months of fixed expenses in cash and invest the rest according to your strategy. Cash tends to outperform risky assets only during recessions or stagflationary periods. Outside of those windows, it is a drag on performance.
Time is your friend
With a well-diversified foundation portfolio, time becomes your greatest ally. The longer your investment horizon, the lower the probability of negative returns. This is why having a strategy matters, not just picking what is popular.
A thoughtful portfolio gives you the confidence to stay invested, rebalance when needed and lean in during downturns. It is not about timing the market – it is about time in the market.
Fig. 10 The difference between the best and worst rolling period returns shrinks over a longer horizon
Best and worst rolling annualised returns of a Balanced Foundation portfolio*
Macro overview – at a glance
Our macroeconomic outlook and key questions
|
Our view
Core scenario (soft landing, 55% probability): A US job market slowdown has raised the prospect of the Fed resuming rate cuts from September. Meanwhile, US trade policy uncertainty has eased since April’s peak after the Trump administration reached tentative tariff agreements with most major trade partners in August. Fed rate cuts, against the backdrop of easing trade tensions and a mildly stimulative budget for the next fiscal year, should offset the negative impact of tariffs, supporting the case for an economic soft landing. Meanwhile, policy easing in China and the Euro area are likely to broaden growth beyond the US.
Downside risk (hard landing, 25% probability): Global growth is likely to slow in H2 25 due to the impact of US tariffs. The US will see rising inflation, while the rest of the world faces disinflation. US tariffs could impact corporate margins (triggering job cuts) and consumer confidence. Delayed Fed rate cuts, higher US bond yields and/or a sharp USD sell-off are other risks.
Upside risk (no landing, 20% probability): Fed rate cuts, US trade deals and a “grand bargain” with China, against the backdrop of a global fiscal stimulus, could revive the world’s three biggest economic blocs. US deregulation and tax incentives could help revive private sector “animal spirits”. A Russia-Ukraine peace deal would ease geopolitical uncertainty significantly.
Key chart
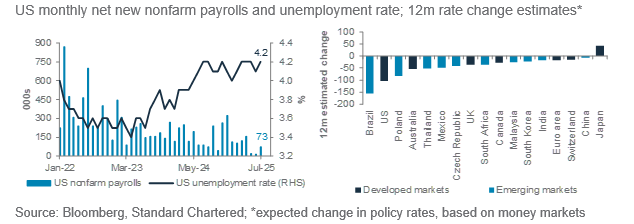
The US job market has slowed significantly in the past three months. This raises the prospect of the Fed resuming rate cuts in September to help the economy achieve a soft landing.
Fig. 11 A sharp US job market slowdown raises the odds of a Fed rate cut in September
Macro factors to watch
Rate cuts, trade deals, fiscal policy to offset tariff impact, enabling US soft landing: H3HHeThe Yale Budget Lab estimates US tariffs (average 17.7%) will slow growth by 0.5% in 2025 and 2026 and raise near-term prices by 1.8% as the tariffs are passed on to consumers. However, we expect a slowing job market to lead the Fed to restart rate cuts from September. Lower interest rates, combined with a weak USD, easing trade policy uncertainty following agreements with key allies, and tax incentives in next year’s budget, should offset the negative growth impact of tariffs, enabling an economic soft landing.
The biggest risk is a delay in Fed rate cuts due to near-term tariff-driven inflation. Although Fed Chair Powell, in his Jackson Hole speech, could acknowledged the need to cut rates, the pace of future rate cuts will depend on the health of the job market and the persistence of inflation, particularly in the next couple of months. Job creation could slow further if companies see falling profit margins due to their inability to pass on tariff costs to consumers. The risk of political pressure on the Fed to cut rates, despite rising inflation, could trigger a USD sell-off and a surge in long-term bond yields.
ECB to hold rates in September amid fiscal easing. Fiscal stimulus in Germany and EU-wide defence spending lowers the prospect of another ECB rate cut in September. The ECB has already halved its deposit rate to 2% since June last year. Also, the preliminary trade deal with the US, under which the EU will face 15% tariffs, is in line with other US allies such as Japan and South Korea, easing a key uncertainty. However, the ECB remains concerned about the tightening of financial conditions due to this year’s EUR rebound. Further EUR gains would revive ECB rate cut expectations.
China fiscal stimulus, supply-side reform: China’s growth is likely to slow in H2 25 as the export boost from front-running of US tariffs unwinds and the impact from the front-loaded fiscal stimulus and consumer trade-in programme fade. Nevertheless, the extension of the US-China trade truce for another three months reduces the risk of an all-out trade war. Also, unlike previous years, we expect Beijing to prioritise the full implementation of its 2025 fiscal budget while modestly easing monetary policy to achieve its approximately 5% growth target. Plans to tackle sectoral overcapacity and disorderly price competition should help fight deflation.
Asset Classes
Bonds – at a glance
|
|
||||
|
Our view
Global bonds remain a core allocation in our foundation portfolios. Growing expectation of a 25bps Fed rate cut at the September meeting due to weakening growth data has put downward pressure on short-term interest rates. This is also likely to widen the yield differential between short- and long-dated bonds, as near-term bond yields are capped by rate cut expectations. Fed rate cuts will also drag future returns on cash deposits lower. Hence, we see an opportunity to lock in still-elevated yields via bonds, as returns on cash gradually decline. We expect the US 10-year bond yield to trade within the 4.00-4.25% range in the next 6-12 months as fiscal deficit and near-term inflation concerns prop up longer-maturity yields. Given this, we believe 5-7-year bond maturities offer the best risk-adjusted returns by striking a balance between attractive yields and fiscal/inflation risks.
Outstanding opportunistic views: We remain bullish US Treasury Inflation-Protected Securities (TIPS), US short-duration High Yield bonds, and UK government bonds (Gilts) (FX-unhedged).
We close our bullish view on EM Asia local currency bonds, as the relative attractiveness of EM Asia has diminished compared with other EM regions.
Key chart
Rising US rate cut expectations have led to a wider yield differential between US long-dated and short-dated bonds
Fig. 12 The Fed is expected to cut rates more than other major central banks; Yield differential between 10- and 2-year US government bonds is likely to stay within range
Fed, ECB and BoE rate cut expectations indicated by money markets, where T+1 denotes the next rate decision meeting*; Yield differential of US 10- and 2-year government bonds
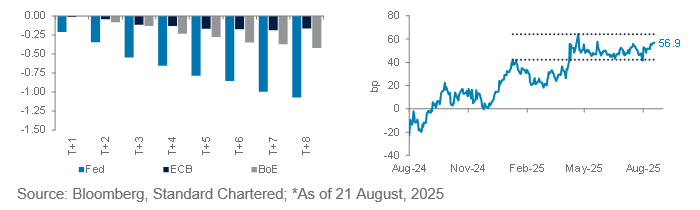
We continue to view global bonds as a core holding and have an Overweight view on EM local currency (LCY) government bonds. We believe benign EM inflation and relatively strong fiscal positions would result in high real (net-of-inflation) yields, while a weak USD would provide a tailwind. Moreover, EM LCY bonds have low correlation with Developed Markets (DMs), providing diversification benefits. We initiated opportunistic bullish EM Asia LCY bonds (unhedged) last month. However, they underperformed non-Asia counterparts as leading EM Asian economies remained resilient in enforcing policy support. We believe the risk-reward balance appears unattractive when compared with other EM regions, as such we close opportunistic bullish EM Asia LCY bonds (unhedged) with a profit of 4bp.
We have an Underweight view on DM Investment Grade corporate bonds as yield premia has been tight, considering the uncertainties around US growth. We are Neutral DM High Yield corporate bonds within our foundation allocation.
In our opportunistic allocation, we are bullish on short-dated US High Yield bonds, which offer attractive absolute yields and low expected default rates. Historical performance also suggests better risk-adjusted returns.
We are opportunistically bullish on US TIPS. The risk/reward is still attractive. US consumer and producer price inflation is likely to rise in the near term and fiscal and inflation uncertainty is likely to persist, potentially exerting upside risk to inflation expectations in the coming months.
We are also opportunistically bullish UK Gilts (FX-unhedged). We favour the nominal yield pick-up on Gilts over other DM government bonds. The UK labour market data continues to weaken, which should feed through to weaker wage growth and eventually contribute to disinflationary pressures. While inflation expectations may remain elevated in the near term, tight financial conditions should keep growth subdued and inflation in check. These factors would likely enable the BoE to cut rates further over the next 6-12 months.
Equity – at a glance
|
|
||||
|
|
||||
Our view
We retain our Overweight allocation to global equities, underpinned by strong earnings, expected dovish pivot by the Fed to bolster economic growth and expectations of a soft landing in the US.
We suggest maintaining a regionally diversified equity allocation and expect Asia ex-Japan equities to outperform global equities amid fading tariff headwinds. Within this region, we prefer markets with favourable policy support, including China and Korea equities. Both markets provide compelling valuations and measures to support innovative developments. India equities remain a core holding and we maintain a preference for mid-cap equities, where the earnings trend remains strong. We also have a core holding view in Japan and Europe ex-UK equities. Continual improvements in Japan’s shareholder returns and an economic recovery in the Euro area are supportive factors.
We retain a core holding in US equities. Sustained earnings upside across major growth stocks, driven by AI-related investments, come despite deteriorating leading indicators and prolonged tariff uncertainties, which weigh on economic growth. We suggest trimming excessive overconcentration in US equities and increasing exposure after a market consolidation.
Key chart
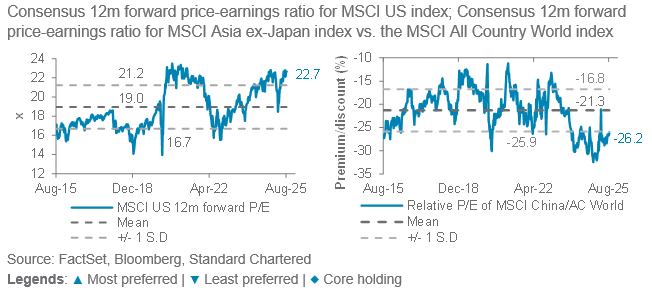
Stretched US equity valuations vs relatively inexpensive non-US markets
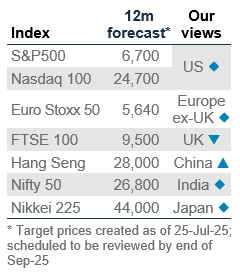
Fig. 13 US equity market valuations are close to a decade high. In contrast, Asia ex-Japan equities’ attractive valuations offer more compelling upside potential
Maintaining a regionally diversified allocation
Global equity markets continue to benefit from a robust earnings season and an improved macroeconomic backdrop, with reduced trade uncertainty. US equities remain a core allocation in our portfolios. Elevated valuations may limit near-term upside, with uncertainties around the monetization of corporate AI investments likely weighing on earnings estimates.
We have an Overweight view on Asia ex-Japan equities, within which we maintain a diversified allocation. De-escalating trade tensions and a weak USD are supportive factors, which could help to narrow the valuation gap between Asia ex-Japan and global equities.
We have an Underweight view on DM Investment Grade corporate bonds as yield premia has been tight, considering the uncertainties around US growth. We are Neutral DM High Yield corporate bonds within our foundation allocation.
Korea equities remain Overweight. The government’s value-up programme and resilient earnings growth serve as key catalysts for this market. Korea is projected to deliver the highest earnings growth in the region in 2026. Besides, the recent US-Korea trade deal has provided greater policy certainty. These factors are reflected in capital flows, with foreign net inflows in July reaching a 17-month high.
We have a core holding view on Japan equities. After the recent rally, we would use any overexposure to allocate to other Asia markets as tariffs hurt Japan’s earnings growth. Europe ex-UK equities are also a core holding as rising fiscal spending plans are offset by a negative earnings revision index.
Equity opportunistic views
|
Add US technology on a pullback
- We would initiate an opportunistic position in the US technology sector after a 5%* pullback. Seasonal market weakness could create this opportunity, while we are positive on the sector on a 6- to 12-month horizon. Earnings growth continues to be supportive, as growth in AI spending supports the semiconductor industry and cloud service providers. Software companies continue to integrate AI into their products and development, including the roll-out of AI agents, which can interact and make decisions like a person.
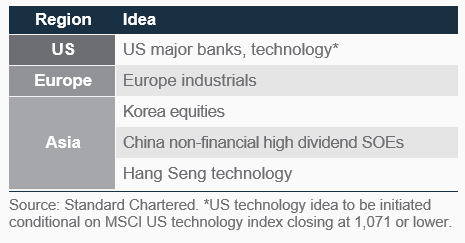
Fig. 14 Opportunistic ideas
Open bullish ideas
US major banks: We believe deregulation remains a tailwind for banks to lower their capital requirements and costs. Rate cuts from the Fed would be a headwind for interest margins but should be manageable if there are no significant surprises. On the other hand, lower rates support a soft landing in the economy, with further growth in loan demand, M&A activity and capital market financings. A sharp slowdown in the US economy is a risk.
Europe industrials: Germany is leadingEurope in plans to boost infrastructure and defence spending, which is consistent with the NATO agreement to raise defence spending from 2% to 5% of GDP. This supports the aerospace and defence, electrical equipment, machinery and construction industries, which form the bulk of the industrials sector. A sharp slowdown in Europe’s economy is a risk.
Korea equities continue to trade at a significant discount to Asia ex-Japan, and we expect the ‘Kospi 5,000’ committee to work towards better corporate governance to narrow the valuation discount. Proposed tax changes are worrying some investors, but policymakers are taking feedback and re-evaluating the proposals. We expect fund inflows to support the market. Weaker-than-expected policy impact is a risk.
China non-financial high-dividend state-owned enterprises (SOEs): Their predominantly domestic exposure means less direct exposure to trade concerns and more benefits from government stimulus plans. Non-financial SOEs are less exposed to the troubled property sector. Weaker-than-expected stimulus is a risk.
Hang Seng technology: Positive earnings surprises at major technology firms support the growth outlook. Progress in AI adoption and the government’s support for technology development are supportive of a valuation re-rating for Hang Seng technology. Valuations remain cheap compared to their US counterparts. Adverse regulatory changes are a risk.
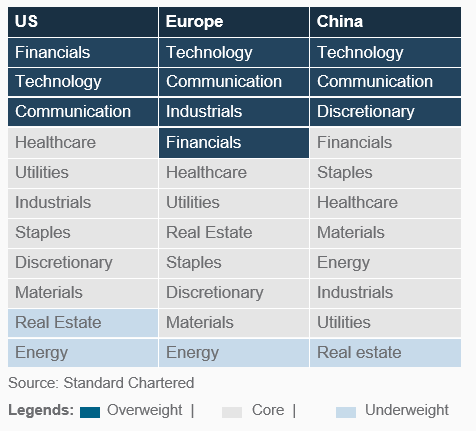
Sector views: Staying constructive
We remain constructive, with an Overweight on technology in the US, Europe and China, supported by AI investments and software developments. We also remain Overweight on financials (deregulation benefits) and communication services (digital ads and online entertainment growth) in the US. In Europe, we remain Overweight financials, where the dividend yield and valuation discount to the broader market remain attractive. We are Overweight industrials on the boost to infrastructure and defence spending. In China, we maintain exposure to improving consumption and AI adoption, with preference for technology, communication and discretionary. Companies in these sectors have strong balance sheets, generate strong cash flows and are investing heavily in AI infrastructure amid strong demand.
Fig. 15 Our sector views by region
FX – at a glance
|
Our view
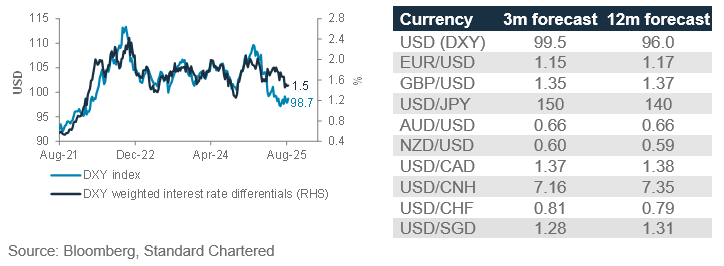
We expect the USD to grind gradually higher over the next 1-3 months, but we maintain our view of a weak USD over a 6- to 12-month horizon. We previously flagged a short-squeeze risk for the USD index (DXY), but positioning now appears to be off its extremes. In the short term, the USD is holding within a shallow uptrend channel, and the DXY appears to be approaching 99.5. However, we do not expect a sustained break above 100 and continue to see recent strength as an opportunity to re-establish weak USD views. Over a longer 6-12-month horizon, we continue to see a weaker USD on the back of US policy unpredictability, softening US growth and a likely restart of Fed rate cuts from September.
Over the next three months, we continue to expect EUR/USD to ease to 1.15. The EUR is likely to remain under pressure from a strong USD and trade policy uncertainty, while downward pressure on the JPY is likely to persist as the BoJ delays policy tightening as it assesses the impact of tariffs. However, the GBP could see more support as BoE rate cuts are delayed due to elevated inflation. In the long term, we expect GBP and JPY gains to drive our weak USD view, given the two currencies remain significantly undervalued versus the USD.
Key chart
The USD has weakened in the first half more than what is implied by rate differentials. We may see the relationship between the two re-establishing itself.
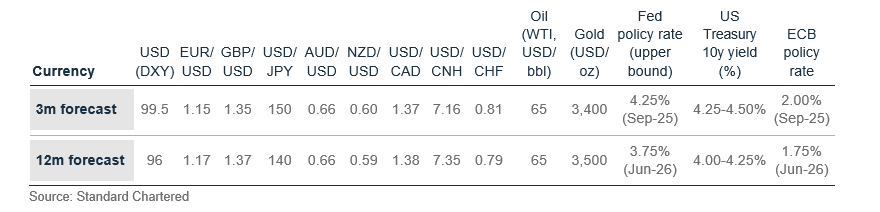
Fig. 16 USD is weaker than the value implied by rate differentials; FX forecast table
Looking beyond the USD short squeeze
Our long-term weak USD view notwithstanding, we have been flagging the risk of a short-term USD rebound in recent months, driven by a short squeeze. We now appear to be in the midst of a short squeeze, with the DXY rising gradually as excessively bearish investor positioning starts to normalise. For now, we expect this gradual uptrend in the USD to persist. However, we continue to expect the 100 resistance level to hold for the DXY as we believe both technicals and fundamentals remain insufficient for the USD to return to its pre-2025 range of 100-110. This means that any short-term USD rebound offers an opportunity to add to weak USD trades, whether within FX markets or in equities or bonds.
The focus is increasingly likely to shift to Fed policy, especially as ECB policy easing winds down. We expect the Fed to restart rate cuts in September. Interest rate differentials might very well be starting to re-establish themselves as a driver of the USD,
but this may prove to be bearish for the USD if this occurs against the backdrop of the ECB pausing and the Fed resuming rate cuts. Hence, we continue to expect the DXY to fall to 96 over 6-12 months.
In Europe, the focus is likely to shift to the GBP. Recently, weak labour market data has once again revived expectations of significant BoE rate cuts. However, BoE minutes demonstrated that inflation is still present, and cutting rates will not be a simple decision for the BoE. The magnitude of rate cuts may disappoint markets and result in more support for the GBP relative to the EUR in the near term. The JPY is similarly likely to face downward pressure as the BoJ delays policy tightening.
The CHF remains well supported by real rates. While Swiss nominal rates may be back at zero, low (and falling) inflation has meant real (net-of-inflation) yields have remained CHF supportive. A return to negative rates cannot be ruled out, but on balance, we expect this to leave USD/CHF in a 0.79-0.81 range.
Gold, crude oil – at a glance
|
|
||||
|
Our view
Gold to stay rangebound around USD 3,400/oz over the next 1-3 months until US growth risks become clearer.
Excess supply in the oil market remains a headwind. We expect West Texas Intermediate (WTI) crude oil prices to trade in a range around USD 65/bbl over the next 3-12 months. Geopolitical risks may result in temporary spikes in oil prices.
Key chart
Fig. 17 China gold imports have cooled
Net China gold imports (HS code 7108)
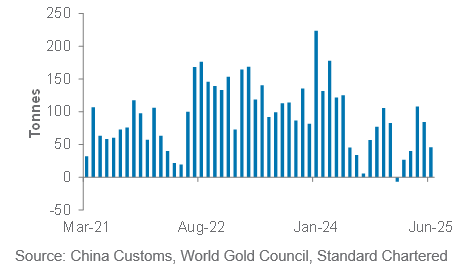
Fig. 19 Lower US real yields will entice investors to return to gold-backed ETFs
US 10-year real yields vs gold ETF holdings
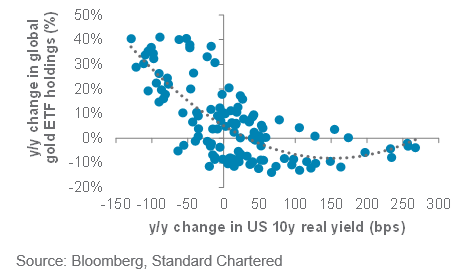
Fig. 18 China’s local gold prices have moved to a discount versus international levels
Difference between China local and international gold prices
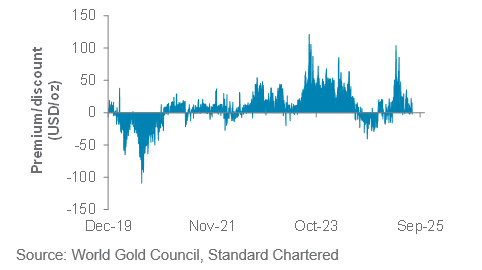
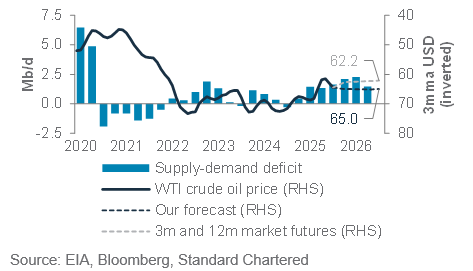
Fig. 20 The oil market is likely to remain in surplus this year, keeping prices in check
Oil supply-demand balance, price estimates
Gold outlook: Gold has once again failed to break above USD 3,400/oz sustainably over the past month as US tariff fears eased and risk assets continued to rally. Long-term structural drivers, such as global central bank demand, remain intact. However, we do not expect central bank buying alone to spur a breakout, especially with cooling Chinese demand. Instead, clearer signs of US growth risks, leading to lower real bond yields, would draw investors back into gold ETFs and lift prices toward our 12-month target around USD 3,500.
Oil outlook: We continue to expect oversupply in the oil market as OPEC+ gradually rolls back its 2022 cuts, bringing back about 2.2 million barrels per day since April until the end of September. Seasonal demand remains supportive but not enough to shift the broader surplus narrative. Near-term geopolitical risks, including disruptions to Russian supply through sanctions, remains a near-term upside risk, but we keep our three-month WTI forecast unchanged at USD 65/bbl.
Additional perspectives
Quant perspective
Long and short-term indicators are supportive of equities
|
|
||||
Summary
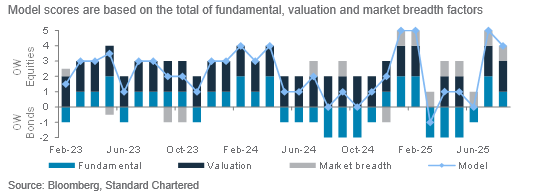
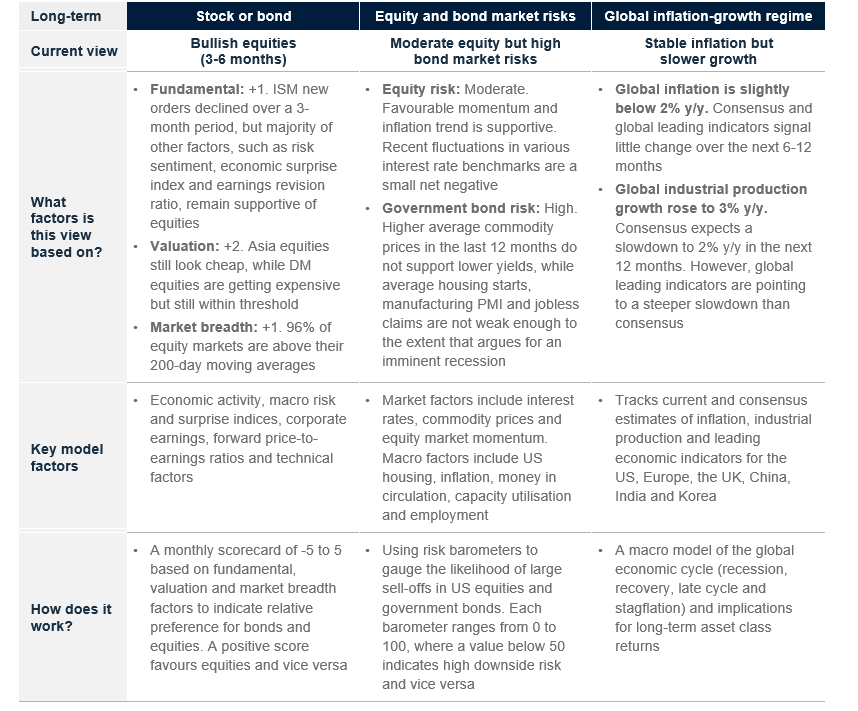
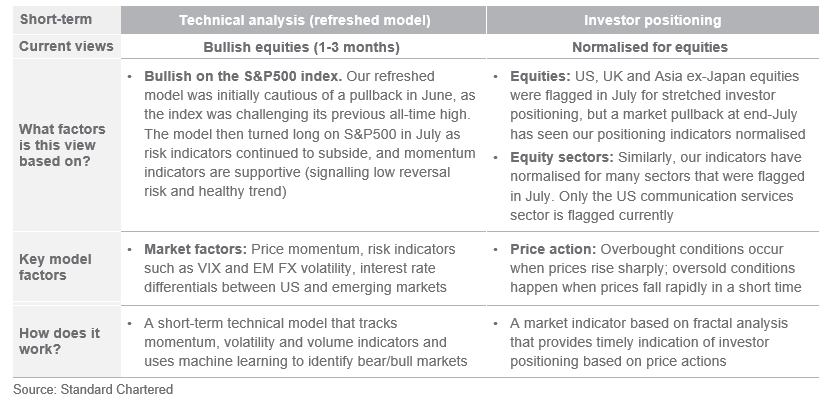
Long-term and short-term indicators are bullish risk assets. Long term: Our stock-bond model recorded an outperformance of 0.63% since turning very bullish on equities on 15 July. The model remains Overweight on equities in our latest update, but with a slightly lower score (from a maximum score of 5 to 4). In August, we saw a slight decline in the fundamental score to 1 from 2, as the three-month change in ISM new orders turned negative once again after falling below 50, indicating a potential contraction in economic activity. Other fundamental factors such as risk sentiment, the economic surprise index and the earnings revisions ratio remain positive for equities. Valuation factors remain strongly supportive of equities, but DM equities are looking increasingly expensive. Meanwhile, market breadth factors remain moderately supportive, as most equity markets remain above their 200-day moving averages.
Our refreshed technical model is currently bullish the S&P500 index due to subdued risk indicators such as VIX and EM FX volatility and healthy momentum signals (low reversal risk and stable trend).We relaunched our technical model for the S&P500 index this month to enhance the prior model’s performance. The previous model recorded a year-to-date gain of 12.8% versus S&P500’s 9.7%, as it accurately timed the weak market in March-April. Based on our simulation, our new model would have achieved a stronger return of 16.1% over the same period, and its signals are generally more stable.
Short term: Investor positioning is not as stretched as July indicators. In July, our market diversity indicators flagged stretched investor positioning in US, UK and Asia ex-Japan equities and several equity sectors. Many of these indicators normalised at the end of July as markets temporarily pulled back before re-gaining their footing in August. Only the US communication services sector is currently being flagged for stretched positioning.
Key chart
Our stock-bond model score declined slightly to 4 from a maximum of 5 due to ISM new orders declining over the past three months.
Fig. 21 Breakdown of our stock-bond rotation model’s scores since inception in Feb-23
Our refreshed market model for the S&P500 index stays bullish, as risk indicators such as VIX are subdued and momentum signals are healthy.
Fig. 22 Our technical model is bullish on the S&P500 index
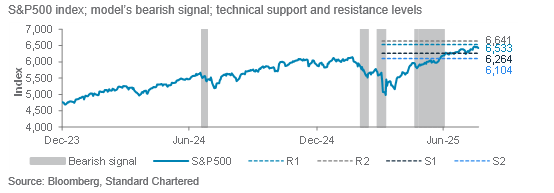
Fig. 23 Long- and short-term quantitative models are bullish risky assets
Long-term models below have a typical time horizon of 3-6 months, while short-term models have a 1-3-month horizon
Performance review
Foundation: Asset allocation summary
Foundation+: Asset allocation summary
Market performance summary
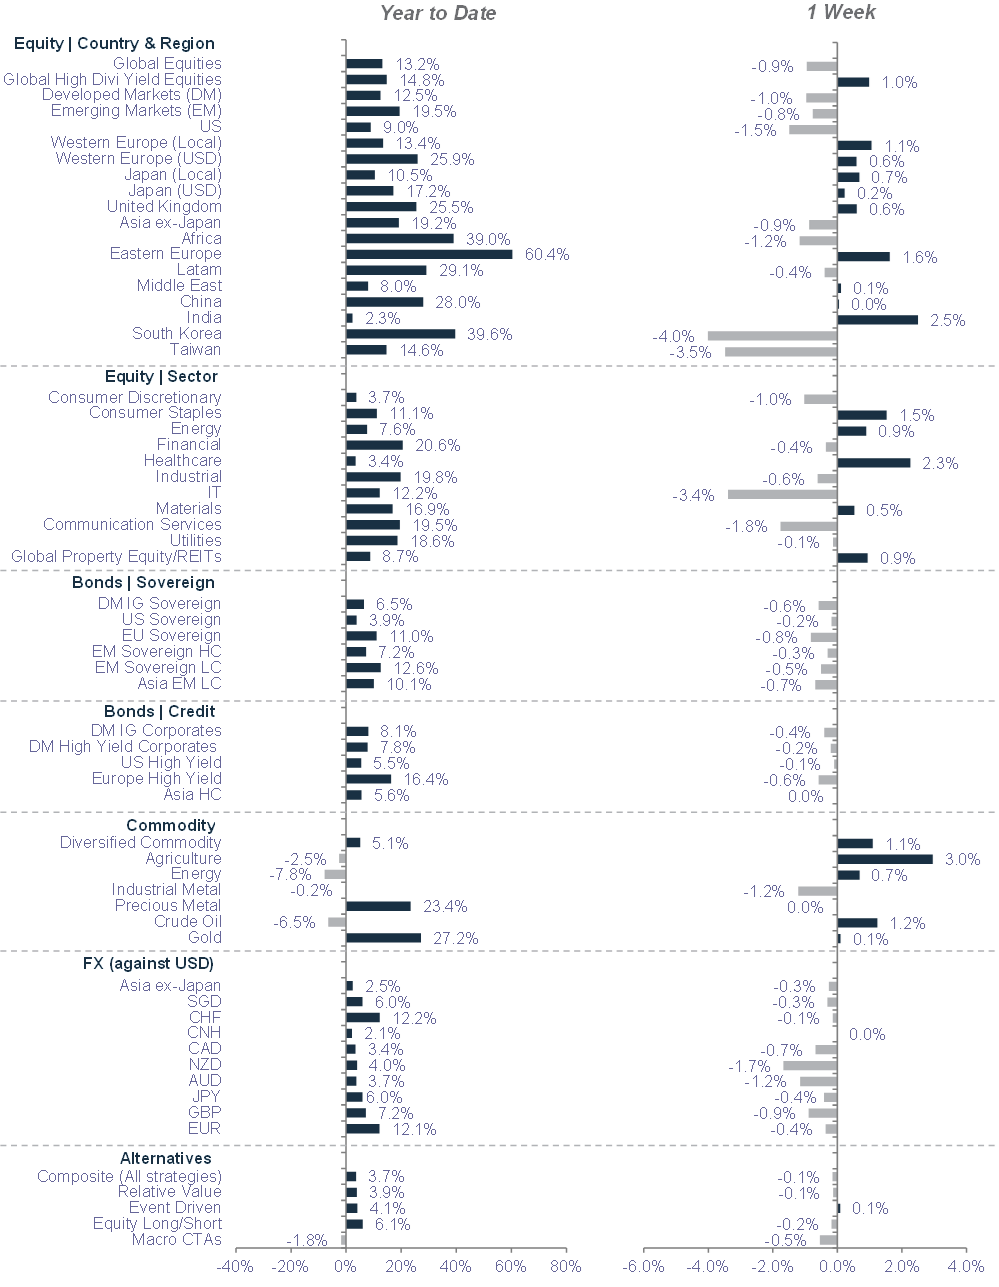
Source: MSCI, JPMorgan, Citigroup, Dow Jones, HFRX, FTSE, Bloomberg, Standard Chartered
*All performance shown in USD terms, unless otherwise stated
*YTD performance data from 31 Dec 2024 to 21 Aug 2025; 1-week performance from 14 to 21 Aug 2025
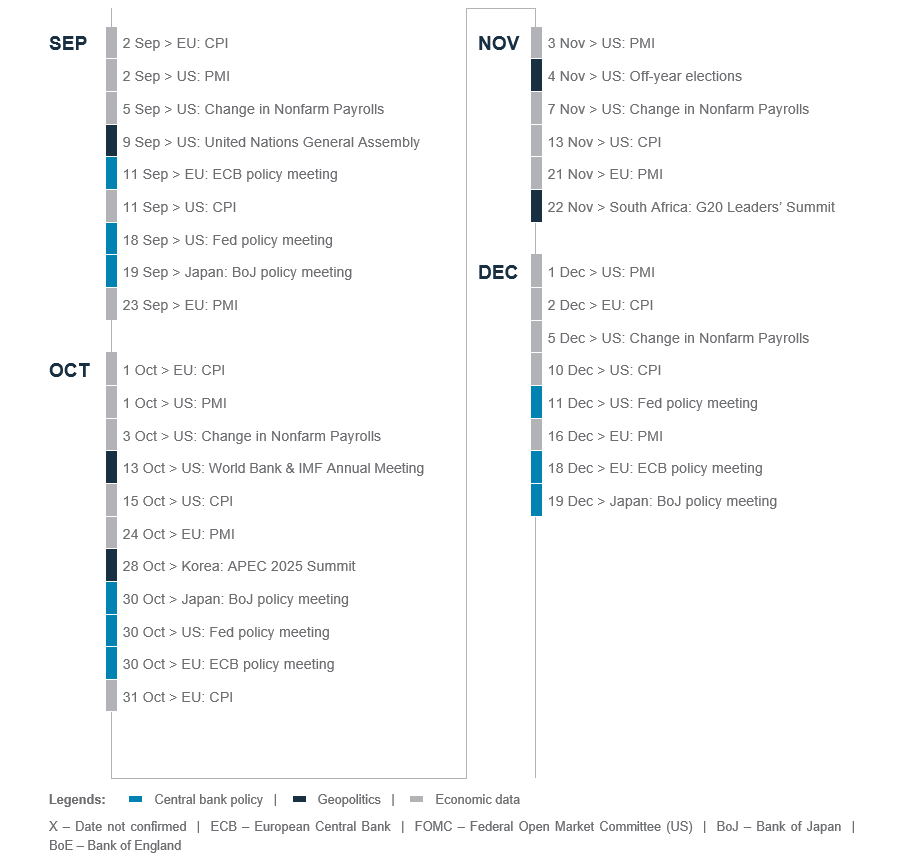
Our key forecasts and calendar events
Today, Tomorrow and Forever


Explanatory notes
1. The figures on page 5 show allocations for a moderately aggressive risk profile only – different risk profiles may produce significantly different asset allocation results. Page 5 is only an example, provided for general information only and they do not constitute investment advice, an offer, recommendation or solicitation. They do not take into account the specific investment objectives, needs or risk tolerances of a particular person or class of persons and they have not been prepared for any particular person or class of persons.
2. Contingent Convertibles are complex financial instruments and are not a suitable or appropriate investment for all investors. This document is not an offer to sell or an invitation to buy any securities or any beneficial interests therein. Contingent convertible securities are not intended to be sold and should not be sold to retail clients in the European Economic Area (EEA) (each as defined in the Policy Statement on the Restrictions on the Retail Distribution of Regulatory Capital Instruments (Feedback to CP14/23 and Final Rules) (“Policy Statement”), read together with the Product Intervention (Contingent Convertible Instruments and Mutual Society Shares) Instrument 2015 (“Instrument”, and together with the Policy Statement, the “Permanent Marketing Restrictions”), which were published by the United Kingdom’s Financial Conduct Authority in June 2015), other than in circumstances that do not give rise to a contravention of the Permanent Marketing Restrictions.
Disclosure
This document is confidential and may also be privileged. If you are not the intended recipient, please destroy all copies and notify the sender immediately. This document is being distributed for general information only and is subject to the relevant disclaimers available at our Standard Chartered website under Regulatory disclosures. It is not and does not constitute research material, independent research, an offer, recommendation or solicitation to enter into any transaction or adopt any hedging, trading or investment strategy, in relation to any securities or other financial instruments. This document is for general evaluation only. It does not take into account the specific investment objectives, financial situation or particular needs of any particular person or class of persons and it has not been prepared for any particular person or class of persons. You should not rely on any contents of this document in making any investment decisions. Before making any investment, you should carefully read the relevant offering documents and seek independent legal, tax and regulatory advice. In particular, we recommend you to seek advice regarding the suitability of the investment product, taking into account your specific investment objectives, financial situation or particular needs, before you make a commitment to purchase the investment product. Opinions, projections and estimates are solely those of SC at the date of this document and subject to change without notice. Past performance is not indicative of future results and no representation or warranty is made regarding future performance. The value of investments, and the income from them, can go down as well as up, and you may not recover the amount of your original investment. You are not certain to make a profit and may lose money. Any forecast contained herein as to likely future movements in rates or prices or likely future events or occurrences constitutes an opinion only and is not indicative of actual future movements in rates or prices or actual future events or occurrences (as the case may be). This document must not be forwarded or otherwise made available to any other person without the express written consent of the Standard Chartered Group (as defined below). Standard Chartered Bank is incorporated in England with limited liability by Royal Charter 1853 Reference Number ZC18. The Principal Office of the Company is situated in England at 1 Basinghall Avenue, London, EC2V 5DD. Standard Chartered Bank is authorised by the Prudential Regulation Authority and regulated by the Financial Conduct Authority and Prudential Regulation Authority. Standard Chartered PLC, the ultimate parent company of Standard Chartered Bank, together with its subsidiaries and affiliates (including each branch or representative office), form the Standard Chartered Group. Standard Chartered Private Bank is the private banking division of Standard Chartered. Private banking activities may be carried out internationally by different legal entities and affiliates within the Standard Chartered Group (each an “SC Group Entity”) according to local regulatory requirements. Not all products and services are provided by all branches, subsidiaries and affiliates within the Standard Chartered Group. Some of the SC Group Entities only act as representatives of Standard Chartered Private Bank and may not be able to offer products and services or offer advice to clients.
Copyright © 2025, Accounting Research & Analytics, LLC d/b/a CFRA (and its affiliates, as applicable). Reproduction of content provided by CFRA in any form is prohibited except with the prior written permission of CFRA. CFRA content is not investment advice and a reference to or observation concerning a security or investment provided in the CFRA SERVICES is not a recommendation to buy, sell or hold such investment or security or make any other investment decisions. The CFRA content contains opinions of CFRA based upon publicly-available information that CFRA believes to be reliable and the opinions are subject to change without notice. This analysis has not been submitted to, nor received approval from, the United States Securities and Exchange Commission or any other regulatory body. While CFRA exercised due care in compiling this analysis, CFRA, ITS THIRD-PARTY SUPPLIERS, AND ALL RELATED ENTITIES SPECIFICALLY DISCLAIM ALL WARRANTIES, EXPRESS OR IMPLIED, INCLUDING, BUT NOT LIMITED TO, ANY WARRANTIES OF MERCHANTABILITY OR FITNESS FOR A PARTICULAR PURPOSE OR USE, to the full extent permitted by law, regarding the accuracy, completeness, or usefulness of this information and assumes no liability with respect to the consequences of relying on this information for investment or other purposes. No content provided by CFRA (including ratings, credit-related analyses and data, valuations, model, software or other application or output therefrom) or any part thereof may be modified, reverse engineered, reproduced or distributed in any form by any means, or stored in a database or retrieval system, without the prior written permission of CFRA, and such content shall not be used for any unlawful or unauthorized purposes. CFRA and any third-party providers, as well as their directors, officers, shareholders, employees or agents do not guarantee the accuracy, completeness, timeliness or availability of such content. In no event shall CFRA, its affiliates, or their third-party suppliers be liable for any direct, indirect, special, or consequential damages, costs, expenses, legal fees, or losses (including lost income or lost profit and opportunity costs) in connection with a subscriber’s, subscriber’s customer’s, or other’s use of CFRA’s content.
Market Abuse Regulation (MAR) Disclaimer
Banking activities may be carried out internationally by different branches, subsidiaries and affiliates within the Standard Chartered Group according to local regulatory requirements. Opinions may contain outright “buy”, “sell”, “hold” or other opinions. The time horizon of this opinion is dependent on prevailing market conditions and there is no planned frequency for updates to the opinion. This opinion is not independent of Standard Chartered Group’s trading strategies or positions. Standard Chartered Group and/or its affiliates or its respective officers, directors, employee benefit programmes or employees, including persons involved in the preparation or issuance of this document may at any time, to the extent permitted by applicable law and/or regulation, be long or short any securities or financial instruments referred to in this document or have material interest in any such securities or related investments. Therefore, it is possible, and you should assume, that Standard Chartered Group has a material interest in one or more of the financial instruments mentioned herein. Please refer to our Standard Chartered website under Regulatory disclosures for more detailed disclosures, including past opinions/ recommendations in the last 12 months and conflict of interests, as well as disclaimers. A covering strategist may have a financial interest in the debt or equity securities of this company/issuer. All covering strategist are licensed to provide investment recommendations under Monetary Authority of Singapore or Hong Kong Monetary Authority. This document must not be forwarded or otherwise made available to any other person without the express written consent of Standard Chartered Group.
Sustainable Investments
Any ESG data used or referred to has been provided by Morningstar, Sustainalytics, MSCI or Bloomberg. Refer to 1) Morningstar website under Sustainable Investing, 2) Sustainalytics website under ESG Risk Ratings, 3) MCSI website under ESG Business Involvement Screening Research and 4) Bloomberg green, social & sustainability bonds guide for more information. The ESG data is as at the date of publication based on data provided, is for informational purpose only and is not warranted to be complete, timely, accurate or suitable for a particular purpose, and it may be subject to change. Sustainable Investments (SI): This refers to funds that have been classified as ‘ESG Intentional Investments – Overall’ by Morningstar. SI funds have explicitly stated in their prospectus and regulatory filings that they either incorporate ESG factors into the investment process or have a thematic focus on the environment, gender diversity, low carbon, renewable energy, water or community development. For equity, it refers to shares/stocks issued by companies with Sustainalytics ESG Risk Rating of Low/Negligible. For bonds, it refers to debt instruments issued by issuers with Sustainalytics ESG Risk Rating of Low/Negligible, and/or those being certified green, social, sustainable bonds by Bloomberg. For structured products, it refers to products that are issued by any issuer who has a Sustainable Finance framework that aligns with Standard Chartered’s Green and Sustainable Product Framework, with underlying assets that are part of the Sustainable Investment universe or separately approved by Standard Chartered’s Sustainable Finance Governance Committee. Sustainalytics ESG risk ratings shown are factual and are not an indicator that the product is classified or marketed as “green”, “sustainable” or similar under any particular classification system or framework.
Country/Market Specific Disclosures
Bahrain: This document is being distributed in Bahrain by Standard Chartered Bank, Bahrain Branch, having its address at P.O. 29, Manama, Kingdom of Bahrain, is a branch of Standard Chartered Bank and is licensed by the Central Bank of Bahrain as a conventional retail bank. Botswana: This document is being distributed in Botswana by, and is attributable to, Standard Chartered Bank Botswana Limited which is a financial institution licensed under the Section 6 of the Banking Act CAP 46.04 and is listed in the Botswana Stock Exchange. Brunei Darussalam: This document is being distributed in Brunei Darussalam by, and is attributable to, Standard Chartered Bank (Brunei Branch) | Registration Number RFC/61 and Standard Chartered Securities (B) Sdn Bhd | Registration Number RC20001003. Standard Chartered Bank is incorporated in England with limited liability by Royal Charter 1853 Reference Number ZC18. Standard Chartered Securities (B) Sdn Bhd is a limited liability company registered with the Registry of Companies with Registration Number RC20001003 and licensed by Brunei Darussalam Central Bank as a Capital Markets Service License Holder with License Number BDCB/R/CMU/S3-CL and it is authorised to conduct Islamic investment business through an Islamic window. China Mainland: This document is being distributed in China by, and is attributable to, Standard Chartered Bank (China) Limited which is mainly regulated by National Financial Regulatory Administration (NFRA), State Administration of Foreign Exchange (SAFE), and People’s Bank of China (PBOC). Hong Kong: In Hong Kong, this document, except for any portion advising on or facilitating any decision on futures contracts trading, is distributed by Standard Chartered Bank (Hong Kong) Limited (“SCBHK”), a subsidiary of Standard Chartered PLC. SCBHK has its registered address at 32/F, Standard Chartered Bank Building, 4-4A Des Voeux Road Central, Hong Kong and is regulated by the Hong Kong Monetary Authority and registered with the Securities and Futures Commission (“SFC”) to carry on Type 1 (dealing in securities), Type 4 (advising on securities), Type 6 (advising on corporate finance) and Type 9 (asset management) regulated activity under the Securities and Futures Ordinance (Cap. 571) (“SFO”) (CE No. AJI614). The contents of this document have not been reviewed by any regulatory authority in Hong Kong and you are advised to exercise caution in relation to any offer set out herein. If you are in doubt about any of the contents of this document, you should obtain independent professional advice. Any product named herein may not be offered or sold in Hong Kong by means of any document at any time other than to “professional investors” as defined in the SFO and any rules made under that ordinance. In addition, this document may not be issued or possessed for the purposes of issue, whether in Hong Kong or elsewhere, and any interests may not be disposed of, to any person unless such person is outside Hong Kong or is a “professional investor” as defined in the SFO and any rules made under that ordinance, or as otherwise may be permitted by that ordinance. In Hong Kong, Standard Chartered Private Bank is the private banking division of SCBHK, a subsidiary of Standard Chartered PLC. Ghana: Standard Chartered Bank Ghana Limited accepts no liability and will not be liable for any loss or damage arising directly or indirectly (including special, incidental or consequential loss or damage) from your use of these documents. Past performance is not indicative of future results and no representation or warranty is made regarding future performance. You should seek advice from a financial adviser on the suitability of an investment for you, taking into account these factors before making a commitment to invest in an investment. To unsubscribe from receiving further updates, please send an email to feedback.ghana@sc.com. Please do not reply to this email. Call our Priority Banking on 0302610750 for any questions or service queries. You are advised not to send any confidential and/or important information to Standard Chartered via e-mail, as Standard Chartered makes no representations or warranties as to the security or accuracy of any information transmitted via e-mail. Standard Chartered shall not be responsible for any loss or damage suffered by you arising from your decision to use e-mail to communicate with the Bank. India: This document is being distributed in India by Standard Chartered in its capacity as a distributor of mutual funds and referrer of any other third party financial products. Standard Chartered does not offer any ‘Investment Advice’ as defined in the Securities and Exchange Board of India (Investment Advisers) Regulations, 2013 or otherwise. Services/products related securities business offered by Standard Charted are not intended for any person, who is a resident of any jurisdiction, the laws of which imposes prohibition on soliciting the securities business in that jurisdiction without going through the registration requirements and/or prohibit the use of any information contained in this document. Indonesia: This document is being distributed in Indonesia by Standard Chartered Bank, Indonesia branch, which is a financial institution licensed and supervised by Otoritas Jasa Keuangan (Financial Service Authority) and Bank Indonesia. Jersey: In Jersey, Standard Chartered Private Bank is the Registered Business Name of the Jersey Branch of Standard Chartered Bank. The Jersey Branch of Standard Chartered Bank is regulated by the Jersey Financial Services Commission. Copies of the latest audited accounts of Standard Chartered Bank are available from its principal place of business in Jersey: PO Box 80, 15 Castle Street, St Helier, Jersey JE4 8PT. Standard Chartered Bank is incorporated in England with limited liability by Royal Charter in 1853 Reference Number ZC 18. The Principal Office of the Company is situated in England at 1 Basinghall Avenue, London, EC2V 5DD. Standard Chartered Bank is authorised by the Prudential Regulation Authority and regulated by the Financial Conduct Authority and Prudential Regulation Authority. The Jersey Branch of Standard Chartered Bank is also an authorised financial services provider under license number 44946 issued by the Financial Sector Conduct Authority of the Republic of South Africa. Jersey is not part of the United Kingdom and all business transacted with Standard Chartered Bank, Jersey Branch and other SC Group Entity outside of the United Kingdom, are not subject to some or any of the investor protection and compensation schemes available under United Kingdom law. Kenya: This document is being distributed in Kenya by and is attributable to Standard Chartered Bank Kenya Limited. Investment Products and Services are distributed by Standard Chartered Investment Services Limited, a wholly owned subsidiary of Standard Chartered Bank Kenya Limited that is licensed by the Capital Markets Authority in Kenya, as a Fund Manager. Standard Chartered Bank Kenya Limited is regulated by the Central Bank of Kenya. Malaysia: This document is being distributed in Malaysia by Standard Chartered Bank Malaysia Berhad (“SCBMB”). Recipients in Malaysia should contact SCBMB in relation to any matters arising from, or in connection with, this document. This document has not been reviewed by the Securities Commission Malaysia. The product lodgement, registration, submission or approval by the Securities Commission of Malaysia does not amount to nor indicate recommendation or endorsement of the product, service or promotional activity. Investment products are not deposits and are not obligations of, not guaranteed by, and not protected by SCBMB or any of the affiliates or subsidiaries, or by Perbadanan Insurans Deposit Malaysia, any government or insurance agency. Investment products are subject to investment risks, including the possible loss of the principal amount invested. SCBMB expressly disclaim any liability and responsibility for any loss arising directly or indirectly (including special, incidental or consequential loss or damage) arising from the financial losses of the Investment Products due to market condition. Nigeria: This document is being distributed in Nigeria by Standard Chartered Bank Nigeria Limited (SCB Nigeria), a bank duly licensed and regulated by the Central Bank of Nigeria. SCB Nigeria accepts no liability for any loss or damage arising directly or indirectly (including special, incidental or consequential loss or damage) from your use of these documents. You should seek advice from a financial adviser on the suitability of an investment for you, taking into account these factors before making a commitment to invest in an investment. To unsubscribe from receiving further updates, please send an email to clientcare.ng@sc.com requesting to be removed from our mailing list. Please do not reply to this email. Call our Priority Banking on 02 012772514 for any questions or service queries. SCB Nigeria shall not be responsible for any loss or damage arising from your decision to send confidential and/or important information to Standard Chartered via e-mail. SCB Nigeria makes no representations or warranties as to the security or accuracy of any information transmitted via e-mail. Pakistan: This document is being distributed in Pakistan by, and attributable to Standard Chartered Bank (Pakistan) Limited having its registered office at PO Box 5556, I.I Chundrigar Road Karachi, which is a banking company registered with State Bank of Pakistan under Banking Companies Ordinance 1962 and is also having licensed issued by Securities & Exchange Commission of Pakistan for Security Advisors. Standard Chartered Bank (Pakistan) Limited acts as a distributor of mutual funds and referrer of other third-party financial products. Singapore: This document is being distributed in Singapore by, and is attributable to, Standard Chartered Bank (Singapore) Limited (Registration No. 201224747C/ GST Group Registration No. MR-8500053-0, “SCBSL”). Recipients in Singapore should contact SCBSL in relation to any matters arising from, or in connection with, this document. SCBSL is an indirect wholly owned subsidiary of Standard Chartered Bank and is licensed to conduct banking business in Singapore under the Singapore Banking Act, 1970. Standard Chartered Private Bank is the private banking division of SCBSL. IN RELATION TO ANY SECURITY OR SECURITIES-BASED DERIVATIVES CONTRACT REFERRED TO IN THIS DOCUMENT, THIS DOCUMENT, TOGETHER WITH THE ISSUER DOCUMENTATION, SHALL BE DEEMED AN INFORMATION MEMORANDUM (AS DEFINED IN SECTION 275 OF THE SECURITIES AND FUTURES ACT, 2001 (“SFA”)). THIS DOCUMENT IS INTENDED FOR DISTRIBUTION TO ACCREDITED INVESTORS, AS DEFINED IN SECTION 4A(1)(a) OF THE SFA, OR ON THE BASIS THAT THE SECURITY OR SECURITIES-BASED DERIVATIVES CONTRACT MAY ONLY BE ACQUIRED AT A CONSIDERATION OF NOT LESS THAN S$200,000 (OR ITS EQUIVALENT IN A FOREIGN CURRENCY) FOR EACH TRANSACTION. Further, in relation to any security or securities-based derivatives contract, neither this document nor the Issuer Documentation has been registered as a prospectus with the Monetary Authority of Singapore under the SFA. Accordingly, this document and any other document or material in connection with the offer or sale, or invitation for subscription or purchase, of the product may not be circulated or distributed, nor may the product be offered or sold, or be made the subject of an invitation for subscription or purchase, whether directly or indirectly, to persons other than a relevant person pursuant to section 275(1) of the SFA, or any person pursuant to section 275(1A) of the SFA, and in accordance with the conditions specified in section 275 of the SFA, or pursuant to, and in accordance with the conditions of, any other applicable provision of the SFA. In relation to any collective investment schemes referred to in this document, this document is for general information purposes only and is not an offering document or prospectus (as defined in the SFA). This document is not, nor is it intended to be (i) an offer or solicitation of an offer to buy or sell any capital markets product; or (ii) an advertisement of an offer or intended offer of any capital markets product. Deposit Insurance Scheme: Singapore dollar deposits of non-bank depositors are insured by the Singapore Deposit Insurance Corporation, for up to S$100,000 in aggregate per depositor per Scheme member by law. Foreign currency deposits, dual currency investments, structured deposits and other investment products are not insured. This advertisement has not been reviewed by the Monetary Authority of Singapore. Taiwan: SC Group Entity or Standard Chartered Bank (Taiwan) Limited (“SCB (Taiwan)”) may be involved in the financial instruments contained herein or other related financial instruments. The author of this document may have discussed the information contained herein with other employees or agents of SC or SCB (Taiwan). The author and the above-mentioned employees of SC or SCB (Taiwan) may have taken related actions in respect of the information involved (including communication with customers of SC or SCB (Taiwan) as to the information contained herein). The opinions contained in this document may change, or differ from the opinions of employees of SC or SCB (Taiwan). SC and SCB (Taiwan) will not provide any notice of any changes to or differences between the above-mentioned opinions. This document may cover companies with which SC or SCB (Taiwan) seeks to do business at times and issuers of financial instruments. Therefore, investors should understand that the information contained herein may serve as specific purposes as a result of conflict of interests of SC or SCB (Taiwan). SC, SCB (Taiwan), the employees (including those who have discussions with the author) or customers of SC or SCB (Taiwan) may have an interest in the products, related financial instruments or related derivative financial products contained herein; invest in those products at various prices and on different market conditions; have different or conflicting interests in those products. The potential impacts include market makers’ related activities, such as dealing, investment, acting as agents, or performing financial or consulting services in relation to any of the products referred to in this document. UAE: DIFC – Standard Chartered Bank is incorporated in England with limited liability by Royal Charter 1853 Reference Number ZC18.The Principal Office of the Company is situated in England at 1 Basinghall Avenue, London, EC2V 5DD. Standard Chartered Bank is authorised by the Prudential Regulation Authority and regulated by the Financial Conduct Authority and Prudential Regulation Authority. Standard Chartered Bank, Dubai International Financial Centre having its offices at Dubai International Financial Centre, Building 1, Gate Precinct, P.O. Box 999, Dubai, UAE is a branch of Standard Chartered Bank and is regulated by the Dubai Financial Services Authority (“DFSA”). This document is intended for use only by Professional Clients and is not directed at Retail Clients as defined by the DFSA Rulebook. In the DIFC we are authorised to provide financial services only to clients who qualify as Professional Clients and Market Counterparties and not to Retail Clients. As a Professional Client you will not be given the higher retail client protection and compensation rights and if you use your right to be classified as a Retail Client we will be unable to provide financial services and products to you as we do not hold the required license to undertake such activities. For Islamic transactions, we are acting under the supervision of our Shariah Supervisory Committee. Relevant information on our Shariah Supervisory Committee is currently available on the Standard Chartered Bank website in the Islamic banking section. For residents of the UAE – Standard Chartered UAE (“SC UAE”) is licensed by the Central Bank of the U.A.E. SC UAE is licensed by Securities and Commodities Authority to practice Promotion Activity. SC UAE does not provide financial analysis or consultation services in or into the UAE within the meaning of UAE Securities and Commodities Authority Decision No. 48/r of 2008 concerning financial consultation and financial analysis. Uganda: Our Investment products and services are distributed by Standard Chartered Bank Uganda Limited, which is licensed by the Capital Markets Authority as an investment adviser. United Kingdom: In the UK, Standard Chartered Bank is authorised by the Prudential Regulation Authority and regulated by the Financial Conduct Authority and Prudential Regulation Authority. This communication has been approved by Standard Chartered Bank for the purposes of Section 21 (2) (b) of the United Kingdom’s Financial Services and Markets Act 2000 (“FSMA”) as amended in 2010 and 2012 only. Standard Chartered Bank (trading as Standard Chartered Private Bank) is also an authorised financial services provider (license number 45747) in terms of the South African Financial Advisory and Intermediary Services Act, 2002. The Materials have not been prepared in accordance with UK legal requirements designed to promote the independence of investment research, and that it is not subject to any prohibition on dealing ahead of the dissemination of investment research. Vietnam: This document is being distributed in Vietnam by, and is attributable to, Standard Chartered Bank (Vietnam) Limited which is mainly regulated by State Bank of Vietnam (SBV). Recipients in Vietnam should contact Standard Chartered Bank (Vietnam) Limited for any queries regarding any content of this document. Zambia: This document is distributed by Standard Chartered Bank Zambia Plc, a company incorporated in Zambia and registered as a commercial bank and licensed by the Bank of Zambia under the Banking and Financial Services Act Chapter 387 of the Laws of Zambia.