28 April 2023
Global Market Outlook
Global Market Outlook
Fade the “melt-up”
We continue to expect a US recession in the next 6-12 months. We favour bonds over equities, government bonds over High Yield bonds, Asian equities over US/European equities and multi-asset income strategies.
Short-term indicators warn of a temporary period of equity outperformance, the so-called “melt-up” trade. Investor positioning, in particular, is too bearish and may have to normalise first.
Such a move is likely to open an opportunity for long-term investors to rotate into our preferred assets. We expect the USD to extend its recent weakness.
Is weak market sentiment/positioning a contrarian signal?
What are the key macro factors to watch in the near term?
What are your quant models telling us?
Strategy
Investment strategy and key themes
|
|
||||
|

Our top preferences
(12-month outlook)
Foundation overweights
- Government Bonds, gold
- In equities: Asia ex-Japan
- In bonds: Developed Market Investment Grade government, Asia USD bonds
Sector overweights
- US: Healthcare, Staples, Utilities
- Europe: Utilities
- China: Comms. Services, Consumer Discretionary, Technology, Industrials
FX views
- Modestly weaker USD
Structural macro trends*
- A digital tomorrow
- Preparing for an ageing world
- From unipolarity to multipolarity
- Investing in a climate-constrained world
*Individual reports available
Fade the “melt-up”
- We continue to expect a US recession in the next 6-12 months. We favour bonds over equities, government bonds over High Yield (HY) bonds, Asian equities over US/European equities and multi-asset income strategies.
- Short-term indicators warn of a temporary period of equity outperformance, the so-called “melt-up” trade. Investor positioning, in particular, is too bearish and may have to normalise first.
- Such a move is likely to open an opportunity for long-term investors to rotate into our preferred assets. We expect the USD to extend its recent weakness.
Bridging the gulf between macro and market signals
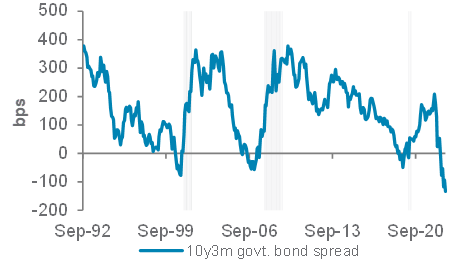
Traditional recession indicators continue to point to a relatively high probability of a US recession over the next 6-12 months. This is illustrated by warning signs across most of our US recession checklist, a high recession probability on our quantitative model and a still-bearish signal from our growth-inflation model. Learnings from the last four US recessions inform us that an ‘un-inversion’ of the US government bond yield curve (whereby short-term yields once again fall below long-term yields) in the coming months would also signal that a recession is more imminent.
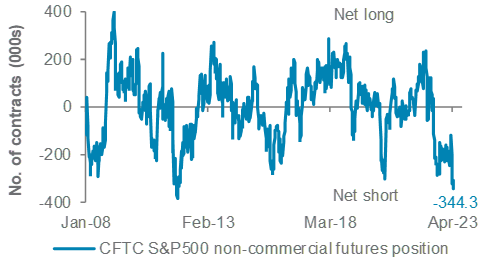
Despite this backdrop, global equity markets have remained remarkably resilient. A robust US job market, leading to sustained consumption, and an extremely bearish investor positioning are likely behind the resilience. Several market-based indicators are in sharp contrast with the fundamental backdrop. The S&P500 index positioning data supports anecdotal evidence that many investors have already positioned for a bearish outcome. Fund manager surveys illustrate similarly bearish sentiment. This likely points to sustained resilience, and even continuation of the ongoing rally in risk assets in the near term, because extremely bearish positioning data has historically often resulted in a short-term “melt-up” in equities.
Technical indicators are lacklustre. The S&P500 index is struggling to break above resistance close to 4,200, market breadth remains narrow and the technical indicator from our quantitative models remains neutral. Other short-term indicators, such as our market diversity indicator or the “Greed & Fear” index, remain largely neutral.
Fig. 1 Net-short positions on US equities most extreme since 2011, posing risk of an extended rebound
US CFTC investor positioning on S&P500 index futures
Equities – the short-term “melt-up” trade
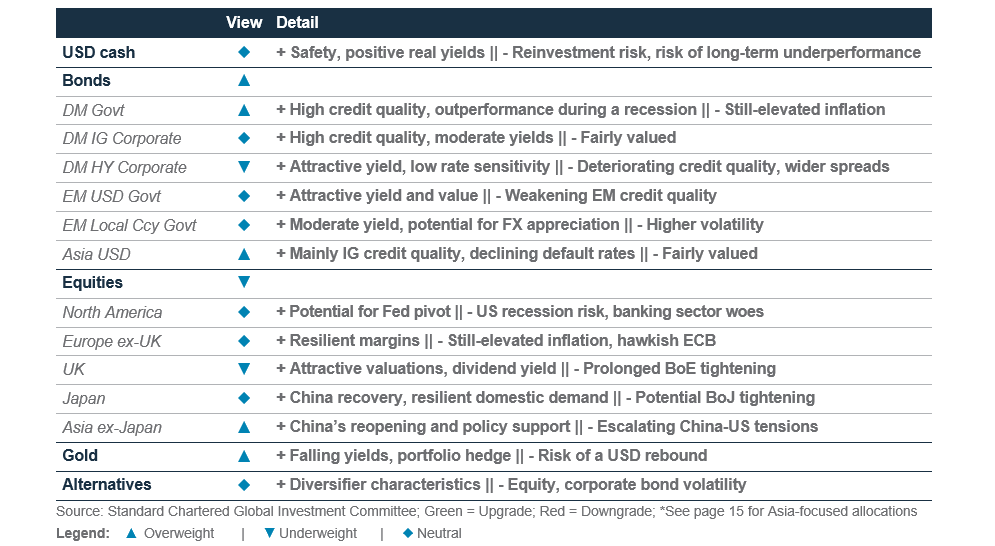
The figure below sums up what we see as a gulf between long-term (6-12m) fundamental indicators and short-term (1-3m) market indicators.
Fig. 3 Long-term (6-12m) indicators point to a US recession and downside for risk assets, but some short-term (1-3m) market indicators remain positive
Risk asset signals from key US macro and market indicators
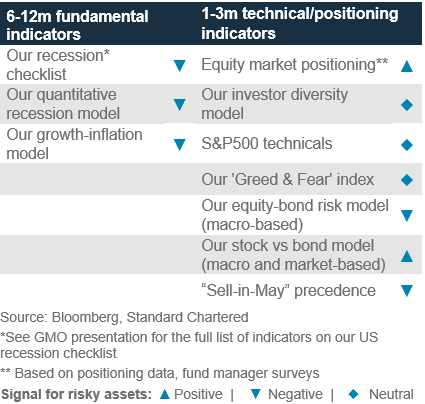
In our view, in the short term (1-3m), it is likely equities temporarily extend their recent outperformance vs bonds. A key driver of this view is the extremely bearish investor positioning. This ideally needs to normalise before equities can underperform bonds more convincingly.
Beyond this temporary move, though, we continue to favour bonds over equities as markets converge to fundamentals. While one can debate when precisely a US economic recession starts, we remain reluctant to position against fundamental indicators. We continue to be of the view that a US recession is likely over the next 6-12 months. This, in turn, is likely to result in bonds outperforming stocks as earnings expectations and bond yields move lower.
Fig.2 US 10y-3m yield curve continues to send a recession warning
Spread between US 10y and 3m bond yields
Asia ex-Japan equities likely offer a rotation opportunity. The region’s equity markets have underperformed global equities as markets assign a higher geopolitical risk premium for China, despite an improving economic outlook and stronger earnings growth. We expect this risk premium to decline, especially if the USD continues to weaken. Thus, Asia’s recent underperformance offers an opportunity for investors to rotate from Developed Market equities.
Positioning less of a challenge for income
Short-term positioning risks for high-quality bonds are more mixed. Fund manager surveys suggest the consensus is currently positioned to favour bonds over equities, and Investment Grade (IG) bonds over High Yield bonds. However, positioning data shows investors are very net-short US government bonds. This is usually a contrarian signal for higher bond prices (lower bond yields). The 10-year US government bond yield is also struggling to break above technical resistance.
We favour adding exposure to high-quality bonds on any rebound in yields. While positioning data argues short-lived rebounds in bond yields are possible, especially if equity markets rebound over a 1-3m horizon, earning the yield requires staying invested for 6-12 months. This means we favour using any yield rebounds to add exposure to high-quality bonds, and income strategies more broadly, rather than trying to trade any short-term yield rebound.
We continue to favour Developed Market Investment Grade bonds and Asia USD bonds and stay Underweight High Yield bonds. High Yield bonds’ correlation with equities means they may be well-supported in the short term should equities temporarily rise. However, we remain Underweight this asset class and would use any rebounds to reduce exposure.
USD weakness to extend
We expect the USD downtrend to extend as market conviction in an earlier pause in rate hikes by the Fed relative to other major central banks strengthens. This should not only lead to a rise in other G10 currencies, but also support Emerging Market assets, particularly in Asia ex-Japan.
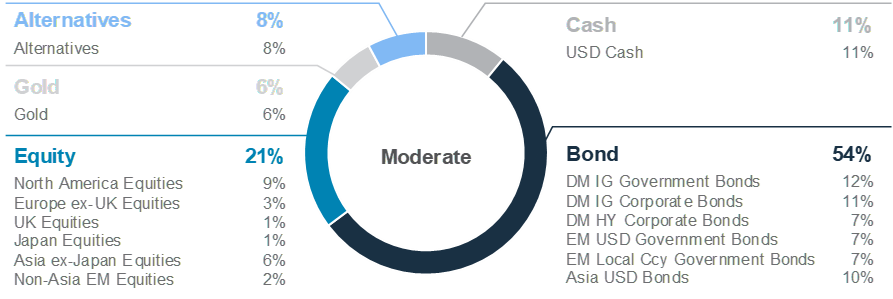
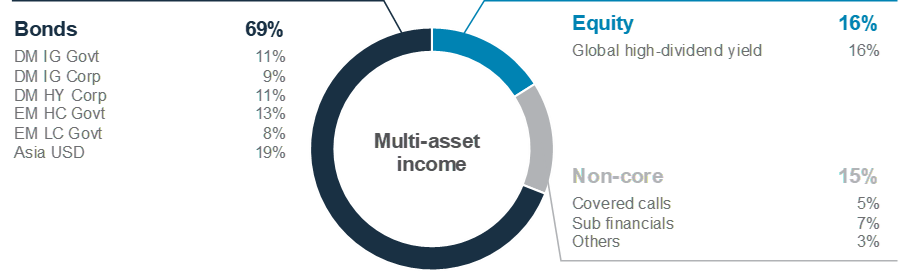
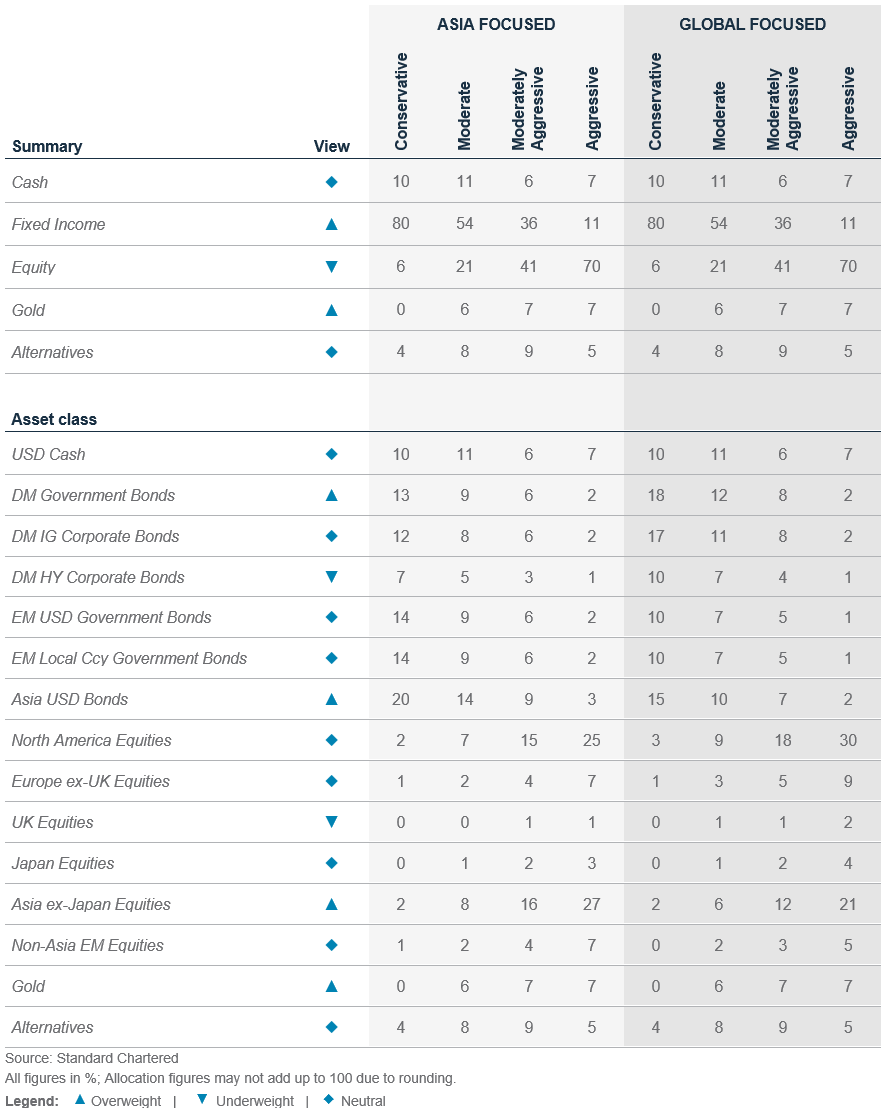
Foundation: Our tactical asset allocation
Global* allocation for a moderate risk profile
Multi-asset income allocation for a moderate risk profile
Perspectives on key client questions
|
|
||||
Is weak market sentiment/positioning a contrarian signal?
If the US economy falls into a recession, as we and the consensus expect, it would be one of the most well-forecast recessions in history. Despite gloomy expectations, risky assets have been relatively resilient, with every major asset class, besides commodities and the US dollar, advancing year-to-date and handily beating cash.
The bearish sentiment and positioning offer a possible explanation as to why risk assets have been resilient. In our Investment Strategy section, we highlighted the divergence in signals from long-term fundamental indicators and short-term technical indicators (see Figure 3). Excessively bearish investor positioning, likely due to the strong consensus of a US recession, stands out as a possibly bullish short-term signal. The bearish positioning has raised the room for disappointment, increasing the risk of a short-term re-pricing if things don’t play out as expected.
When short-term positioning collides with long-term fundamentals
As investors, it is important to keep in mind the potential discrepancies between short-term market indicators, such as sentiment and positioning, and longer-term fundamental factors, such as growth and earnings. Often, investor sentiment can overwhelm market fundamentals in the short run, leading famed investor Benjamin Graham to declare that “in the short run, the market is a voting machine, but in the long run, it is a weighing machine.”
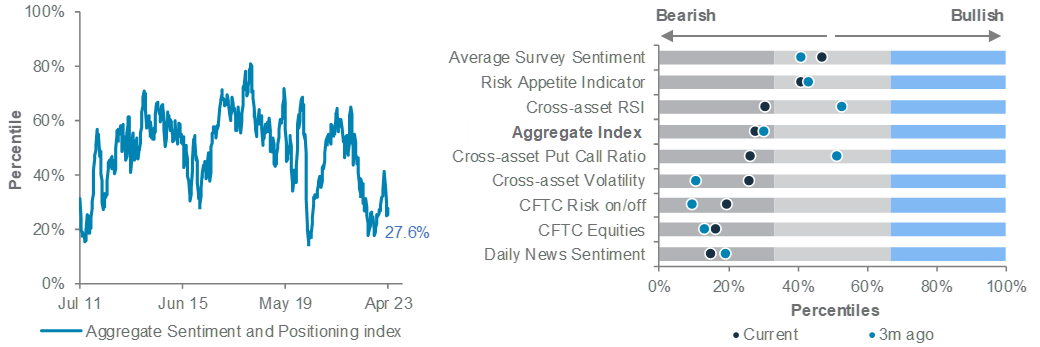
In this piece, we look at how various sentiment and positioning indicators stack up and what they might inform us about the short-term market outlook. We aggregated eight indicators into a single index (Aggregate Sentiment and Positioning index) and found the prevailing market sentiment to be near extreme levels of bearishness. Historically, extremes in sentiment and/or positioning have often resulted in a short-term reversal in risk assets. A possible explanation for this could be that at these levels, the number of prospective sellers or buyers respectively diminishes, leaving the market vulnerable to a counterintuitive move in the opposite direction.

Fig. 4 An aggregated index of eight positioning and sentiment indicators points towards pessimism in the markets
Aggregate Sentiment and Positioning index and the current and three-month prior readings of eight component indicators
Survey and news sentiment remains downbeat
Measuring market sentiment can be a challenging undertaking. Nevertheless, there are indicators that can provide insights into the prevailing mood of the market. These indicators can be broadly categorised into sentiment- and positioning-based indicators, as well as cross-asset hybrids that incorporate the elements of both.
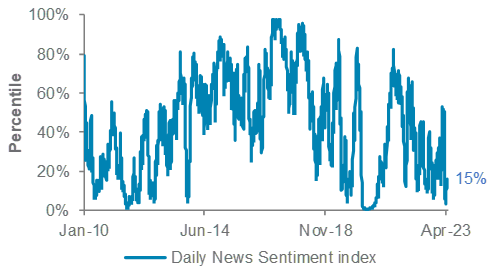
Our Average Survey Sentiment indicator aggregates the results of two closely watched surveys, the AAII Investor Sentiment Survey and NAAIM Exposure Index, to gauge the sentiment of both individual investors and active managers, respectively. The surveys are not meant to be predictive; but rather to help investors manage risk and stay informed. Separately, the Daily News Sentiment Index, developed by the Federal Reserve Bank of San Francisco, analyses economics-related news articles to capture the economic mood in the US.
Fig. 5 Economic sentiment in the media remains depressed near COVID-19 lows and has weighed on investor sentiment
Daily News Sentiment Index
Investors are positioned for a bearish outcome
Unlike sentiment surveys that describe the market’s view, positioning data reveals it through actual trading positions. Statistics provided by the Commodity Futures Trading Commission (CFTC) and various options exchanges offer
insights into how investors are currently positioned in various markets, with the number of opened longs or shorts in an asset indicating the bullish or bearish views of investors. Our Put-Call ratio (PCR) and CFTC risk on/off indicators leverage these data to provide insights into current market positioning.
Both indicators currently point towards investors’ bearishness in risk assets as scepticism has grown over the durability of 2023’s equity advance. Speculators have increased their net short positions in the S&P500 to multi-year highs. However, the prevailing caution may set the stage for a market bounce, as at extreme levels of positioning, the number of prospective sellers diminishes, making the market vulnerable to a rebound. This was the case in recent months when the CFTC risk on/off indicator reached extreme lows just as recession fears receded, sparking a rally in the S&P500 index.
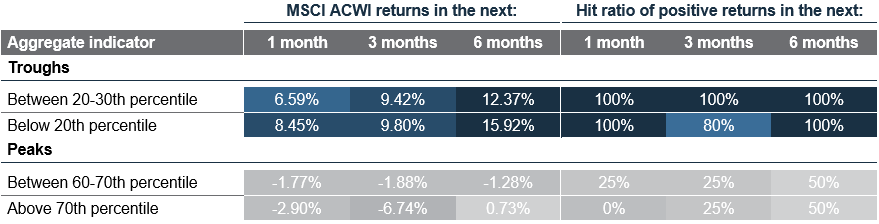
Extreme pessimism may signal upside risks short term
Our analysis shows that there is predictive power for subsequent returns when sentiment is at extreme levels. When the Aggregate Index (Fig 4) troughs below the 20th percentile, it usually indicates that markets have already experienced a large correction and that the asymmetry of returns is positive. On average, the MSCI ACWI gained 16% in the subsequent six months. The opposite also holds true, with MSCI ACWI retreating, on average 6.7%, three months after the Aggregate Index peaked above its 70th percentile.
Being contrarian is not a guaranteed success
Positioning and sentiment data can be used to identify potential areas of crowded trades or extreme sentiment. For example, if net-short position in the S&P500 index is near an extreme and sentiment bearish, but prices are advancing, this will increase the risk of investors liquidating their short positions, thus sustaining the rally in the near term.
However, being contrarian alone is not a fool proof recipe for success. At times, the hype or fear in the market can be well-justified. Hence, we favour placing the signal from positioning data within a more holistic approach (Figure 3).
Fig. 6 Extreme levels of the Aggregate Sentiment and Positioning index can provide contrarian signals
Subsequent month average returns of the MSCI ACWI at different peak and trough percentiles of the Aggregate Index
Macro overview – at a glance
Summary
|
Key themes
China to outperform as global growth slows: Global growth is set to slow this year as the initial spurt in consumption following the taming of the COVID-19 pandemic dissipates across Developed Markets (DM). The IMF cut global growth estimates for this year to 2.8%, from last year’s 3.4%. Developed economies are projected to grow 1.3% this year vs last year’s 2.7%. However, we expect China’s economy to outperform as activity normalises. In fact, China’s stronger-than-expected 4.5% y/y growth in Q1 adds upside risks to our full-year growth forecast of 5%. The US hitting its debt ceiling is a key near-term downside risk.
Inflation to trend lower but remain above target: Inflation continues to soften globally as supply bottlenecks for goods normalise. However, tight job markets in the US and Europe mean service sector-led inflation is likely to remain elevated and well above the central banks’ 2% target into 2024. Meanwhile, China continues to experience slowing inflation.
Policies to diverge: The divergent global backdrop points to an increasingly divergent monetary policy outlook. We expect the Fed to hike rates by 25bps on 3 May, then briefly pause, before cutting rates in the H2 as a recession likely sets in. Meanwhile, the ECB is likely to hike rates by 50bps in Q2 and hold it there for the rest of the year amid persistent inflation.
Key chart
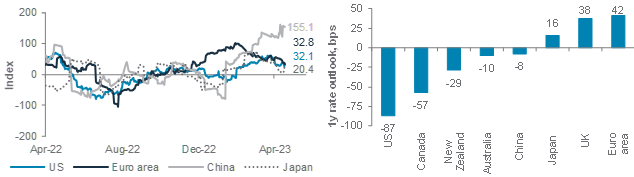
China’s economy continues to exceed expectations, while economic surprises in the US and Euro area lose momentum. Against this backdrop, the market is pricing further rate hikes by the ECB and rate cuts by the Fed
Fig. 7 China exceeding expectations; US and Euro area have divergent rates outlook
Citi economic surprise indices; market estimate of policy rate changes over next 12 months
Macro factors to watch
- US job market, service sector inflation. The robust job market is the main factor still supporting US consumption and growth. Almost all other indicators in our US recession checklist are signalling a downturn. We expect further deterioration in leading indicators of the job market in the coming months: continuing jobless claims have already risen to a 17-month high, while initial jobless claims are rising y/y; job openings have peaked but remain elevated in historical terms; temporary workers’ payroll has started to contract y/y. More weakness in these indicators is likely to cool service sector consumption and inflation and lift the unemployment rate. We expect the Fed to cut rates later this year once the jobless rate starts to rise.
- US debt ceiling risk: The next 1-3 months are likely to see a rerun of the 2011 battle between the Republicans and the Democrats to raise the US debt ceiling. Only this time, the Republicans (especially a hardliner segment) seem to be more adamant that the debt ceiling cannot be raised without substantial spending cuts. This raises the risk of a political accident and even a temporary default, given Democrats’ firm refusal to negotiate any spending cuts. Thus, we would categorise this as a “black swan” event risk: low probability, but high temporary impact. The US has never defaulted on its debt, and a last-minute deal, even if to raise the ceiling for a short period, is likely. However, that could entail large spending cuts. Also, as in 2011, any debt ceiling rise could lead to a brief liquidity shortage as the Treasury boosts borrowing to replenish its cash buffers. The Fed may end its ongoing quantitative tightening plan early to offset this drainage of liquidity.
- China’s imbalanced rebound means further stimulus: The economy’s stronger-than-expected 4.5% growth in Q1 was led by domestic consumers, while the manufacturing, private investment and property sectors continued to struggle. Manufacturing is likely to face headwinds as global demand for goods wane (especially with the US likely heading into a recession this year). However, we expect more measures to support the revival of property demand and private investment in the coming months.
Asset Classes
Bonds – at a glance
|
|
||||
Key themes
We are Overweight bonds given our expectation of sharply slower US growth. In our view, US government bond yields are likely to fall (ie, bond prices are likely to rise) as markets price in slower growth, and hence lower policy rates, in the future.
Our Overweight on DM IG government bonds remains in place. Slowing growth is likely to mean the Fed pauses after another 25bps hike and starts to cut rates before the end of 2023. This is consistent with our view of falling bond yields, which should help this bond asset class outperform in the next 12 months. Our expected range for the 10-year US government bond yield by end-2023 remains unchanged at 2.75-3.00%. Concern over (i) the US debt ceiling and (ii) the impact on liquidity following the US banking turmoil could keep bond market volatility elevated, but we would use any rebound in yield to add exposure.
We remain Overweight on Asia USD bonds, with a relative preference for Investment Grade bonds. Asia’s regional growth should remain supported by China’s post-COVID-19 recovery and pro-growth policy initiatives. Although a US recession would pose a risk to this regional economic rebound, we believe Asia USD bond’s relatively robust credit quality should act as a buffer.
We are Neutral on DM IG corporate bonds and Underweight DM HY bonds. We believe current yield premiums over Treasuries are still insufficient to compensate for a likely forthcoming recession, particularly in HY. We are Neutral EM local currency (LCY) and EM USD government bonds. A US recession is likely to be a drag on EM credit quality. However, EM central banks have room to ease policy in need. EM USD bonds should benefit from a high sensitivity to falling US bond yields.
Key chart
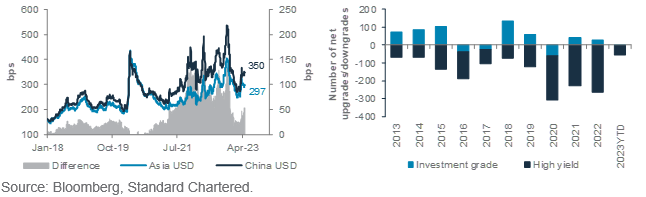
Widening yield premiums offer an opportunity to add to Asia USD bonds. The case is strongest for IG bonds where credit quality has held up better relative to HY in recent years.
Fig. 8 China USD bond yield premium widened relative to Asia USD bonds amid concerns over the longevity of China’s recovery; We see a buying opportunity
JACI Asia and China yield premiums; Net up/downgrades of Asia IG and HY issuers
Should we keep adding into bonds after the yield rally in the past six months?
The 10-year US government bond yield has fallen by c.80bps to 3.45% after peaking in October last year. Despite a decline since March, bond volatility remains high and well above its long-term average. Nevertheless, our expectation of a US recession means we continue to expect yields to move lower to 2.75-3.00% by the end of 2023 as growth slows and the Fed starts to cut before year-end.
Against this backdrop, we continue to see current bond yields as attractive and would use any yield rebounds to add to our preferred bond asset classes.
In addition to the attractive yield itself, we expect investors to benefit from modest capital gains given falling bond yields implies rising bond prices. DM IG government bonds should stand to benefit most from this move. We prefer longer maturity bonds given they are more sensitive to this price impact.
Asia USD bonds are unlikely to gain by the same extent from this sensitivity to US bond yields, given their shorter average maturity profile. However, their higher yield and room for narrowing yield premiums should compensate for this, in our view.
Equity – at a glance
|
|
||||
|
Key themes
We remain Underweight on global equities as we expect a recession in the US and Europe to weigh on corporate earnings and equity market returns. The pace of interest rate hikes in the US and Europe will likely tip their economies into recession as central bankers prioritise keeping inflation under control.
We are Overweight Asia ex-Japan. China’s earnings expectations have been upgraded as its growth outlook improves. In contrast, global equities’ earnings have been trimmed as growth slows due to increasingly restrictive monetary policies in the US and Europe. Within Asia ex-Japan, we are Overweight China equities due to the government’s pro-business stance and with negative sentiment largely priced in. We have an equal preference for onshore and offshore markets. We are Neutral India equities, where valuation relative to Asia ex-Japan continues to adjust lower a high, moving closer to the long-term average.
We are Neutral US equities where valuation remains elevated and earnings could see weakness if the economy enters a recession. We are Neutral Euro area equities where the significant valuation discount is rightly pricing in vulnerabilities to growth. We are Neutral Japan equities where benefits from a revival in China’s growth are offset by still uncertain monetary policy. We are Underweight UK equities where we see the weakest earnings growth this year offsetting its low valuation.
Key chart
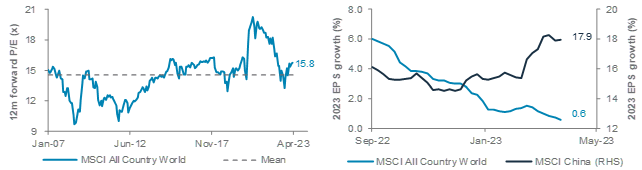
Valuation for global equities still looks too optimistic to us. Earnings for global equities are under pressure, in contrast to China which is seeing upgrades
Fig. 9 Valuation for global equities is above its long-term average and not pricing in risks to a growth slowdown, in our view. 2023 earnings growth for global equities has been revised down since the start of the year but upgraded for China equities
Consensus 12m forward P/E ratio for MSCI All Country World index. Evolution of consensus 2023 EPS growth for MSCI All Country World and MSCI China over time.
Opportunity in Asia ex-Japan and China
After outperforming strongly at the start of the year, Asia ex-Japan equities have given up the gains and are underperforming global equities YTD. We view this as an opportunity to rotate to Asia ex-Japan, which we continue to believe would outperform over the next 6-12 months.
The key driver for our Asia ex-Japan preference is China, which remains our preferred market within the region. Initial optimism about China’s easing of lockdown restrictions appears to have faded. As activity levels normalise in China, some investors question the durability of the growth recovery. On the other hand, some investors are concerned that the strong recovery could prompt the government to dial back on its pro-growth policies. Adding to the negative sentiment are geopolitical concerns as the US seeks to limit investments into high-tech industries in China.
However, we believe the growth outlook in China is improving and this is already supporting positive earnings revisions. Compared with tightening monetary policies in the US and Europe, policies in China remain more supportive of growth. Geopolitical tensions can be expected to continue creating short-term volatility, but we believe this is likely to be offset by business-friendly policies in China as the government seeks high-quality and sustainable growth. In addition, China’s valuation remains attractive. We also expect a weaker USD as a tailwind for equities in Asia ex-Japan and China to outperform global equities, as funds flow into the region. In India, earnings delivery continues to be strong. India’s 12m forward P/E multiple is off its high, but still a 50% premium to Asia ex-Japan, compared with a historical average premium of 38%.
FX – at a glance
|
Key themes
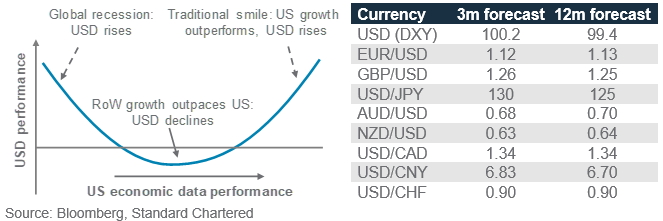
We remain bearish on the USD over the next 3-month and 12-month horizon. Weakness in US economic data, including some labour market data, and rising concerns around the US debt ceiling showdown have helped push the USD index (DXY) lower since the publication of our Q2 Outlook. We expect a pause in the Fed’s rate hiking cycle to lead to less favourable interest rate differentials for the US, pushing the USD lower. US economic slowdown relative to other major economies is likely to reinforce the USD ‘Smile’ (see the chart below), which should push the USD lower.
We expect EUR/USD to rise towards 1.12-1.15 over the next three months. Still elevated inflation, resilient business sentiment and reduced growth downside risks mean that the ECB is likely to maintain its tightening bias, hiking rates by 50bps, with risks skewed to the upside. This should lead to further declines in US vs. German bond yield differentials, pushing EUR/USD higher. However, skewed investor positioning and signs that the EUR could be overbought may lead to a near-term consolidation.
The UK’s strong jobs and wage growth and double-digit inflation raise the odds of more rate hikes from the BoE, leading us to revise our three-month GBP/USD forecast higher to 1.26. Elevated geopolitical risks and concerns around the US debt ceiling debate could lead to safe-haven demand for the CHF, similar to 2011. Hence, we revise our three-month USD/CHF forecast lower to 0.90, with the risk of the pair temporarily edging towards 0.85 should the US debt ceiling showdown turn ugly.
Commodity currencies (AUD, NZD and CAD) are likely to be supported by China’s reopening. However, the gains could be capped as the RBA and the RBNZ approach the end of their rate hiking cycles. Although the BoJ kept its stance unchanged at its policy meeting in April, we expect gradual progress towards a tightening monetary policy and potential safe-haven demand to push USD/JPY lower from the current level.
Key chart
Slower US growth relative to Europe and Asia and US debt ceiling concerns are likely to push the USD lower
Fig. 10 US growth and debt ceiling concerns should extend the USD decline
A stylised representation of USD ‘Smile’; Table of forecasts
How would USD perform given the looming Fed rate pause and US debt ceiling concerns?
A pause in the Fed’s rate hiking cycle is USD bearish in our opinion. While US government bond yields have risen over the past month, we expect the Fed to hike rates in its May FOMC meeting but indicate the likelihood of a pause thereafter. This should help cap 10-year US government bond yields below 3.6%. At the same time, we expect the ECB and BoE to maintain their tightening stance, which is likely to erode the USD’s real (net of inflation) yield advantage, pushing it lower. Additionally, an analysis of the past Fed rate hiking cycles suggests that the USD has a tendency to decline in the 3-4 months following the end of a rate hiking cycle, which supports our fundamental view.
Concerns about the US temporarily failing to raise its debt ceiling due to political differences could exert downward pressure on the USD. In the 2011 debt ceiling showdown, the USD fell modestly between May and July of 2011. However, if we take a closer look, the EUR (57% weight in DXY) was rangebound due to the European sovereign debt stress, but the CHF, JPY and gold appreciated vs the USD. Since the Euro area is on a much stronger footing today, we expect the EUR, CHF and JPY to potentially appreciate should US debt ceiling concerns intensify. In this case, the USD is likely to touch new 2023 lows over the next three months and could even dip below the psychologically important level of 100.
Gold, crude oil – at a glance
|
Key themes
We remain Overweight gold vs other major asset classes, viewing it as a hedge against tail risk scenarios, with a 12-month forecast of USD 2,100/oz.Gold has had a strong showing in April, breaking above USD 2,000/oz and staying above this level for most of the month before falling below that level in late April. A weaker USD, continued central bank demand and return of investor interest are key drivers behind its strength, which we expect to sustain. Furthermore, a likely end to the Fed rate-hiking cycle in H1, followed by rate cuts in H2, could propel gold prices to test 2020’s all-time high. The precious metal’s safe-haven properties also increase its appeal as a diversifier against the backdrop of elevated geopolitical uncertainty.
We turned more optimistic on oil in the near term, revising our 3-month WTI oil forecast to USD 75/bbl on the back of the surprise OPEC+ output cut. We expect OPEC+’s move to push the market into a deficit in Q2 vs earlier expectations of a surplus, especially given the strong compliance track record of the participating OPEC+ members in recent times. In the long run, however, we expect WTI oil to trend lower towards USD 65/bbl on (1) weaker oil demand from a slowing global economy, (2) resilience of Russia’s exports amid redirection of flows to Asia, and (3) the gradual build-up of inventories from warmer weather. Having said that, any further surprise OPEC+ output cuts are upside risks to our 12-month forecast.
Key chart
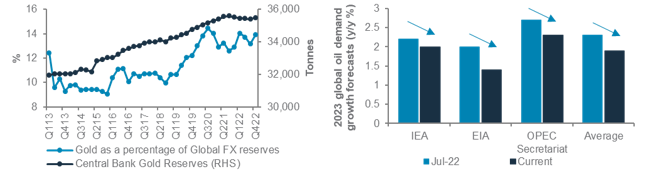
There is still scope for central banks to further diversify into gold given the still-high allocation to the USD
We expect the downward revision of oil demand forecasts to continue as more economic data weaknesses emerge
Fig. 11 Global allocation of FX reserves into gold has risen; 2023 oil demand forecasts have fallen over the past nine months
LHS chart: Central bank gold reserves (tonnes) and as a percentage of FX reserves (%)
RHS chart: 2023 global oil demand growth forecasts (y/y %)
De-dollarisation-led central bank demand
The topic of de-dollarisation is back in focus following the recent headlines around bilateral trades denominated in the CNH and talk of a potential BRICS currency. While we think that the risk of de-dollarisation is overblown, one potential outcome is greater central bank diversification to gold.
Central bank reserves in USD returned to the spotlight following the imposition of US and European sanctions on Russia. That coincided with the acceleration of central bank purchases in 2022. Diversification into gold continued in 2023, largely driven by Singapore, China and Turkey.
Global allocation of FX reserves into gold has risen from 9.4% in 2015 to 14% today. During the same period, gold rose more than 80%. Given that the USD still makes up c.60% of the global reserves, there is still scope for further diversification of the USD into gold.
OPEC+-led downgrades to demand forecasts
While the consensus is still expecting a y/y increase in oil consumption this year, the forecasts have been on a downtrend over the past year. Relative to mid-2022, 2023 global oil demand y/y growth forecasts have fallen 0.3ppt on average. The declines would have been larger were it not for gains from China’s reopening.
In April, the US Energy Information Administration cut its 2023 oil consumption forecast amid the recent banking crisis, while the International Energy Agency maintained its forecast. Although OPEC+ also maintained its forecast, it lowered its estimates for the last three quarters of 2023, while bumping up its Q1 estimate. The large downward revisions likely explain why OPEC+ announced an additional output cut of 1.65mb/d. We expect demand forecasts to continue falling as more economic data weaknesses emerge.
Quant perspective
US market risk model – remains bearish equities
|
Model prefers bonds over equities
Our US Equity-Bond Market Risk (EBMR) models the downside risks in US equities and the US 10-year government bonds. It uses 11 economic and market factors to create equity and bond risk barometers. If the value of a barometer falls below 50, it signals higher downside risks and vice versa.
The model continues to suggest we are in Stage 1. This means it expects US equity market risks to remain high, while US government bond market risks to be low. Since the model turned bearish on US equity risks in Jan-2022, VIX has averaged 25pts vs its long-term average of 18pts. The S&P500 index remains 9.0% below its Jan-22 level. The US government 10-year bond yield has increased by 27bp since the model turned bullish on bond market risk in Aug-22. It has previously captured 2.2% rise in US 10-year government bond yield when it was bearish on bond market risks.
Fig. 12 EBMR bearish on equity and bond market risks
US equity and bond market risk barometers
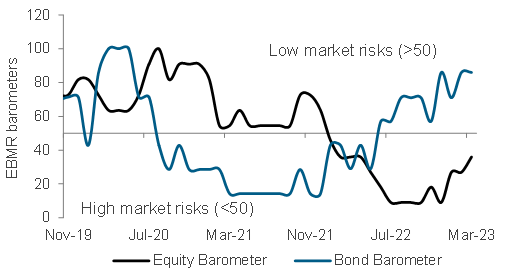
The equity barometer consists of 11 equity indicators. In April, the barometer has so far improved slightly to 36 from 27 and remains bearish (as it is below 50). The improvement is driven by easing inflation, as US CPI ex Food and Energy fell from 6.6% y/y in Sep-22 to 5.6% y/y in Mar-23. Other market factors such as equity and yield momentum have also seen minor improvements, but they remain bearish for risky assets. The theme that continues to underly the bearish equity barometer remains slowing growth, as signalled by falling US housing starts, high interest rates and contracting monetary base.
Our bond barometer remains at a strong 86. Slowing growth remains the supportive factor. This includes ISM manufacturing PMI dropping to 46.3 (a contraction in industrial activity), falling US housing starts and slowing US capacity utilisation. US jobless claims, which was previously a negative factor for the bond barometer, has turned neutral after their recent rise. However, this factor has a bearish bias for our bond barometer as it is still low from a historical perspective. A tight labour market provides more ammunition for rate hike decisions, which are usually bearish for bonds.
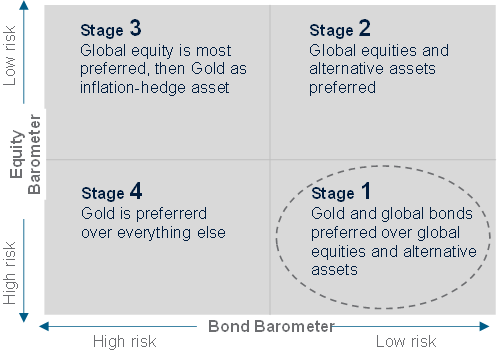
Our model projects that the US will remain in Stage 1 until end of June. The model is currently consistent with our GIC views where it sees less downside risks in bonds than equities.
Implications on global assets
Data since 1999 suggest gold and bonds are the most preferred in Stage 1. The model’s preference for an asset is based on its long-term relationship with the market cycle, which favours gold and bonds as defensive assets in Stage 1.
Fig. 13 Scenarios over the coming months till July 2023 vs December 2022 projections
Probability of the evolution of financial market risk cycle from the current Stage 1 and preferred assets
Model’s estimated probabilities in December 2022
| Stage | Jan-23 | Feb-23 | Mar-23 | Apr-23 |
|---|---|---|---|---|
| 1 | 100% | 99% | 90% | 41% |
| 2 | 0% | 1% | 10% | 58% |
| 3 | 0% | 0% | 0% | 1% |
| 4 | 0% | 0% | 0% | 1% |
Model’s estimated probabilities in March 2023
| Stage | Apr-23 | May-23 | Jun-23 | Jul-23 |
|---|---|---|---|---|
| 1 | 100% | 94% | 70% | 37% |
| 2 | 0% | 5% | 28% | 59% |
| 3 | 0% | 0% | 1% | 2% |
| 4 | 0% | 0% | 1% | 1% |
Tracking market diversity
|
About our market diversity indicators
Our market diversity indicators help to identify a potential change in short-term trends due to a fall in market breadth across equities, credit, FX and commodities. When market diversity falls, it implies either buyers or sellers are dominating, leading to a rapid rise or fall in asset prices. This is usually unsustainable and is likely to be followed by a consolidation or a reversal. Our diversity indicator is based on a statistical index called fractal dimension; a value below 1.25 serves as a guideline that prices are rising or falling too fast.
Where is diversity falling or rising this month?
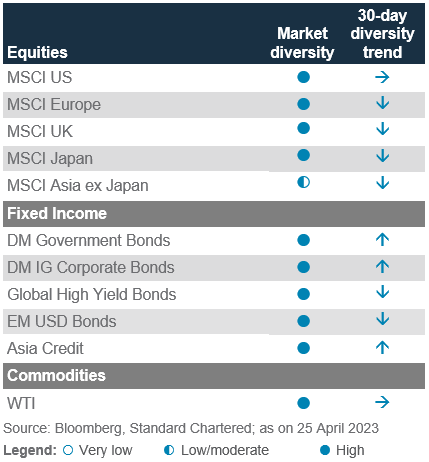
Market diversity across asset classes we track remain high and none stood out for a reversal trade. This can be seen from Fig. 14, where no assets have a diversity score below 1.25. The diversity of bond markets can be seen to have sharply increased in April.
For bonds, we are seeing a steep rise in diversity, but this is mostly underpinned by stronger price action as investors price in lower probability of rate hikes after the banking crisis. Safer and high-duration bond markets have performed more strongly. For instance, since February, DM government bonds and DM IG corporate bonds have both risen more than 4.0%. The high diversity in these bond markets is positive, as it indicates market positioning is unlikely to cause a reversal.
Fig. 14 Average market diversity score by asset class
Diversity of bonds has risen steeply
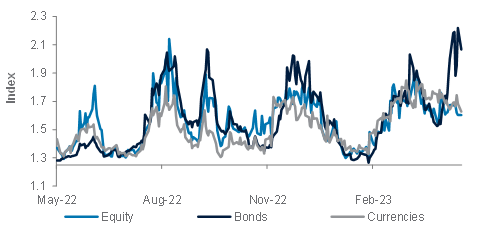
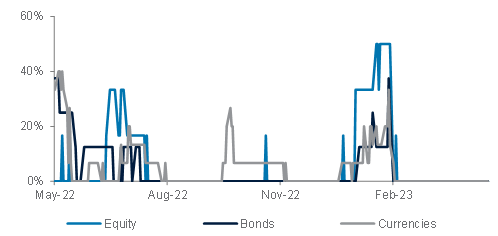
Fig. 15 Percentage of assets with diversity score <1.25
No assets showing reversal risks
For equities, market diversity of individual markets has declined but only slightly. The high levels of diversity are driven by market fluctuations where equities had a short-term recovery after the sell-off caused by the banking crisis in March. Overall, a lack of clear market direction will likely keep market diversity of equity markets high. Japan equities currently have the highest level of market diversity, followed by US, UK and Europe ex-UK equities.
Meanwhile, the diversity of currencies has only declined slightly but remains well above our diversity score’s threshold of 1.25. This is despite the significant weakness in the USD (DXY down 11% since Sep-22). Any reversal to the current USD weakness is more likely to come from a change in expectations of interest rate differentials. As our diversity score indicates, market positioning does not pose a risk of a reversal in the USD weakness. GBP/USD and EUR/USD currently have the highest market diversity.
Fig. 16 Diversity across key assets
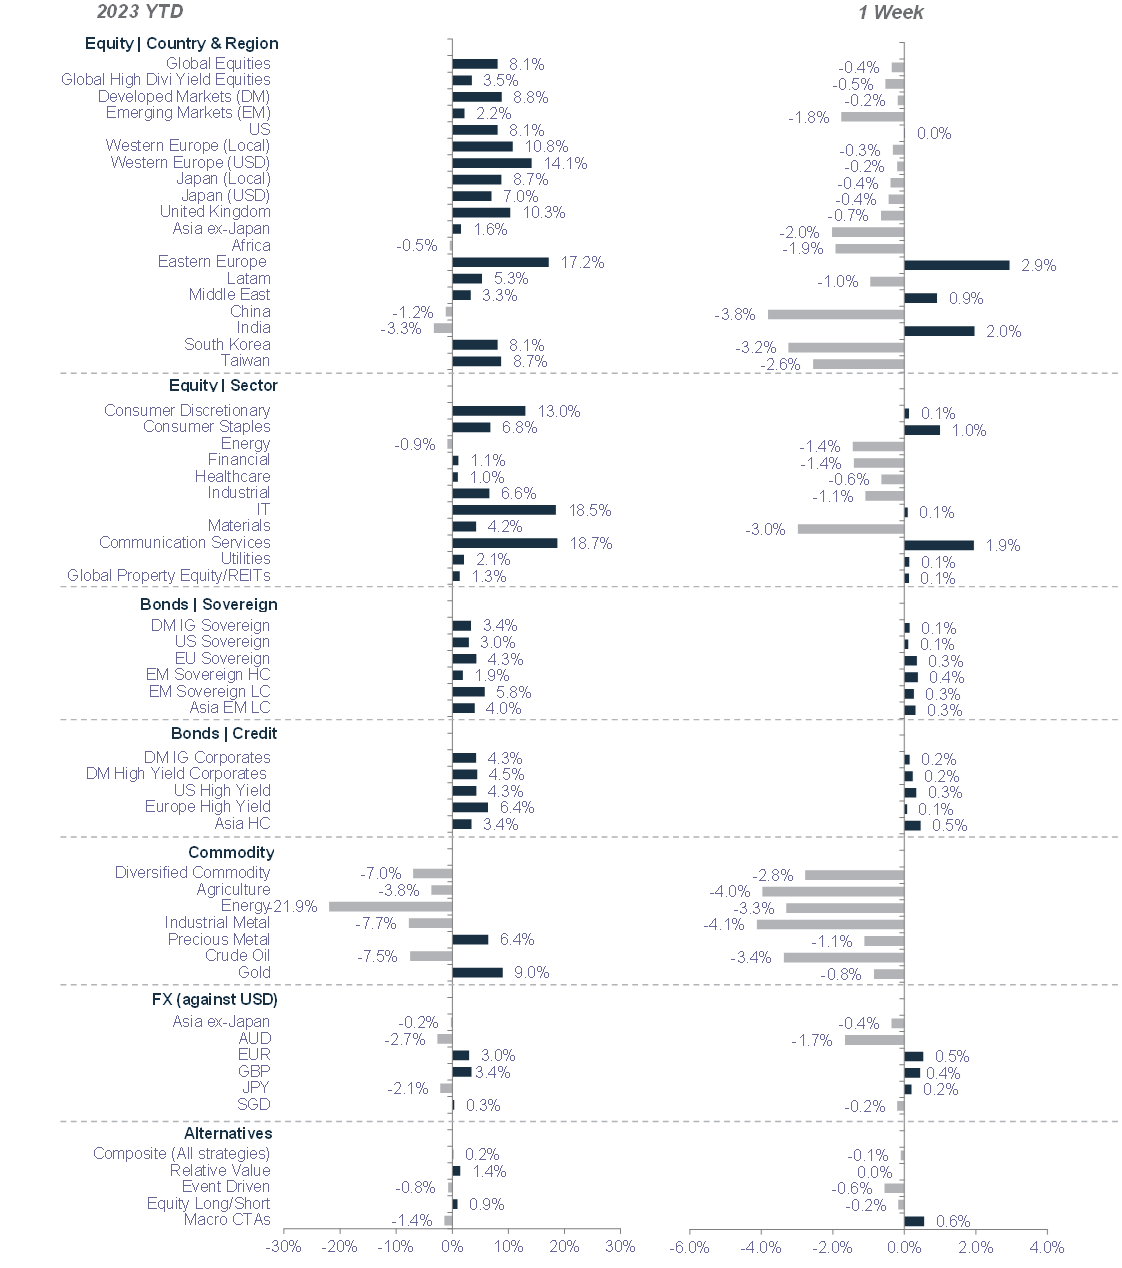
Performance Review
Foundation: Asset allocation summary
Market performance summary
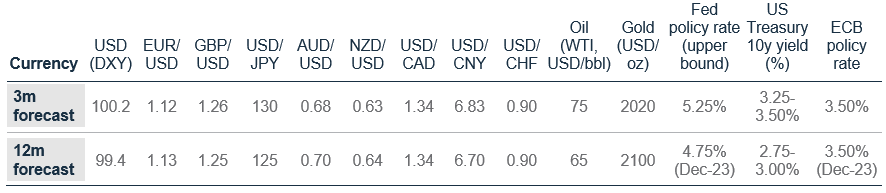
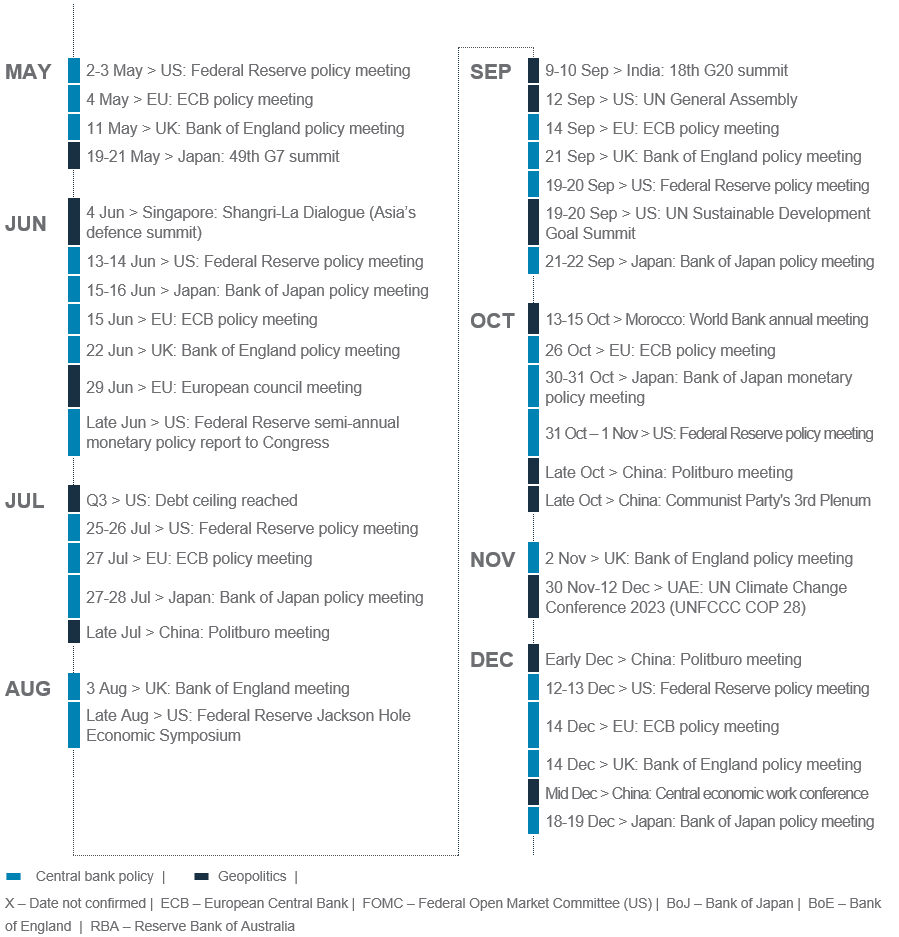
Our key forecasts and calendar events
Explanatory notes
1. The figures on page 5 show allocations for a moderate risk profile only – different risk profiles may produce significantly different asset allocation results. Page 5 is only an example, provided for general information only and they do not constitute investment advice, an offer, recommendation or solicitation. They do not take into account the specific investment objectives, needs or risk tolerances of a particular person or class of persons and they have not been prepared for any particular person or class of persons.
2. Contingent Convertibles are complex financial instruments and are not a suitable or appropriate investment for all investors. This document is not an offer to sell or an invitation to buy any securities or any beneficial interests therein. Contingent convertible securities are not intended to be sold and should not be sold to retail clients in the European Economic Area (EEA) (each as defined in the Policy Statement on the Restrictions on the Retail Distribution of Regulatory Capital Instruments (Feedback to CP14/23 and Final Rules) (“Policy Statement”), read together with the Product Intervention (Contingent Convertible Instruments and Mutual Society Shares) Instrument 2015 (“Instrument”, and together with the Policy Statement, the “Permanent Marketing Restrictions”), which were published by the United Kingdom’s Financial Conduct Authority in June 2015), other than in circumstances that do not give rise to a contravention of the Permanent Marketing Restrictions.
Disclosure
This document is confidential and may also be privileged. If you are not the intended recipient, please destroy all copies and notify the sender immediately. This document is being distributed for general information only and is subject to the relevant disclaimers available at our Standard Chartered website under Regulatory disclosures. It is not and does not constitute research material, independent research, an offer, recommendation or solicitation to enter into any transaction or adopt any hedging, trading or investment strategy, in relation to any securities or other financial instruments. This document is for general evaluation only. It does not take into account the specific investment objectives, financial situation or particular needs of any particular person or class of persons and it has not been prepared for any particular person or class of persons. You should not rely on any contents of this document in making any investment decisions. Before making any investment, you should carefully read the relevant offering documents and seek independent legal, tax and regulatory advice. In particular, we recommend you to seek advice regarding the suitability of the investment product, taking into account your specific investment objectives, financial situation or particular needs, before you make a commitment to purchase the investment product. Opinions, projections and estimates are solely those of SC at the date of this document and subject to change without notice. Past performance is not indicative of future results and no representation or warranty is made regarding future performance. The value of investments, and the income from them, can go down as well as up, and you may not recover the amount of your original investment. You are not certain to make a profit and may lose money. Any forecast contained herein as to likely future movements in rates or prices or likely future events or occurrences constitutes an opinion only and is not indicative of actual future movements in rates or prices or actual future events or occurrences (as the case may be). This document must not be forwarded or otherwise made available to any other person without the express written consent of the Standard Chartered Group (as defined below). Standard Chartered Bank is incorporated in England with limited liability by Royal Charter 1853 Reference Number ZC18. The Principal Office of the Company is situated in England at 1 Basinghall Avenue, London, EC2V 5DD. Standard Chartered Bank is authorised by the Prudential Regulation Authority and regulated by the Financial Conduct Authority and Prudential Regulation Authority. Standard Chartered PLC, the ultimate parent company of Standard Chartered Bank, together with its subsidiaries and affiliates (including each branch or representative office), form the Standard Chartered Group. Standard Chartered Private Bank is the private banking division of Standard Chartered. Private banking activities may be carried out internationally by different legal entities and affiliates within the Standard Chartered Group (each an “SC Group Entity”) according to local regulatory requirements. Not all products and services are provided by all branches, subsidiaries and affiliates within the Standard Chartered Group. Some of the SC Group Entities only act as representatives of Standard Chartered Private Bank and may not be able to offer products and services or offer advice to clients.
Copyright © 2024, Accounting Research & Analytics, LLC d/b/a CFRA (and its affiliates, as applicable). Reproduction of content provided by CFRA in any form is prohibited except with the prior written permission of CFRA. CFRA content is not investment advice and a reference to or observation concerning a security or investment provided in the CFRA SERVICES is not a recommendation to buy, sell or hold such investment or security or make any other investment decisions. The CFRA content contains opinions of CFRA based upon publicly-available information that CFRA believes to be reliable and the opinions are subject to change without notice. This analysis has not been submitted to, nor received approval from, the United States Securities and Exchange Commission or any other regulatory body. While CFRA exercised due care in compiling this analysis, CFRA, ITS THIRD-PARTY SUPPLIERS, AND ALL RELATED ENTITIES SPECIFICALLY DISCLAIM ALL WARRANTIES, EXPRESS OR IMPLIED, INCLUDING, BUT NOT LIMITED TO, ANY WARRANTIES OF MERCHANTABILITY OR FITNESS FOR A PARTICULAR PURPOSE OR USE, to the full extent permitted by law, regarding the accuracy, completeness, or usefulness of this information and assumes no liability with respect to the consequences of relying on this information for investment or other purposes. No content provided by CFRA (including ratings, credit-related analyses and data, valuations, model, software or other application or output therefrom) or any part thereof may be modified, reverse engineered, reproduced or distributed in any form by any means, or stored in a database or retrieval system, without the prior written permission of CFRA, and such content shall not be used for any unlawful or unauthorized purposes. CFRA and any third-party providers, as well as their directors, officers, shareholders, employees or agents do not guarantee the accuracy, completeness, timeliness or availability of such content. In no event shall CFRA, its affiliates, or their third-party suppliers be liable for any direct, indirect, special, or consequential damages, costs, expenses, legal fees, or losses (including lost income or lost profit and opportunity costs) in connection with a subscriber’s, subscriber’s customer’s, or other’s use of CFRA’s content.
Market Abuse Regulation (MAR) Disclaimer
Banking activities may be carried out internationally by different branches, subsidiaries and affiliates within the Standard Chartered Group according to local regulatory requirements. Opinions may contain outright “buy”, “sell”, “hold” or other opinions. The time horizon of this opinion is dependent on prevailing market conditions and there is no planned frequency for updates to the opinion. This opinion is not independent of Standard Chartered Group’s trading strategies or positions. Standard Chartered Group and/or its affiliates or its respective officers, directors, employee benefit programmes or employees, including persons involved in the preparation or issuance of this document may at any time, to the extent permitted by applicable law and/or regulation, be long or short any securities or financial instruments referred to in this document or have material interest in any such securities or related investments. Therefore, it is possible, and you should assume, that Standard Chartered Group has a material interest in one or more of the financial instruments mentioned herein. Please refer to our Standard Chartered website under Regulatory disclosures for more detailed disclosures, including past opinions/ recommendations in the last 12 months and conflict of interests, as well as disclaimers. A covering strategist may have a financial interest in the debt or equity securities of this company/issuer. This document must not be forwarded or otherwise made available to any other person without the express written consent of Standard Chartered Group.
Sustainable Investments
Any ESG data used or referred to has been provided by Morningstar, Sustainalytics, MSCI or Bloomberg. Refer to 1) Morningstar website under Sustainable Investing, 2) Sustainalytics website under ESG Risk Ratings, 3) MCSI website under ESG Business Involvement Screening Research for more information. The ESG data is as at the date of publication based on data provided, is for informational purpose only and is not warranted to be complete, timely, accurate or suitable for a particular purpose, and it may be subject to change. Sustainable Investments (SI): This refers to funds that have been classified as ‘Sustainable Investments’ by Morningstar. SI funds have explicitly stated in their prospectus and regulatory filings that they either incorporate ESG factors into the investment process or have a thematic focus on the environment, gender diversity, low carbon, renewable energy, water or community development. For equity, it refers to shares/stocks issued by companies with Sustainalytics ESG Risk Rating of Low/Negligible. For bonds, it refers to debt instruments issued by issuers with Sustainalytics ESG Risk Rating of Low/Negligible, and/or those being certified green, social, sustainable bonds. For structured products, it refers to products that are issued by any issuer who has a Sustainable Finance framework that aligns with Standard Chartered’s Green and Sustainable Product Framework, with underlying assets that are part of the Sustainable Investment universe or separately approved by Standard Chartered’s Sustainable Finance Governance Committee.
Country/Market Specific Disclosures
Botswana: This document is being distributed in Botswana by, and is attributable to, Standard Chartered Bank Botswana Limited which is a financial institution licensed under the Section 6 of the Banking Act CAP 46.04 and is listed in the Botswana Stock Exchange. Brunei Darussalam: This document is being distributed in Brunei Darussalam by, and is attributable to, Standard Chartered Bank (Brunei Branch) | Registration Number RFC/61 and Standard Chartered Securities (B) Sdn Bhd | Registration Number RC20001003. Standard Chartered Bank is incorporated in England with limited liability by Royal Charter 1853 Reference Number ZC18. Standard Chartered Securities (B) Sdn Bhd is a limited liability company registered with the Registry of Companies with Registration Number RC20001003 and licensed by Brunei Darussalam Central Bank as a Capital Markets Service License Holder with License Number BDCB/R/CMU/S3-CL and it is authorised to conduct Islamic investment business through an Islamic window. China Mainland: This document is being distributed in China by, and is attributable to, Standard Chartered Bank (China) Limited which is mainly regulated by National Financial Regulatory Administration (NFRA), State Administration of Foreign Exchange (SAFE), and People’s Bank of China (PBOC). Hong Kong: In Hong Kong, this document, except for any portion advising on or facilitating any decision on futures contracts trading, is distributed by Standard Chartered Bank (Hong Kong) Limited (“SCBHK”), a subsidiary of Standard Chartered PLC. SCBHK has its registered address at 32/F, Standard Chartered Bank Building, 4-4A Des Voeux Road Central, Hong Kong and is regulated by the Hong Kong Monetary Authority and registered with the Securities and Futures Commission (“SFC”) to carry on Type 1 (dealing in securities), Type 4 (advising on securities), Type 6 (advising on corporate finance) and Type 9 (asset management) regulated activity under the Securities and Futures Ordinance (Cap. 571) (“SFO”) (CE No. AJI614). The contents of this document have not been reviewed by any regulatory authority in Hong Kong and you are advised to exercise caution in relation to any offer set out herein. If you are in doubt about any of the contents of this document, you should obtain independent professional advice. Any product named herein may not be offered or sold in Hong Kong by means of any document at any time other than to “professional investors” as defined in the SFO and any rules made under that ordinance. In addition, this document may not be issued or possessed for the purposes of issue, whether in Hong Kong or elsewhere, and any interests may not be disposed of, to any person unless such person is outside Hong Kong or is a “professional investor” as defined in the SFO and any rules made under that ordinance, or as otherwise may be permitted by that ordinance. In Hong Kong, Standard Chartered Private Bank is the private banking division of SCBHK, a subsidiary of Standard Chartered PLC. Ghana: Standard Chartered Bank Ghana Limited accepts no liability and will not be liable for any loss or damage arising directly or indirectly (including special, incidental or consequential loss or damage) from your use of these documents. Past performance is not indicative of future results and no representation or warranty is made regarding future performance. You should seek advice from a financial adviser on the suitability of an investment for you, taking into account these factors before making a commitment to invest in an investment. To unsubscribe from receiving further updates, please send an email to feedback.ghana@sc.com. Please do not reply to this email. Call our Priority Banking on 0302610750 for any questions or service queries. You are advised not to send any confidential and/or important information to Standard Chartered via e-mail, as Standard Chartered makes no representations or warranties as to the security or accuracy of any information transmitted via e-mail. Standard Chartered shall not be responsible for any loss or damage suffered by you arising from your decision to use e-mail to communicate with the Bank. India: This document is being distributed in India by Standard Chartered in its capacity as a distributor of mutual funds and referrer of any other third party financial products. Standard Chartered does not offer any ‘Investment Advice’ as defined in the Securities and Exchange Board of India (Investment Advisers) Regulations, 2013 or otherwise. Services/products related securities business offered by Standard Charted are not intended for any person, who is a resident of any jurisdiction, the laws of which imposes prohibition on soliciting the securities business in that jurisdiction without going through the registration requirements and/or prohibit the use of any information contained in this document. Indonesia: This document is being distributed in Indonesia by Standard Chartered Bank, Indonesia branch, which is a financial institution licensed, registered and supervised by Otoritas Jasa Keuangan (Financial Service Authority). Jersey: In Jersey, Standard Chartered Private Bank is the Registered Business Name of the Jersey Branch of Standard Chartered Bank. The Jersey Branch of Standard Chartered Bank is regulated by the Jersey Financial Services Commission. Copies of the latest audited accounts of Standard Chartered Bank are available from its principal place of business in Jersey: PO Box 80, 15 Castle Street, St Helier, Jersey JE4 8PT. Standard Chartered Bank is incorporated in England with limited liability by Royal Charter in 1853 Reference Number ZC 18. The Principal Office of the Company is situated in England at 1 Basinghall Avenue, London, EC2V 5DD. Standard Chartered Bank is authorised by the Prudential Regulation Authority and regulated by the Financial Conduct Authority and Prudential Regulation Authority. The Jersey Branch of Standard Chartered Bank is also an authorised financial services provider under license number 44946 issued by the Financial Sector Conduct Authority of the Republic of South Africa. Jersey is not part of the United Kingdom and all business transacted with Standard Chartered Bank, Jersey Branch and other SC Group Entity outside of the United Kingdom, are not subject to some or any of the investor protection and compensation schemes available under United Kingdom law. Kenya: This document is being distributed in Kenya by, and is attributable to Standard Chartered Bank Kenya Limited. Investment Products and Services are distributed by Standard Chartered Investment Services Limited, a wholly owned subsidiary of Standard Chartered Bank Kenya Limited that is licensed by the Capital Markets Authority as a Fund Manager. Standard Chartered Bank Kenya Limited is regulated by the Central Bank of Kenya. Malaysia: This document is being distributed in Malaysia by Standard Chartered Bank Malaysia Berhad. Recipients in Malaysia should contact Standard Chartered Bank Malaysia Berhad in relation to any matters arising from, or in connection with, this document. Nigeria: This document is being distributed in Nigeria by Standard Chartered Bank Nigeria Limited, a bank duly licensed and regulated by the Central Bank of Nigeria. Standard Chartered accepts no liability for any loss or damage arising directly or indirectly (including special, incidental or consequential loss or damage) from your use of these documents. You should seek advice from a financial adviser on the suitability of an investment for you, taking into account these factors before making a commitment to invest in an investment. To unsubscribe from receiving further updates, please send an email to clientcare.ng@sc.com requesting to be removed from our mailing list. Please do not reply to this email. Call our Priority Banking on 01-2772514 for any questions or service queries. Standard Chartered shall not be responsible for any loss or damage arising from your decision to send confidential and/or important information to Standard Chartered via e-mail, as Standard Chartered makes no representations or warranties as to the security or accuracy of any information transmitted via e-mail. Pakistan: This document is being distributed in Pakistan by, and attributable to Standard Chartered Bank (Pakistan) Limited having its registered office at PO Box 5556, I.I Chundrigar Road Karachi, which is a banking company registered with State Bank of Pakistan under Banking Companies Ordinance 1962 and is also having licensed issued by Securities & Exchange Commission of Pakistan for Security Advisors. Standard Chartered Bank (Pakistan) Limited acts as a distributor of mutual funds and referrer of other third-party financial products. Singapore: This document is being distributed in Singapore by, and is attributable to, Standard Chartered Bank (Singapore) Limited (Registration No. 201224747C/ GST Group Registration No. MR-8500053-0, “SCBSL”). Recipients in Singapore should contact SCBSL in relation to any matters arising from, or in connection with, this document. SCBSL is an indirect wholly owned subsidiary of Standard Chartered Bank and is licensed to conduct banking business in Singapore under the Singapore Banking Act, 1970. Standard Chartered Private Bank is the private banking division of SCBSL. IN RELATION TO ANY SECURITY OR SECURITIES-BASED DERIVATIVES CONTRACT REFERRED TO IN THIS DOCUMENT, THIS DOCUMENT, TOGETHER WITH THE ISSUER DOCUMENTATION, SHALL BE DEEMED AN INFORMATION MEMORANDUM (AS DEFINED IN SECTION 275 OF THE SECURITIES AND FUTURES ACT, 2001 (“SFA”)). THIS DOCUMENT IS INTENDED FOR DISTRIBUTION TO ACCREDITED INVESTORS, AS DEFINED IN SECTION 4A(1)(a) OF THE SFA, OR ON THE BASIS THAT THE SECURITY OR SECURITIES-BASED DERIVATIVES CONTRACT MAY ONLY BE ACQUIRED AT A CONSIDERATION OF NOT LESS THAN S$200,000 (OR ITS EQUIVALENT IN A FOREIGN CURRENCY) FOR EACH TRANSACTION. Further, in relation to any security or securities-based derivatives contract, neither this document nor the Issuer Documentation has been registered as a prospectus with the Monetary Authority of Singapore under the SFA. Accordingly, this document and any other document or material in connection with the offer or sale, or invitation for subscription or purchase, of the product may not be circulated or distributed, nor may the product be offered or sold, or be made the subject of an invitation for subscription or purchase, whether directly or indirectly, to persons other than a relevant person pursuant to section 275(1) of the SFA, or any person pursuant to section 275(1A) of the SFA, and in accordance with the conditions specified in section 275 of the SFA, or pursuant to, and in accordance with the conditions of, any other applicable provision of the SFA. In relation to any collective investment schemes referred to in this document, this document is for general information purposes only and is not an offering document or prospectus (as defined in the SFA). This document is not, nor is it intended to be (i) an offer or solicitation of an offer to buy or sell any capital markets product; or (ii) an advertisement of an offer or intended offer of any capital markets product. Deposit Insurance Scheme: Singapore dollar deposits of non-bank depositors are insured by the Singapore Deposit Insurance Corporation, for up to S$100,000 in aggregate per depositor per Scheme member by law. Foreign currency deposits, dual currency investments, structured deposits and other investment products are not insured. This advertisement has not been reviewed by the Monetary Authority of Singapore. Taiwan: SC Group Entity or Standard Chartered Bank (Taiwan) Limited (“SCB (Taiwan)”) may be involved in the financial instruments contained herein or other related financial instruments. The author of this document may have discussed the information contained herein with other employees or agents of SC or SCB (Taiwan). The author and the above-mentioned employees of SC or SCB (Taiwan) may have taken related actions in respect of the information involved (including communication with customers of SC or SCB (Taiwan) as to the information contained herein). The opinions contained in this document may change, or differ from the opinions of employees of SC or SCB (Taiwan). SC and SCB (Taiwan) will not provide any notice of any changes to or differences between the above-mentioned opinions. This document may cover companies with which SC or SCB (Taiwan) seeks to do business at times and issuers of financial instruments. Therefore, investors should understand that the information contained herein may serve as specific purposes as a result of conflict of interests of SC or SCB (Taiwan). SC, SCB (Taiwan), the employees (including those who have discussions with the author) or customers of SC or SCB (Taiwan) may have an interest in the products, related financial instruments or related derivative financial products contained herein; invest in those products at various prices and on different market conditions; have different or conflicting interests in those products. The potential impacts include market makers’ related activities, such as dealing, investment, acting as agents, or performing financial or consulting services in relation to any of the products referred to in this document. UAE: DIFC – Standard Chartered Bank is incorporated in England with limited liability by Royal Charter 1853 Reference Number ZC18.The Principal Office of the Company is situated in England at 1 Basinghall Avenue, London, EC2V 5DD. Standard Chartered Bank is authorised by the Prudential Regulation Authority and regulated by the Financial Conduct Authority and Prudential Regulation Authority. Standard Chartered Bank, Dubai International Financial Centre having its offices at Dubai International Financial Centre, Building 1, Gate Precinct, P.O. Box 999, Dubai, UAE is a branch of Standard Chartered Bank and is regulated by the Dubai Financial Services Authority (“DFSA”). This document is intended for use only by Professional Clients and is not directed at Retail Clients as defined by the DFSA Rulebook. In the DIFC we are authorised to provide financial services only to clients who qualify as Professional Clients and Market Counterparties and not to Retail Clients. As a Professional Client you will not be given the higher retail client protection and compensation rights and if you use your right to be classified as a Retail Client we will be unable to provide financial services and products to you as we do not hold the required license to undertake such activities. For Islamic transactions, we are acting under the supervision of our Shariah Supervisory Committee. Relevant information on our Shariah Supervisory Committee is currently available on the Standard Chartered Bank website in the Islamic banking section For residents of the UAE – Standard Chartered Bank UAE does not provide financial analysis or consultation services in or into the UAE within the meaning of UAE Securities and Commodities Authority Decision No. 48/r of 2008 concerning financial consultation and financial analysis. Uganda: Our Investment products and services are distributed by Standard Chartered Bank Uganda Limited, which is licensed by the Capital Markets Authority as an investment adviser. United Kingdom: In the UK, Standard Chartered Bank is authorised by the Prudential Regulation Authority and regulated by the Financial Conduct Authority and Prudential Regulation Authority. This communication has been approved by Standard Chartered Bank for the purposes of Section 21 (2) (b) of the United Kingdom’s Financial Services and Markets Act 2000 (“FSMA”) as amended in 2010 and 2012 only. Standard Chartered Bank (trading as Standard Chartered Private Bank) is an authorised financial services provider (license number 45747) in terms of the South African Financial Advisory and Intermediary Services Act, 2002. The Materials have not been prepared in accordance with UK legal requirements designed to promote the independence of investment research, and that it is not subject to any prohibition on dealing ahead of the dissemination of investment research. Vietnam: This document is being distributed in Vietnam by, and is attributable to, Standard Chartered Bank (Vietnam) Limited which is mainly regulated by State Bank of Vietnam (SBV). Recipients in Vietnam should contact Standard Chartered Bank (Vietnam) Limited for any queries regarding any content of this document. Zambia: This document is distributed by Standard Chartered Bank Zambia Plc, a company incorporated in Zambia and registered as a commercial bank and licensed by the Bank of Zambia under the Banking and Financial Services Act Chapter 387 of the Laws of Zambia.