22 September 2023
Global Market Outlook
Global Market Outlook
Reshuffling after the pause
Major central banks are now likely on pause as they judge the impact of their extraordinarily rapid series of rate hikes amid a mixed bag of economic data. We believe this favours taking selective region, sector and credit quality risks.
We upgrade US equities at the expense of European equities on the back of relative growth resilience. Developed Market bonds continue to offer an attractive risk/reward, with current yields creating a sizeable return buffer.
We trim Asia ex-Japan equities and Asia USD bonds to core holdings, as a catalyst for more significant Chinese policy stimulus remains absent. In Asia, we retain our Japan equities Overweight and prefer diversified exposure across markets within Asia ex-Japan. We upgrade EM local currency bonds to Overweight.
How should investors address China market exposure?
Can a US recession be avoided?
How do investors take advantage of high yields?
Strategy
Investment strategy and key themes
|
|
||||
|

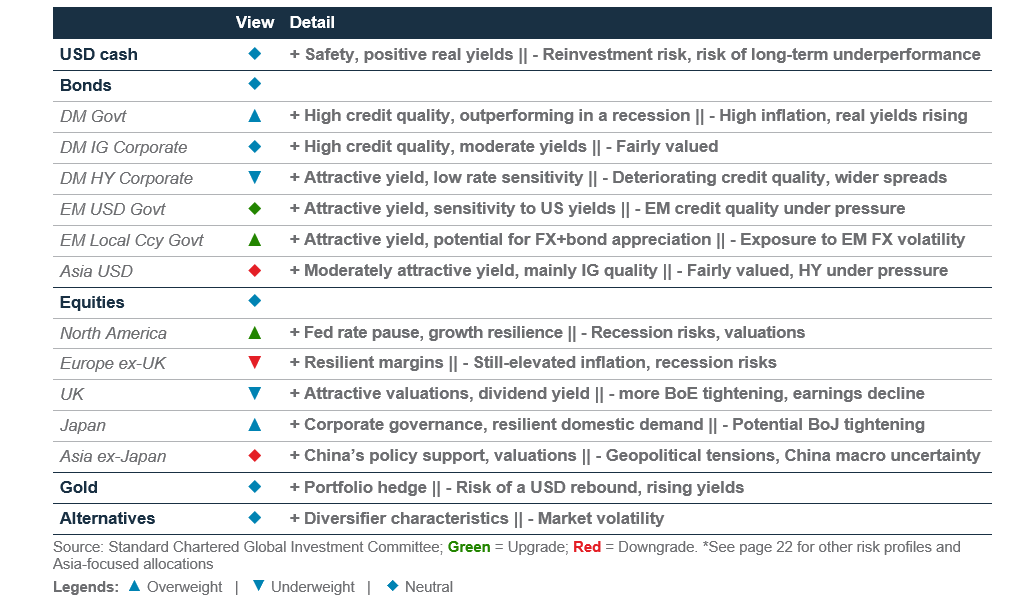
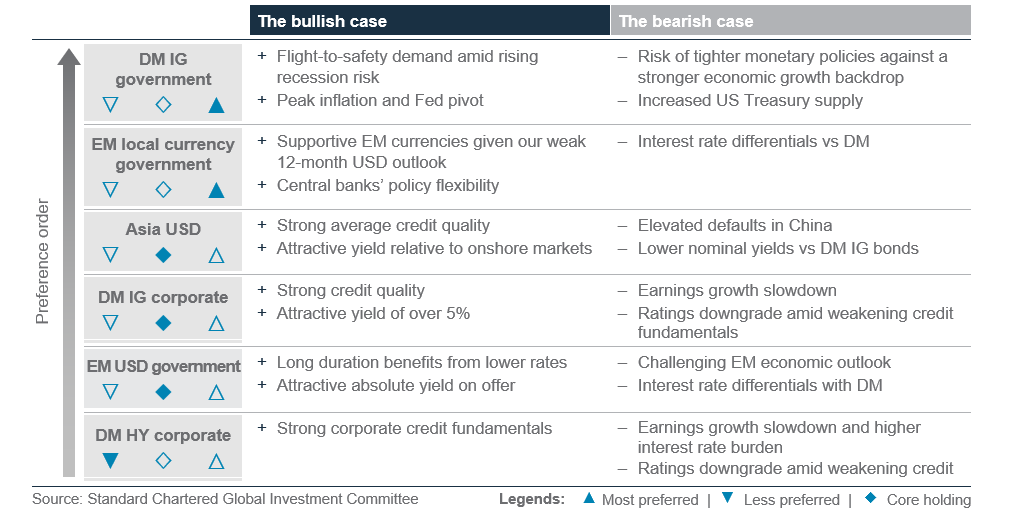
Our top preferences
(12-month outlook)
Foundation overweights
- Government Bonds
- In equities: US, Japan
- In bonds: DM IG government, EM local currency
Sector overweights
- US: Healthcare, technology, communication services
- Europe: Technology, healthcare
- China: Comms. services, consumer discretionary
FX views
- Modestly weaker USD
Structural macro trends*
- A digital tomorrow
- Preparing for an ageing world
- From unipolarity to multipolarity
- Investing in a climate-constrained world
*Individual reports available
Reshuffling after the pause
- Major central banks are now likely on pause as they gauge the impact of their extraordinarily rapid series of rate hikes amid a mixed bag of economic data. We believe this favours taking selective region, sector and credit quality risks.
- We upgrade US equities at the expense of European equities on the back of relative growth resilience. Developed Market (DM) bonds continue to offer an attractive risk/reward, with current yields creating a sizeable buffer.
- We trim Asia ex-Japan equities and Asia USD bonds to core holdings, as a catalyst for more significant Chinese policy stimulus is absent. In Asia, we retain our Japan equities Overweight and prefer diversified exposure across markets within Asia ex-Japan. We upgrade Emerging Market (EM) local currency bonds to Overweight.
Wait-and-watch policy ahead?
Financial markets have had a circumspect Q3. Major equity and corporate bond markets witnessed wide ranges, but are now back largely at end-Q2 levels. Strong Japanese equity market gains, the rise in US government bond yields and the surge in oil prices have been key exceptions.
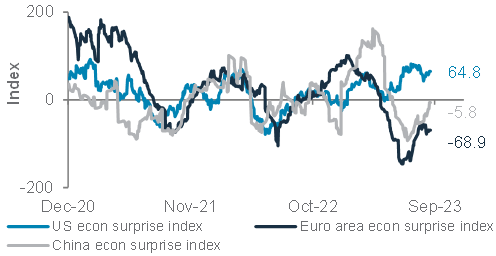
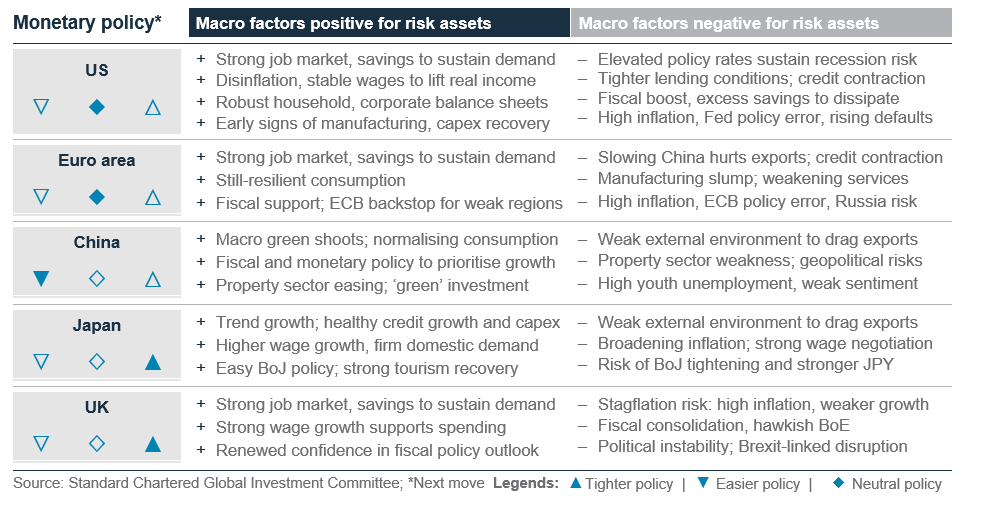
This market picture is likely a result of an intense investor debate reflected in the recent macroeconomic data. The US economy is balancing still-strong consumer spending and a very nascent bottoming of manufacturing against very weak leading economic indicators, still-elevated inflation and tight financial conditions. Europe is facing a manufacturing slump and a weakening services sector, the strong job market notwithstanding. Chinese growth remains under pressure from property sector woes, though some macro green shoots have been emerging.
Against this backdrop, we are of the view that major central banks are now likely starting an extended pause as they gauge the impact of their unusually rapid series of rate hikes. As we laid out in our H2 Outlook, we favour taking relatively smaller-sized risks within regions, sectors and quality segments, while maintaining balanced allocations across equities, bonds, cash, alternatives and gold.
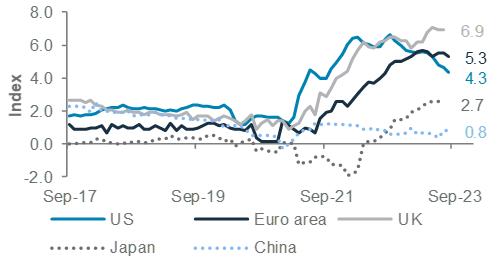
Fig. 1 US economic data has been surprisingly resilient relative to expectations in recent quarters
US, Euro area, China economic surprise indices
Upgrading US equities
Within our core allocation to global equities, we raise US equities to Overweight, funded by an Underweight in both Euro area and UK equities. This reflects what we see as continued resilience of US economic and earnings growth relative to the worsening outlook in Europe.
While US equities do face risks from valuations and weak leading indicators, we believe there is room for recent outperformance to extend as the start of an economic and earnings recession is delayed by the still-robust US consumer and AI-driven gains. In contrast, Euro area faces a more difficult growth outlook and increased inflationary pressure, which restricts policy flexibility.
Our Overweight on DM Investment Grade (IG) government bonds, of which US bonds are a significant part, remains unchanged. While the precise timing of yield peaks may be debated, historical episodes suggest that bond yields tend to plateau not long after a peak in Fed policy rates. The current absolute level of yield also offers a sizeable buffer against a further near-term rise. As an example, the yield on a US Treasury benchmark index would have to rise by over 0.75% before price losses start to outweigh the 12-month yield.
Sharpening our view on Asia
The second change this quarter is that we reduce Asia ex-Japan equities and Asia USD bonds to core (neutral) holdings.
In China, which remains a key component of Asian equity and bond benchmarks, a significant policy stimulus measure has thus far not been forthcoming. This may not be imminent without a strong catalyst, which does not appear to be in place at this time.
Within a core allocation to Asia ex-Japan equities, we continue to believe regional diversification remains key, to markets including India, which face a more contrasting growth/valuations outlook compared with China. Within Asia more broadly, our Overweight on Japanese equities, due to its cyclical nature, improving buybacks and corporate governance, and still-inexpensive valuations, is unchanged.
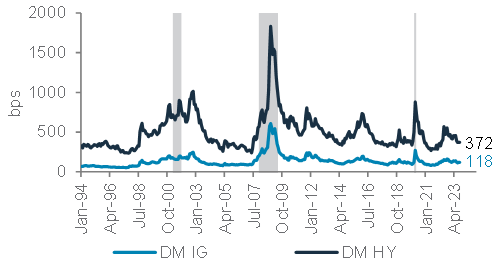
Fig. 2 Asian IG bonds have outperformed HY YTD, but limited value is left. HY remains under pressure
Asia USD bonds, IG and HY credit spreads
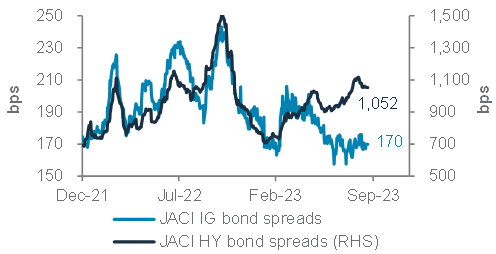
Within Asia USD bonds, IG bonds have outperformed High Yield (HY) bonds, in line with our expectations. However, IG bond spreads now appear to offer less value, while we do not believe the risk/reward has improved for HY bonds. Therefore, we reduce our allocation to Asia USD bonds to core (neutral) within global bonds.
Adding to EM bonds
Within bonds, we upgrade EM local currency bonds to Overweight. Besides the increasingly attractive yield, we believe that EM central banks, on average, have more room to respond to slowing global growth, which is positive for bond prices. Our view of a weaker USD over 12 months is another supportive factor. The asset class yield and room for price gains are likely to help offset the risk of a short-term overshoot in the USD.
We also close our Underweight on EM USD bonds, bringing our view up to a core (neutral) level. Here, we see a more balanced set of risks. The yield remains attractive and the asset class is sensitive to a fall in US government bond yields. However, EM credit quality remains under pressure amid still-high USD borrowing costs, including more difficult-than-usual refinancing conditions.
Balancing risk/reward in currency markets
Our expectations that US bond yields will ultimately move lower (towards 3.25-3.5% on the US 10-year government bond) on a 12-month horizon remain a key driver of our modestly bearish USD view. We continue to expect the JPY to ultimately be a key beneficiary of this. However, its current status as a low-yielding source of liquidity means any appreciation may not be immediately forthcoming.
On a shorter three-month horizon, a persistent bearish positioning on the USD remains one key challenge to a potential turn lower in the USD. However, we believe a pausing Fed and the fact that the USD is already at the top of its 2023 range tilt the risks towards a possible depreciation.
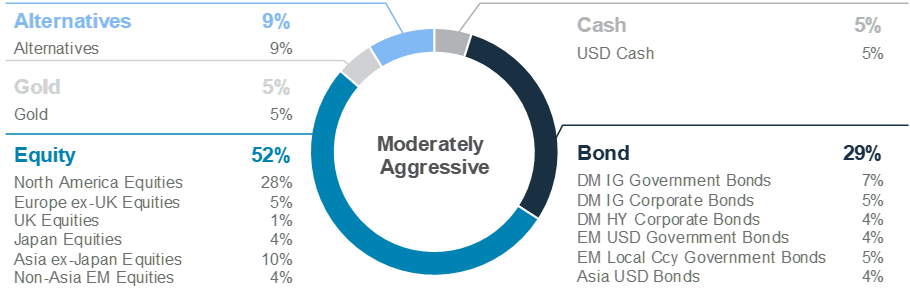
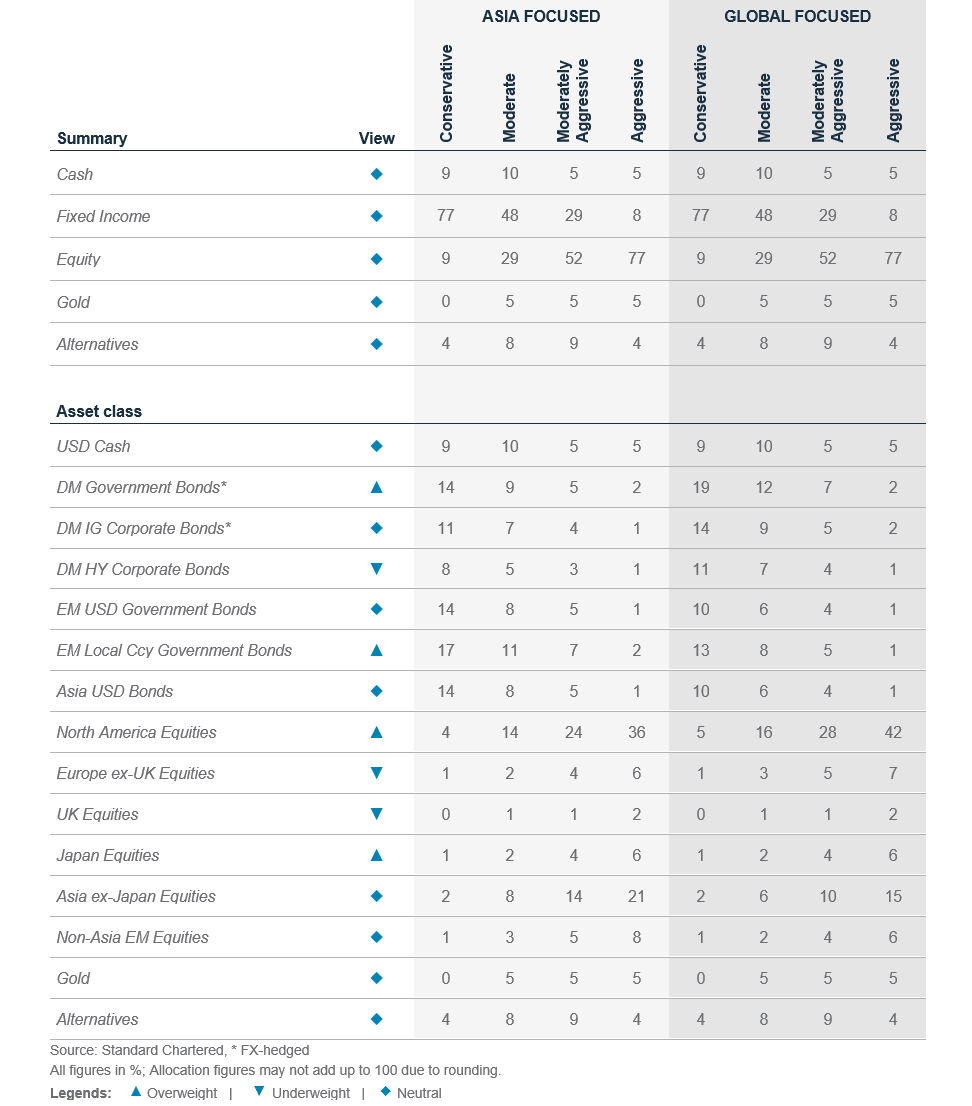
Foundation: Our tactical asset allocation
Global* allocation for a moderately aggressive risk profile
Multi-asset income allocation for a moderate risk profile
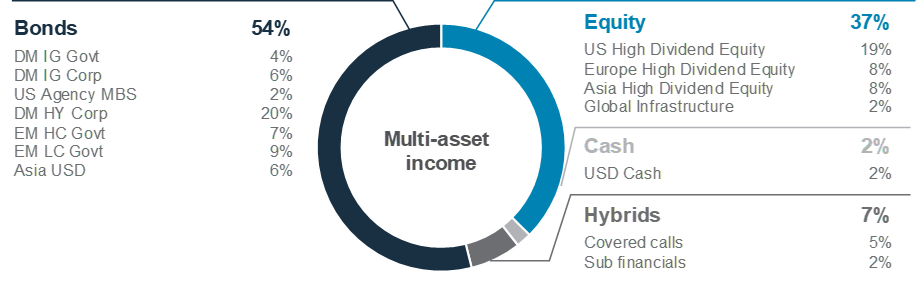
Foundation: Multi-asset income strategies
|
|
||||
Key themes
Our Multi-Asset Income (MAI) model allocation has returned 3.4% YTD and currently yields c.6.5%, an attractive level in our view compared with asset classes such as cash or government bonds. Dividend equities were the main contributor to the positive performance last quarter, while Developed Market High Yield (DM HY) and leveraged loans also added positively. The overall duration (a measure of price sensitivity to changes in interest rates) on the allocation is modestly lower than a year ago.
The yield on the MAI allocation has been steadily rising since March this year. While major central banks, including the Fed and ECB, have signalled their intent to pause, rates are likely to remain elevated until policymakers have greater comfort inflation is returning sustainably to target. We believe the yield on MAI strategies will remain attractive in light of our view of an impending pause in central banks’ hiking cycle and potential rate cuts in 2024.
We increased our allocation to dividend equities this month, narrowing our underweight gap vs the strategic asset allocation (SAA) benchmark. This was funded by a reduction in fixed income, notably high yield and leveraged loans where we see signs of rising defaults rates against the backdrop of tighter bank lending conditions.
Key chart
Yields are likely to remain elevated for longer and still see a good runway for income strategies over the next 6 to 12 months
Fig. 3 Yields on the MAI portfolio still largely supported by fixed income assets
Yields, duration and allocations of bonds, equity and hybrid assets within our MAI portfolio
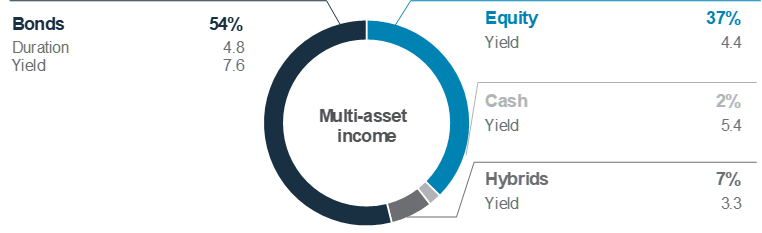
Fig. 4 Yields on income assets still attractive and might remain high for longer
Yield to worst/dividend yield (%), yield range of various income assets since 2014
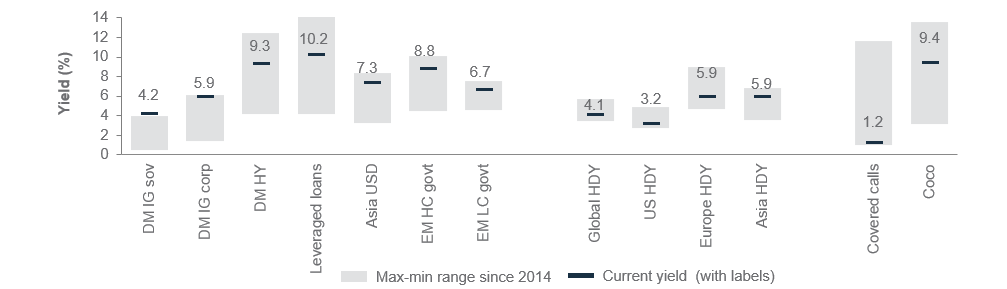
Contingent Convertibles are complex financial instruments. (Refer to Important Information on page 27 for further details)
Stellar double-digit returns from covered calls, Europe dividends and leveraged loans
The MAI allocation faced challenges in Q3, although it managed to eke out a 0.6% absolute return. There were broad-based gains in dividend equities, with Asia dividend equity being the strongest contributor. Credit assets such as DM HY and Leveraged Loans also added to the performance given still-strong corporate earnings and support for the latter from higher rates. Hybrid assets, such as covered calls, also performed strongly in 2023; they were the best-performing asset class within MAI, generating 8.0% return YTD. The key performance detractor was Asia USD bonds.
We expect yields to remain higher for longer, which is favourable for MAI. Our conviction and also our base case is that we are now at peak rates, both from the Fed and the ECB. Policymakers are likely to take stock of what their actions mean for economic growth and review their impact on combating high inflation. In the event of weakening US economic growth, we do expect the Fed to cut interest rates. As such, we see the yield on MAI strategies remaining high relative to history, until central banks are convinced to begin cutting rates in 2024.
Upping equities while dialling back on DM credit and Asia USD
Within our MAI allocation, we are now tilting back to a more balanced allocation between fixed income and equities. We have lowered our 12-month US recession probability to 55% and have also pushed back the likely start to Q2 24. While this view still reflects an elevated risk of recession, we believe recent resilience in economic data supports an uplift to our equities allocation, which is mainly funded from DM HY, leveraged loans and Asia USD bonds.
Fig. 5 Relative performance of Asia dividend equities has been the most outstanding
Relative performance of relevant indices since 21 September 2022
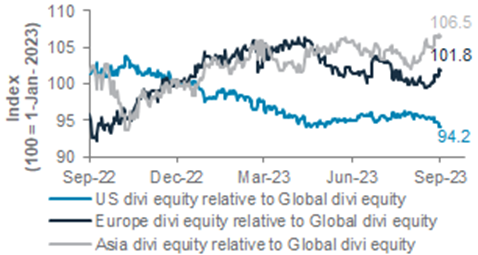
Our uplift in equity allocations added mainly to our regional dividend equities. The broader market sentiment has been relatively uncertain, but equity markets have held up on still-resilient economic data, especially in the US. The performance of global high dividend equities has picked up alongside global equities, led mainly by Europe dividend equities (7.5%) and Asia dividend equities (10.0%), while the US was the only region with a slight negative return (-0.6%) YTD.
Cutting our overall bond exposure, mainly through reductions in DM HY and leveraged loans allocations
We reduce our allocations to DM HY and leveraged loans, taking a more balanced approach between DM HY/LL and US dividend equities. Yields on DM HY continue to look attractive. As such, we continue to retain a sizeable c. 20% allocation to HY/LL, although this has been reduced from its previous allocation of c.25%. However, asset class default rates are beginning to rise due to higher funding costs and tighter bank lending conditions. We believe that these will worsen issuers’ fundamentals and could lead to a deterioration in credit quality. Thus, we have trimmed back on our allocation to HY/LL. While the negative ratings momentum has been more concerning for leveraged loans where the pace of downgrades has been the fastest during the post-Global Financial Crisis period (excluding the COVID-19 period), we retain a largely neutral stance between the two asset classes.
We have also reduced our allocation to Asia USD bonds. The performance of Asia USD bonds has been largely flat for the year, with the Chinese property sector being the key drag. While there have been supportive measures for the sector, such as PBoC rate cuts and credit-easing measures, there are lingering concerns if this recovery can be sustained. Capital markets have also been expecting a much larger-scale fiscal stimulus from the Chinese government to combat the deflationary pressures and achieve their growth target; however, such measures have not yet been forthcoming.
Lastly, we have added to Emerging Market (EM) bonds, especially EM local currency bonds:
1. EM central banks have likely reached the later stages of the interest rate cycle by this time, with some having cut rates already. This should bode well for returns.
2. Our expectation for a weaker USD over the next 12 months should act as a tailwind given FX has historically been a key driver for EM local currency bonds.
With the macroeconomic outlook remaining uncertain, a diversified income allocation offers a prudent way to maintain equity exposure. Additionally, the likelihood that major central banks are at, or close to, the peak in the rate hiking cycle means there is an attractive opportunity available to lock in high long-term yields.
Perspectives on key client questions
|
|
||||
How can investors address Chinese market exposure?
China’s equity investors have been facing significant challenges of late. The MSCI China index has fallen by 54% from its peak in February 2021 and has been in a bear market since May the same year. While a drawdown of this magnitude is not unusual for the volatile Chinese equity market, which saw a peak to trough decline of 74% during the Global Financial Crisis, the current selloff has weighed on investor sentiment amid a vigorous debate on China’s long-term trend growth expectations and the optimal policy response.
In this report, we offer a perspective on the evolution of Chinese economic growth, highlight potential positives, mitigating factors against the recent gloom and share our recommended course of action for financial market investors.
Three distinct phases in China’s economic growth:
- Agricultural reforms (late 1970s – 2000): In the late 1970s, China initiated agricultural reforms and dismantled direct controls, resulting in a remarkable tripling of food production during 1980-2000.
- Manufacturing export boom (1990s): In the 1990s, China experienced a manufacturing export boom, leading to employment growth, increased incomes and rapid industrialisation.
- Property and construction boom (2000s): By the mid-2000s, property sector reforms, coupled with the surge in savings from the years of export-driven growth, fuelled an explosion of investments into property and construction and powered China’s double-digit growth for a third decade.
By the early 2010s, however, the two growth engines of the Chinese economy – the exports and property sectors – began to slow. The global share of industrial imports from China remained stagnant at c.25% since 2015 as rising wages drove low-end manufacturing to other economies. Subsequently, housing sector activity also started to slow amid market saturation concerns and efforts by authorities to curb excessive debt and speculation, resulting in defaults by major property developers that further undermined confidence. Concerns about a balance sheet recession emerged in 2023, a scenario where households and businesses focus on reducing debt rather than spending or investing, leading to slower growth.

Fig. 6 The twin growth engines of China’s economy have slowed
Contribution to real GDP from property & construction and export sectors
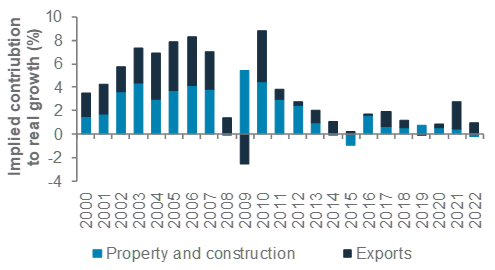
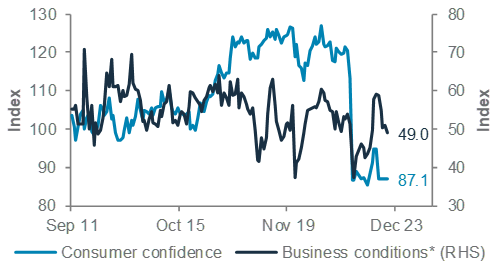
Fig. 7 China’s consumer and business confidence is low
China’s NBS Consumer Confidence Index and Cheung Kong Graduate School Business Condition Index
The end to rapid debt-fuelled growth
Between 2009 and 2016, China experienced a rapid growth in debt. Overall financial debt levels rose by more than 100 percentage points of GDP over the period amid an accommodative regulatory environment and policy-led stimulus lending. Innovative lending practices, including structured credit products and off-balance sheet credit, proliferated. While this was successful in addressing the growth challenges of the time, bad loans increased and credit quality deteriorated.
By 2016, after almost seven years of rising debt levels, policymakers shifted focus towards deleveraging and reducing systematic risks. While total debt-to-GDP remained high, it stopped rising precipitously by 2017. More recently, authorities also clamped down on property sector debt. The emphasis on deleveraging ended rapid debt-fuelled growth and likely explains the current policy reluctance to introduce any form of “bazooka” stimulus, which would arguably risk reversing deleveraging gains.
Confidence, a key headwind
As demonstrated by the confidence survey data, consumer and business confidence remains low. Several factors likely contributed to this, including stress in the property sector, prior disruptions to the services sector from COVID-19 policies and regulatory crackdowns on individual sectors. Falling home prices have likely had a negative wealth effect, which in turn can result in households saving more and spending less.
Externally, growing US-China tensions have become another headwind to business and investor confidence. The US ‘Pivot to Asia’ and President Trump’s election and introduction of tariffs by 2018 kickstarted a series of tit-for-tat measures from both sides, particularly in the technology sector. For financial market investors, this resulted in a higher-than-usual level of uncertainty.
Differentiating between slow growth and a crisis
Despite these challenges, an imminent ‘crisis’ is unlikely. Deleveraging efforts since 2016 have improved bank balance sheets, reducing off-balance sheet credit from 20% of total domestic credit to only 6% today. Crucially, Chinese commercial banks, with liquidity support from the PBoC, are expected to continue pursuing loan forbearance and provide liquidity to the credit market. These factors, together with a largely closed capital account, help mitigate the risk of current challenges escalating into a ‘crisis’.
Similarly, the risks of the property and construction sector stress spilling over into a broader credit crisis is also low. Chinese homeowners have significant equity in their homes, as down payment requirements have been high for many years now. A decline in home prices is, therefore, unlikely to result in significant defaults on mortgages. This suggests default risks could be contained within the corporate bond asset class, with the PBoC limiting contagion risks.
Transitioning to a new growth model
Amid the gloom in certain sectors such as property, it is equally important not to lose sight of sectors that fit into the Chinese economy’s transition to a new growth model. China has enormous potential to move up the value-added chain and has achieved considerable progress in the manufacturing of electric vehicles, solar panels, passenger aircrafts and semiconductors. Therefore, it is not inconceivable that China transitions to a high-end manufacturing boom, not unlike the period of rapid export growth in the early 2000s. China’s consumers are also a source of untapped potential. Consumption penetration rates are low and a rise in the consumer’s share in the economy can power the next phase of economic growth.
Investment implications
In our view, the following approach can help investors navigate this mix of challenges and opportunities:
- We are of the view that Chinese assets face challenges from slowing growth, but not from a risk of an imminent financial crisis. Further policy support is likely to be forthcoming, though catalysts for a large ‘bazooka’-style measures are likely not in place.
- One key step to balance the risk/reward trade-off is to ensure allocations to Chinese assets are in line with one’s risk appetite. For example, a moderately aggressive risk profile has a 10% allocation to Asia ex-Japan equities and a 4% allocation to Asia USD bonds. These would be consistent with our current core holding (Neutral) view on China and Asia ex-Japan equities and Asia USD bonds. See page 14 for more.
- We believe it is also optimal to ensure Asian allocations are well diversified. In equities, for example, Japan remains a conviction Overweight, while other Asia ex-Japan markets such as India can offer a very different structural outlook.
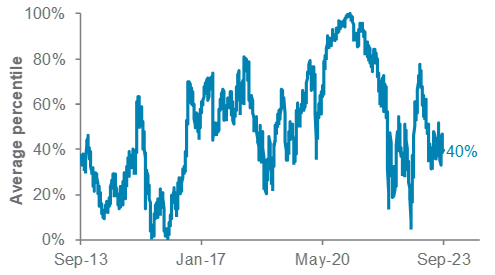
- Finally, our sector picks can offer a more focused approach. Opportunities for growth exist in specific sectors, but the risk/reward on broad Chinese equities appear limited in absence of a strong catalyst.
Fig. 8 Chinese equities are inexpensive but not extremely cheap either
Average of 10y percentiles of various valuation metrices*
Macro overview – at a glance
Summary
|
|
||||
Key themes
We lower our 12-month recession probability and push back the likely start of a US recession to Q2 24. The boost to consumption from post-pandemic stimulus is lasting longer and there are signs of recovery in manufacturing investment, prolonging the expansion. However, our leading indicators continue to flag elevated risk of a recession over the next 6-12 months because of the sharp monetary policy tightening and as effects of the fiscal stimulus fade. Hence, we expect the Fed and the ECB to hold rates for the rest of the year before cutting 75bps and 50bps, respectively, by Q3 24. Rising oil prices and US government shutdown are risks.
China remains at the opposite end of the global economic cycle as it fights deflationary pressures. Although economic growth is likely to hit the government’s 5% target this year, business confidence remains weak. There are signs of stabilisation in consumption following PBoC rate cuts and credit easing and measures to support consumption and the property sector. However, authorities have refrained from implementing large-scale fiscal stimulus, given the objective of sustainable and ‘quality’ growth. We expect targeted fiscal measures, especially to support local government finances, in the next 6-12 months.
Key chart
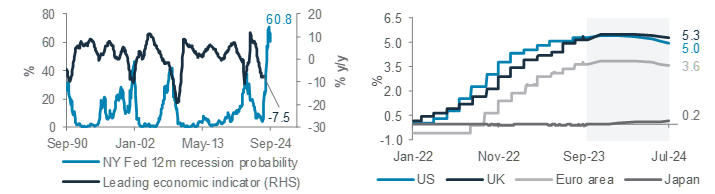
US leading indicators are still pointing to heightened risk of a recession over the next 6-12 months. We expect Developed Market central banks to hold rates at current levels for the rest of the year and start cutting rates next year as growth slows sharply
Fig. 9 Major central banks likely done with rate hikes; focus shifts to supporting growth
US 12m recession probability, leading indicator; money market expectation of key policy rates
Top macro questions
Will the US avoid a recession? Consensus estimates have shifted from expecting a recession as early as H1 this year to a more optimistic scenario, with no recession expected at least until early 2025, with the lowest point seen in Q1 24 (0.1% q/q annualised growth). This shift is driven by: i) sustained boom in consumption, aided by a robust job market and excess savings accumulated during the pandemic; ii) prolonged impact from record fiscal stimulus during the pandemic; and iii) increased private investment in manufacturing and residential housing. Consequently, we lower our 12-month US recession probability to 55% (slightly below the New York Fed’s 60% probability) and postpone the likely start of a recession to Q2 24.
These recession probabilities are still high by historical standards. i) Consumption is likely to fade after a summertime boom as household excess savings get depleted by early 2024, forcing consumers to rebuild savings. Upcoming student debt repayments are likely to put further pressure on household finances; ii) the impact of prior fiscal stimulus is likely to wane, with the possibility of additional stimulus constrained by a divided Congress (there is risk of another government shutdown during budget session talks in October); iii) furthermore, the impact of Fed rate hikes over the past 1.5 years are affecting vulnerable parts of the economy, contributing to an uptick in corporate bankruptcies.
These risks explain why our indicators continue to flag heightened risk of a US recession. The Leading Index of 10 key economic indicators (LEI) and the US government bond yield curve have historically been the most reliable predictors of a coming recession. The LEI has reported a y/y decline for the past 16 months, a trend that has historically preceded recessions. Additionally, the US government bond yield curve has remained inverted since July last year (shorter-tenure bond yields have remained above longer-tenure bond yields, signalling monetary conditions are tight enough to cause a sharp downturn in the coming years). At its extreme in March and July this year, the US 10-year bond yield was almost 111bps lower than the 2-year yield, the biggest inversion since 1981. Historically, a US recession has started 9-22 months (median: 16 months) after the 2-year yield rose above
the 10-year yield (this cycle: July 2022), 2-16 months after the curve became most inverted (this cycle: March and July 2023), and 2-6 months after the curve sustainably turned positive again (yet to happen, although in 1982, the curve turned positive almost a year after the recession had started). Based on this history, there is a high probability of a recession starting anytime between Q4 2023 and Q2 2024.
Is the Euro area already in a recession? The Euro area economy has stagnated since H2 last year, with Germany, the region’s largest, contracting y/y since Q1 this year. The latest business confidence indicators (PMIs) suggest service sector activity has started contracting since August, alongside the already depressed manufacturing sector. The ECB’s record policy tightening (450bps rate rise since July 2022) has led to tighter lending standards and a sharp deceleration in borrowing, while China’s economic slowdown hurts the region’s exporters. The region is gradually adjusting to last year’s energy shock after the halt of supplies of the relatively inexpensive Russian gas. Although gas prices have fallen sharply from last year’s highs as Russian pipeline gas is replaced by a surge in liquefied natural gas imports, core inflation remains elevated due to elevated wage pressures amid a tight job market. Elevated inflation is likely to keep the ECB on hold for the rest of the year before a recession leads to rate cuts next year.
Is China’s recovering? China’s economy is showing some signs of stabilising after a sharp downturn in Q2. The latest economic activity data from August show a nascent upturn in domestic consumption. However, the property sector remains the biggest drag, while exports continue to contract amid a slump in global trade. Recent measures seem to have encouraged first time home buyers in Tier 1 cities, although the recovery has yet to broaden. With monetary easing progressively having less effect, investors are looking for more forceful fiscal stimulus, especially targeting cash-strapped local governments. The annual Central Economic Work Conference in December is likely to set the agenda for 2024. We expect measures to boost youth employment via support for advanced technology and green infrastructure.
Fig. 10 The Euro area is leading an economic downturn
US, Euro area, China and Japan Composite PMIs
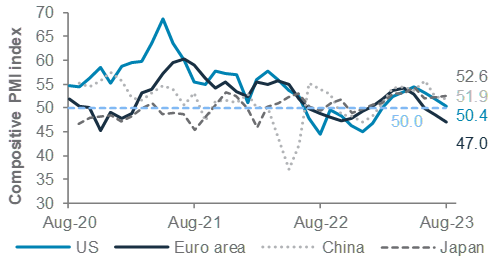
Fig. 11 Inflation has peaked in the US and Euro area
Core inflation in the US, Euro area, UK, Japan and China
Asset Classes
Bonds – at a glance
|
|
||||
Key themes
We are Overweight Developed Market (DM) Investment Grade (IG) and Emerging Market (EM) Local Currency (LCY) government bonds. However, the US economy’s resilience thus far means we expect the US 10-year government bond yield to stay above 4% over the next three months before drifting lower to 3.25–3.50% over the next 12 months. We also raise EM local currency bonds to Overweight as we expect supportive central bank policies and a weaker USD to support the asset class.
We dial back Asia USD bonds to Neutral and raise EM USD government bonds to Neutral. EM USD bonds face a somewhat improved outlook amid slightly improved risk appetite, though still-challenging credit quality holds us back from upgrading further. Asia bonds are likely to be held back by continued China property sector woes and reduced value in IG bonds; we continue to prefer IG over HY in Asia USD bonds.
We are Underweight DM HY bonds as we view the current yield premium as insufficient to compensate for recession risk. The recent rise in expectation of a “soft/no landing” scenario has driven their outperformance in the last few months, but we believe the asset class faces challenges from a higher refinancing hurdle, credit quality pressure and expensive valuation.
Key chart
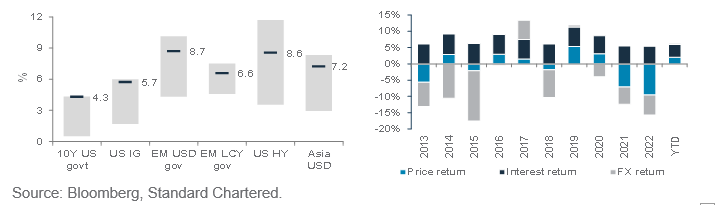
DM IG government bonds offer an attractive risk-adjusted yield; EM LCY bonds to benefit from slower growth, lower inflation and rate cutting prospects
Fig. 12 DM government bonds offer an attractive risk-reward profile; EM LCY government bonds to benefit from lower yields (higher prices) and FX gains
Current yield for bond asset classes and their 10y range; EM LCY government bond price returns, interest returns and EM FX returns since 2013 to-date
Why have you upgraded EM LCY government bonds to Overweight?
EM local currency (LCY) government bonds have delivered a return of roughly 5.7% YTD, largely driven by the yield paid and price gain (falling yield). We believe the asset class can continue to outperform global bonds in the next 6-12 months due to:
- EM benefits from DM growth resilience. Higher interest rates in DMs should theoretically decrease the relative attractiveness of EM rates. However, we believe a resilient growth backdrop in the US, extended longevity of the current economic cycle, lower but still-supportive commodity prices and prospects of more fiscal stimulus in China could create risk appetite for EM assets.
- Interest rate cut prospects. We believe easing global inflation has put EM central banks in a better position to reverse monetary tightness when needed. Weaker growth prospects in 2024 and deteriorating global trade and financial conditions can catalyse such a move.
- EM FX should benefit from a weaker USD. The strong USD YTD has supressed EM FX performance. Falling US bond yields should result in a weaker USD. This, in turn, should translate to EM FX strength and add to EM LCY bond returns.
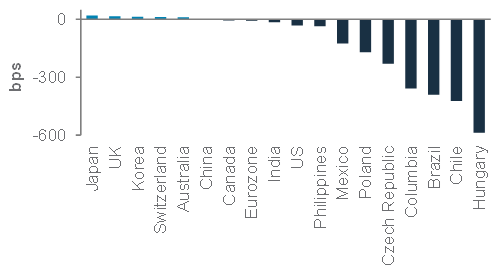
Fig. 13 Money markets are pricing significant rate cuts in EM countries, especially relative to DM
Implied policy rate differences one year from now
Why are you Overweight DM IG government bonds?
Resilient US growth has prompted a ‘higher-for-longer’ environment for bond yields. This, together with still-strong upward momentum in yields, means we expect the US 10-year government bond yield to stay above 4% in the next three months.
The debate on the precise yield peak notwithstanding, we retain our broader view that the fastest rate hiking cycle in DM is close to an end. Recession risk ahead should drive government bond yields lower. We expect the US 10-year government bond yield to move lower to 3.25-3.50% in the next 12 months.
Why have you downgraded Asia USD bonds and upgraded EM USD government bonds, both to Neutral?
About 50% of the Asia USD bonds asset class comprises Chinese bonds. This may end up being a limiting factor on asset class outperformance from here given a catalyst for significant stimulus remains lacking and the property sector outlook remains challenging. While Chinese authorities have launched a series of stimulus measures to revive the economy, especially the real estate sector, much of this is likely already in the price. Hence, we reduce Asia bonds to a core (Neutral) holding. Within Asia, we continue to prefer IG bonds over HY bonds due to their stronger fundamentals.
We upgrade EM USD bonds to Neutral from Underweight. We believe outlook for EM bonds has improved as a resilient US economy offers support to riskier assets. However, their fuller valuation holds us back from being more optimistic.
Why are you Neutral DM IG corporate bonds and Underweight DM HY corporate bonds?
We believe the prospect of lower rates should support the performance of DM IG bonds due to their relatively high interest rate sensitivity. However, tightener monetary policies and the US small bank crisis in March have already worsened the outlook for corporates, with interest expense burdens a key risk to profit margins. As such, we remain Neutral on this asset class.
For DM HY bonds, we believe its recent strong performance amid stronger economic growth backdrop has reduced its relative attractiveness even further, compared with our preferred bond asset classes. We retain our view that refinancing pressure for HY issuers continues to pile up as financial conditions continue to tighten. We also view the current yield premium as insufficient to compensate for recession (and hence default) risk and a falling recovery rate from recent restructuring events.
Fig. 14 DM corporate yield premium appears tight vs levels seen during previous recession
DM IG and HY corporate yield premium; NBER-defined US recession
Equity – at a glance
|
|
||||
|
|
||||
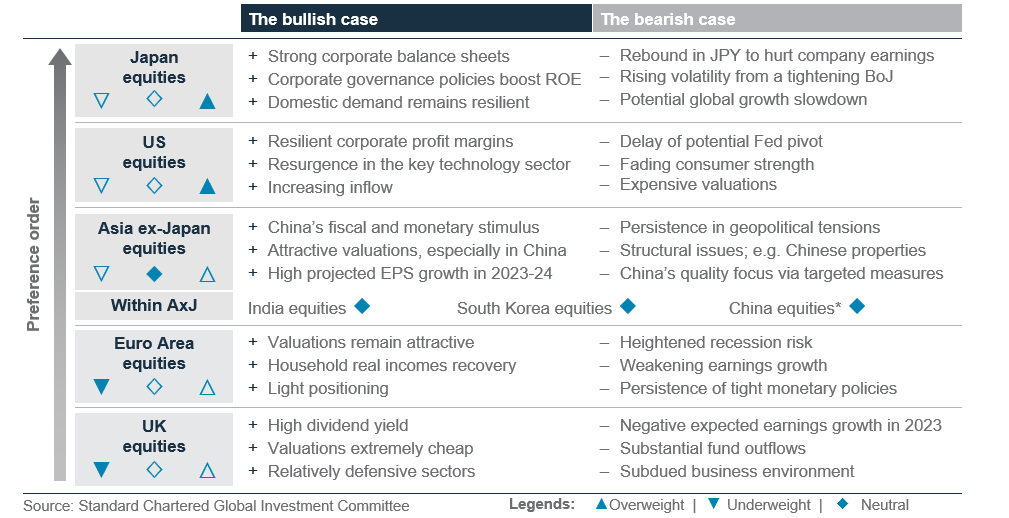
Key themes
We remain Neutral (core holding) on global equities in the coming 12-month horizon, backed by resilient economic data and corporate margins YTD. We upgrade the US to Overweight amid our positive view in the region’s earnings growth after it delivered stronger-than-expected Q2 results, on top of a likely pause in the Fed’s tightening cycle and recession delay.
Japan remains our most preferred region. Tailwinds such as improving corporate governance, rising share buybacks, net cash positioning and relative insulation from geopolitical exposures compared with its Asia peers are expected to support the region’s sustainable growth. A potential relaxation of Yield Curve Control policy is a risk which may dampen corporate earnings.
We trim Asia ex-Japan to Neutral, as a muted recovery in China weighs on consumption and earnings growth across Asian markets. We are Neutral on China within the region due to the “piece-meal”, but not “big-bang”, supportive policies from the government. India equities are also likely to perform in line with the region due to a tug-of-war between a high valuation premium vs strong estimated (consensus) EPS growth in excess of 20% in FY23 and FY24. We are Underweight UK equities as the region has the weakest earnings growth forecast this year, despite the market’s low valuation. We downgrade Euro Area equities to Underweight in light of the cooling macro data and declining profit margins.
Key chart
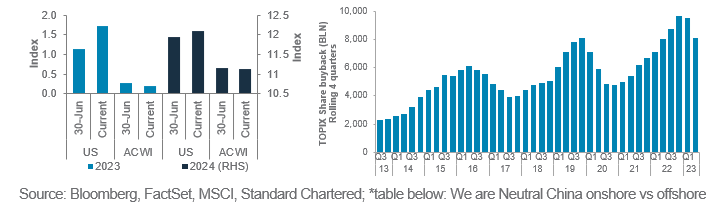
US companies continue to defy expectations and deliver solid earnings growth. Meanwhile, the Tokyo Stock Exchange’s initiative to improve corporate governance has led to more transparency and share buybacks from Japanese companies
Fig. 15 US companies’ earnings growth continues to dominate global earnings growth, while Japan is riding on improving corporate governance
US vs global earnings growth (LHS); Japan share buybacks
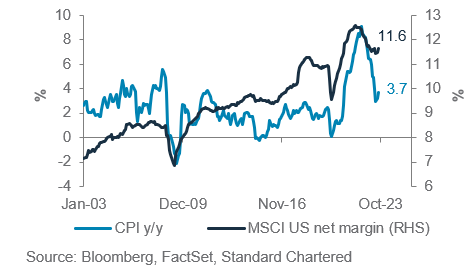
Upgrading US equities to Overweight
We upgrade US equities to Overweight. US companies beat expectations in the last earnings season, and their earnings growth is expected to outperform others. AI and technology-related industries are likely to fuel earnings expansion.
Meanwhile, US economic data has been resilient. Inflation is likely to have peaked and could continue to moderate. On the flip side, the region’s valuation remains relatively expensive, the rally is lacking in breadth and the Fed may not pivot as fast as investors expect it to. Our expectation of recession remains a risk, but our view that is likely delayed, especially relative to already-weak European growth, creates room for outperformance.
Fig. 16 US companies show solid fundamentals, while US inflation has been falling
US CPI and MSCI US net margin
Overweight Japan equities
Japan equities remain our most preferred region. The Tokyo Stock Exchange has been encouraging companies to improve their corporate governance. For example, companies with a price-to-book (P/B) ratio below 1 face more stringent disclosure requirements than companies with a higher P/B ratio. This has led to companies improving transparency and their interactions with investors.
Despite the recent rally, valuations vs global equities remain below the long-term average. A potentially strengthening JPY could hinder Japan’s economic recovery and dampen corporate earnings, but an unhedged FX exposure mitigates some of this risk. A potential relaxation of the BoJ’s yield curve control (YCC) policy may lead to heightened market volatility.
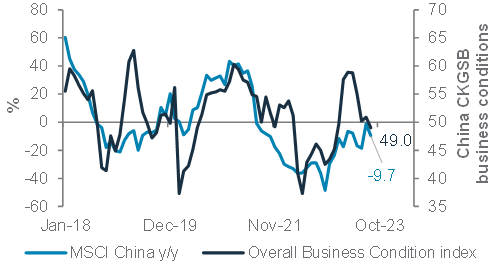
Downgrading Asia ex-Japan equities to Neutral
We downgrade Asia ex-Japan equities to Neutral (ie, a core holding), mainly due to China’s lacklustre economic performance, which spills over to the region.
China is flirting with deflation, while other key figures such as PPI and consumption remain weak. The wealth effect trickling down from the pressure on asset prices, such as properties, is likely to dampen sentiment in the near term. The government has been delivering “piece-meal” stimulus to the economy, but more stimulus may be required to have a more sustainable recovery.
We remain Neutral on China within the region. On the positive front, the region’s valuation remains cheap at 20% discount to global equities, which is below the long-term average. We are Neutral China onshore versus offshore, while caveat that potential escalation in geopolitical tensions may dampen the China offshore market’s sentiment.
We expect India equities to perform in line within Asia ex-Japan. They are projected to enjoy stellar EPS in 2023 – north of 20%. However, they are trading at an expensive valuation vs Asia ex-Japan equities, at north of 60% premium on a 12-month forward P/E basis.
Fig. 17 Business conditions remain lacklustre in China
Overall business condition index in China vs MSCI China y/y performance
Downgrading Euro area equities to Underweight
We downgrade Euro area equities to Underweight. The region is currently trading at a significant valuation discount, and positioning is relatively light.
However, monetary conditions remain tight, while there is heightened recessionary risk. Earnings growth has been lacklustre compared with the US.
Underweight UK equities
We remain Underweight UK equities. Valuations remain extremely cheap, but earnings growth outlook is negative and the weakest among all regions.
Inflation remains a key concern and could lead to further tightening by the BoE. Lastly, UK equities are heavy in the Value sectors, which are overshadowed by Growth exposures globally.
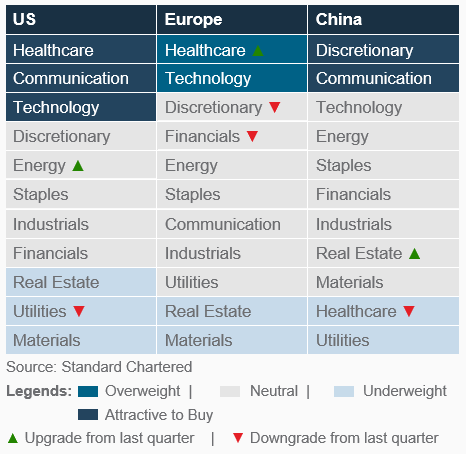
Equity sector views
|
Barbell approach in DMs
Buy consumption-oriented sectors in China
- Our barbell strategy continues in the US and extends to Europe: we prefer secular growth exposure on the one hand, balanced with defensive exposure on the other.
- In China, we would buy consumption-oriented sectors, namely consumer discretionary and communication services.
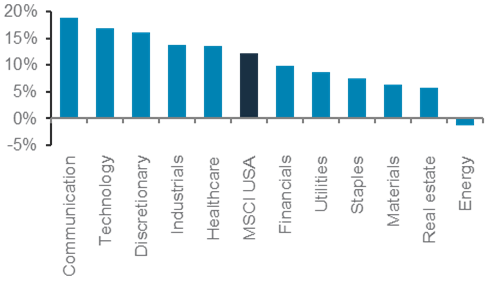
US
Our view is to buy three sectors – communication services and technology for their secular growth and the defensive healthcare to balance out the risks. Communication services has seen strong earnings momentum with expectations for 2023 growth upgraded, while 2024 growth remains stable. The sector could also benefit from AI applications, and its valuation remains attractive. Technology companies delivered broad surprises in Q2 results and the semiconductor segment is expected to drive a 2024 earnings rebound. AI has sparked significant orders benefitting chip companies, while software companies continue to see defensive recurring revenues. A better macro picture by year end could improve corporate IT spend. Healthcare remains our preferred defensive exposure to balance out the risks as a US recession in 2024 remains our base case. Relative valuation of the sector is reasonable.
Other views: We upgrade Energy to Neutral as producers’ discipline is supporting the oil price. We are Underweight materials amid risk of a growth slowdown especially in China. We are Underweight real estate as high interest rates weigh on property prices. We downgrade utilities to Underweight amid poor price momentum and rich cashflow valuations.
Fig. 18 US communication services and technology sectors are expected to deliver the strongest earnings growth in 2024, while healthcare offers defensive growth
Consensus 2024 EPS growth by sectors in the US
Europe
We upgrade healthcare to Overweight to provide defensive exposure as we turn more cautious on broader European equities. We are Overweight technology, which is expected to deliver among the top earnings growth in 2023 and 2024. Over 50% of the sector comprises semiconductor companies that are expected to benefit from AI investments and structural growth in semiconductor usage.
Other views: Consumer discretionary and financials are downgraded to Neutral as we turn more cautious on the consumer and Europe’s economy. We are Underweight real estate as high rates weigh on property valuations. We are Underweight materials as it continues to see weak demand.
China
Our view is to buy two sectors – communication services, which is dominated by media and entertainment companies that benefit from greater consumer spending and policy support for internet firms, and consumer discretionary,which would also benefit from policymakers’ priority of boosting domestic consumption. Q2 results in both sectors were strong, continuing the strong momentum from Q1.
Other views: We upgrade real estate to Neutral as policy easing is expected to continue. We are Underweight utilities where price momentum has been poor and there is tariff uncertainty. We downgrade healthcare to Underweight amid poor price momentum and corruption issues.
Fig. 19 Our sector views by region
FX – at a glance
|
|
||||
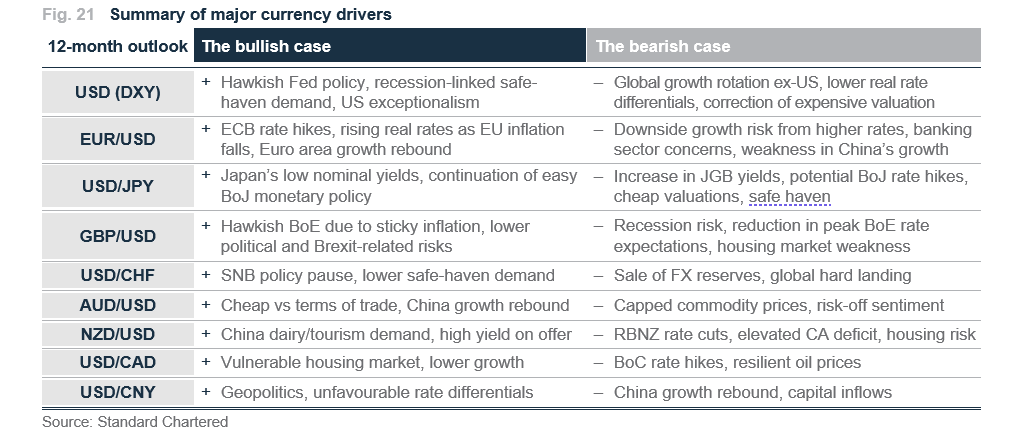
Key themes
We are bearish on the USD over 3 and 12 months, but we moderate our downside expectations. The USD index (DXY) rally since mid-July has predominantly been driven by US exceptionalism, with US growth expectations outpacing those of other developed markets. Resilience in the US economy has led us to lower our recession expectations. This reduces the need for the Fed to cut rates rapidly in 2024, as evidenced by the latest “dot plot” released by the FOMC. That said, we believe the recent USD rally has overshot fundamentals and we expect USD to decline towards 103.6 over the next 1-3 months as the currency returns closer to our estimated fair value.
Over the next 12-months, the broader fundamental drivers for USD weakness are still in place. While the Fed may cut rates at a slower pace than previously anticipated, it is still expected to deliver more rate cuts vs other Developed Market (DM) central banks. This combined with a rebound in China’s growth and faster decline in European inflation (vs the US) should lead to further compression of the USD’s real (net of inflation) interest rate differentials and push the USD lower.
Although the recent ECB hike appears to be the last one in the current cycle, still-elevated inflation and expectations of sticky wage growth should lead the ECB to keep rates at elevated levels longer than the Fed, which should support EUR/USD upside over the next 12 months. The dovish tilt from the SNB in its latest policy meeting leads us to expect a range-bound USD/CHF. While China’s growth struggles are likely to weigh on the CNY, AUD and NZD in the near term, our base case for eventual growth rebound should lead these currencies to strengthen vs the USD over the next 12 months.
Key chart
2024 US growth expectations have been revised higher, while those for other countries have been pushed lower. More resilient growth means that the Fed may cut rates at a slower pace than previously expected, limiting USD downside.
Fig. 20 US growth resilience to limit USD downside
FX performance and revision in 2024 growth forecasts; table of forecasts
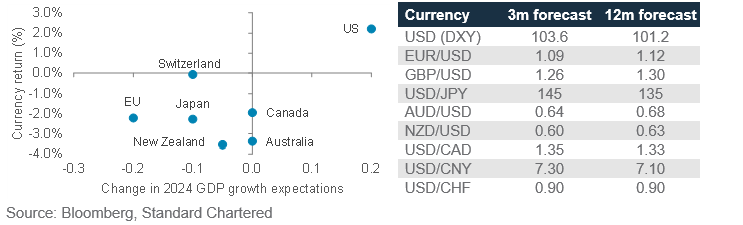
Growth expectations impact FX performance
We lower our 3- and 12-month EUR/USD forecast to 1.09 and 1.12, respectively. Rising signs of a growth slowdown due to a combination of higher interest rates and lower Chinese growth have weighed on the EUR. Over the next three months, the correction in the USD and the market’s reassessment of the ECB are likely to push the EUR higher. Over the longer term, strong current account balance, rebound in China and delayed rate cuts from the ECB, which should lead to more favourable interest rate differentials, argue for EUR/USD gains, though a slower pace of Fed rate cuts could limit the gains.
Fig. 22 Fed is expected to cut rates faster than other central banks, which should lead to most currencies appreciating vs the USD
Market-implied policy rate changes till Sep 2024
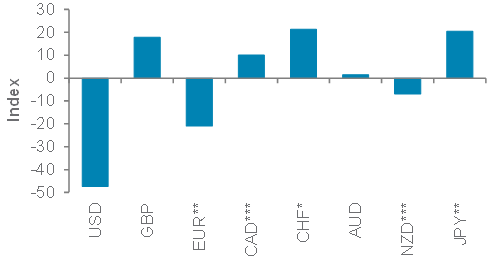
*Data available till Jun 2024; ** till July 2024; *** till August 2024
We expect GBP/USD to be rangebound in the near term, before rising over 12 months. The UK’s growth slowdown and declining house prices are likely to keep markets guessing about the peak BoE rate in the near term. However, the uncomfortably high inflation should eventually push the BoE to hike rates further, which would mean that the GBP could offer the highest interest rate among G-7 currencies.
We revise our 3- and 12-month USD/JPY forecast higher to 145 and 135, respectively. Despite the BoJ now allowing 10-year JGB yields to rise towards 1%, the slow pace of rise in yields has meant that US yields have risen at a faster pace, pushing USD/JPY higher. However, with inflation leading to more domestic discontent, we expect the BoJ to turn more hawkish, which combined with our expectation of lower US yields, should push USD/JPY lower over the next 12 months. However, the trajectory of the decline is likely to be choppy.
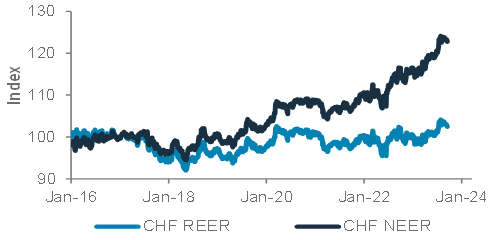
The outlook for USD/CHF has turned more balanced and should trade around 0.90. In its latest policy meeting, the SNB paused its rate hiking cycle, as domestic inflation has been below the 2% threshold for the past six months. Our less bullish EUR forecast also reduces pressure on the SNB to be hawkish, given the central bank focusses on the EUR/CHF level to manage imported inflation.
Fig. 23 Recent CHF strength has led to fairly expensive valuation on a nominal basis
CHF Nominal and Real Effective Exchange Rates
While the RBA and BoC may still hike once more, we believe the RBNZ’s next move would be to eventually cut rates. The AUD, NZD and CAD are likely to trade in a range as markets try to assess the next move from central banks. Nonetheless, elevated oil prices and potentially resilient commodity prices, due to our expectation of a growth rebound in China, are likely to be supportive for the commodity currencies (AUD, NZD and CAD) over the next 12 months.
We expect near-term increase in USD/CNH towards 7.30, even possibly 7.38 on a technical overshoot, as the recent PBoC easing will lead to wider interest rate differentials and as the CNH CFETS basket (a measure of CNY valuation) is still not cheap. Over the next 12 months, we expect USD/CNH to decline towards 7.00-7.08 as the CNH benefits from robust domestic growth and potential investor flows.
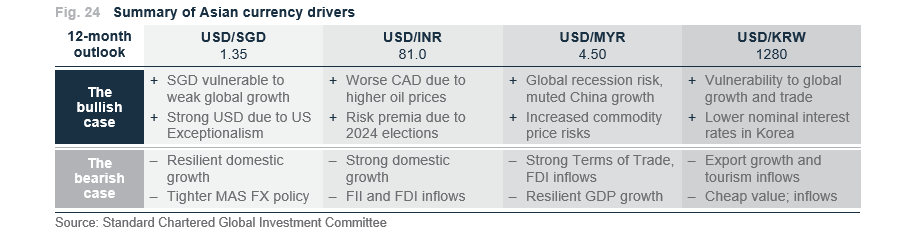
We expect USD/INR to decline modestly towards 80-81 over the next 12 months. The INR could benefit from a broad USD weakness, strong domestic growth and declining current account deficit. However, greater risk premium ahead of the 2024 elections and weaker current account due to higher oil prices may cap gains. USD/SGD is likely to decline modestly towards 1.35 over the next 12 months. While we do not see any near-term changes in MAS policy, the benefit of strength in EUR, CNY and MYR should be tempered by the move of SGD NEER towards the centre of the band.
Gold, crude oil – at a glance
|
|
||||
Key themes
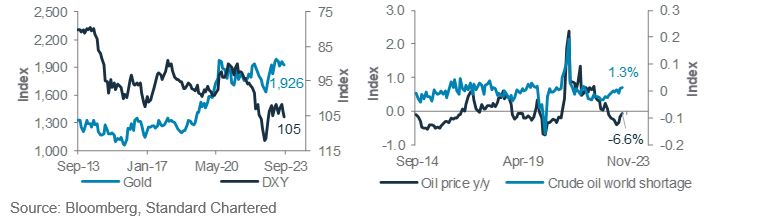
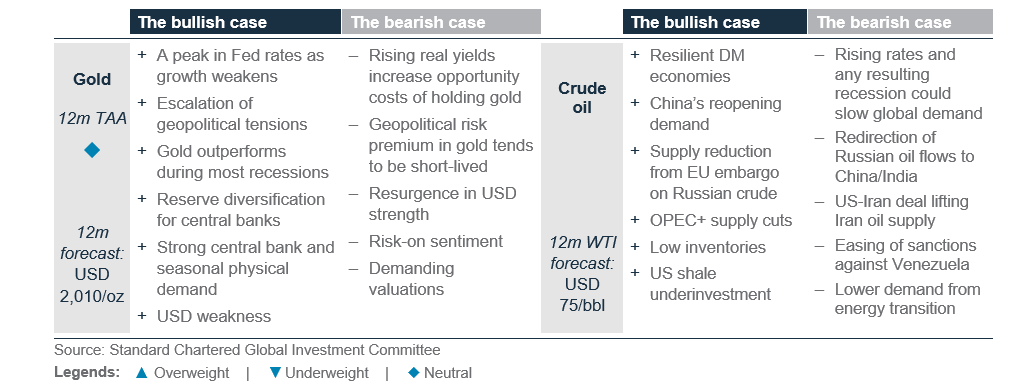
We keep our Neutral view on gold vs other major asset classes, with a 12-month forecast of USD 2,010.
The market believes the Fed’s rate hike cycle is close to its end though inflation accelerated for a second straight month in August to 3.7%, higher than expected. Real yields are likely to increase, which means the opportunity costs of holding gold
may be pushed higher and lead us to see a smaller upside for gold from here. Gold has historically outperformed in recessions and displayed safe-haven properties during crisis situations. These increase the appeal of gold as a hedge against a backdrop of elevated macro uncertainty. Continued central bank, household and investor demand are other key drivers to support gold.
We stay moderately bullish on oil on a 3-month horizon amid OPEC+ supply tightness. While Saudi Arabia extends its oil production cut till year end, with a possibility of extending it even further, the scope of further production cuts has not been ruled out. Because of this, we raise our 3-month WTI oil price expectation to USD 90/bbl. On a 12-month horizon, we expect it to trend lower towards USD 75/bbl. The global crude oil consumption growth y/y has declined amid a slowing Euro area and Asia, but oil’s slowing supply growth risks are intensifying the oil market deficit and offering more support to oil. China’s economy remains a key swing factor; oil demand could improve if the economy undergoes a significant recovery in Q4.
Key chart
Crude oil demand remains weak, but contraction in supply supports oil prices
Fig. 25 The USD strength limits gold’s upside risk; Oil price growth is well supported by production cuts
LHS chart: Gold vs USD Index (DXY, inverse)
RHS chart: Oil price vs crude oil market deficit y/y
Quant perspective
US risk model turns bearish again on equity market risks
|
Model predicts higher equity market risks
Our US Equity-Bond Market Risk (EBMR) models the downside risks in US equities and the US 10-year government bonds. It uses 11 economic and market factors to create equity and bond risk barometers. If the value of a barometer falls below 50, it signals higher downside risks and vice versa.
The model remains in Stage 1 this month. Its previous move to Stage 2 (bullish equity phase) in June coincided with a 3.2% rise in S&P 500 at the end of July. The shift to Stage 2, however, was only a blip. Current Stage 1 predicts high downside risk in US equities, and low upside risks to US 10-year government bond yield (bond price falls as its yield rises). Since the model shifted to Stage 1 in July, S&P 500 has fallen by 2.7%, but US 10-year government bond yield rose by 36 bps against the model’s expectation.
Fig. 26 EBMR bearish on equity market risks
US equity and bond market risk barometers
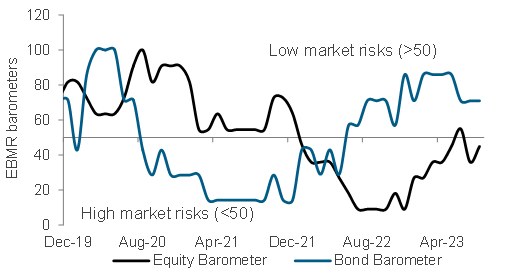
The bond barometer has been predicting low US government bond market risks this year. However, the hawkish stance by the Fed has pushed US 10-year government bond yield 46bps higher this year, and this is against what the bond barometer is indicating. Many of the factors behind the bond barometer, however, have also started to fall in magnitude. For example, the contraction in US manufacturing PMI, low broad commodity prices and flattish US capacity utilisation are currently supportive of bonds as they favour defensive assets. These factors are showing signs of bottoming.
The equity barometer has improved slightly this month, but it remains below 50. Momentum in US housing starts becomes a supportive factor once again, but we have cautioned not to read too much into its signals until a clear trend is established as it is a more volatile indicator. Other supportive signals remain largely unchanged and include faltering core inflation and positive medium-to-longer-term momentum in S&P 500. The latter has deteriorated but they remain positive over the time horizons we set (6 and 12 months). High interest rates remain a key drag on the barometer.
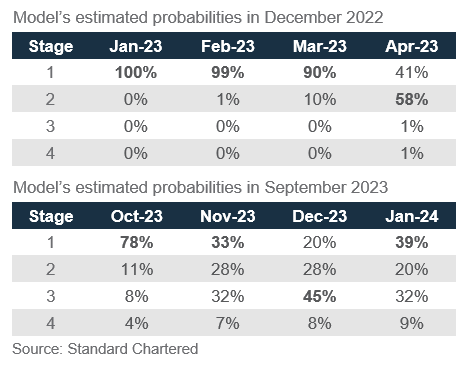
Our model’s projections now tilt towards Stage 1 for October and stay mixed for November to January. The downside risks to equities remain sizeable over these periods, with probabilities of Stage 1 ranging between 20% and 39%.
Implications on global assets
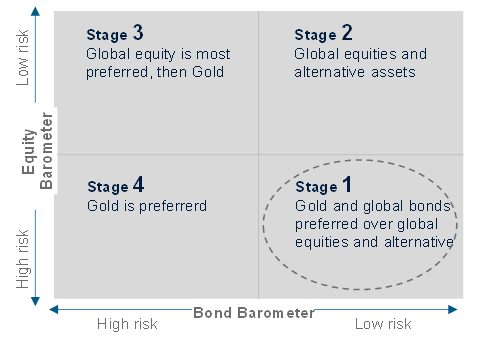
Data since 1999 suggest gold and global bonds are the most preferred in Stage 1. The model’s preference for the assets is based on its long-term relationship with the market cycle, which favours defensive assets in Stage 1.
Fig. 27 Scenarios over the coming months till January 2024 vs December 2022 projections
Probability of the evolution of financial market risk cycle from the current Stage 1 and preferred assets
Tracking market diversity
|
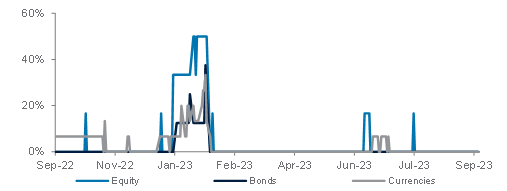
About our market diversity indicators
Our market diversity indicators help to identify a potential change in short-term trends due to a fall in market breadth across equities, credit, FX and commodities. When market diversity falls, it implies either buyers or sellers are dominating, leading to a rapid rise or fall in asset prices. This is usually unsustainable and is likely to be followed by a slowdown or a reversal. Our diversity indicator is based on a statistical index called fractal dimension; a value below 1.25 serves as a guideline that prices are rising or falling too fast.
Where is diversity falling or rising this month?
It is another uneventful month since we flagged for reversal opportunities in equities in July. Price trends in broad equities remain weak but not lop-sided in a way that indicates stretched market positioning. We see similar situations in bonds and currencies. The latter has a narrower market diversity compared with last month due to the recent USD rally, but they remain well above the threshold of our diversity indicator.
Most equity markets we tracked have traded flat so far in Q3. Japan and UK equities were the only exceptions as they generated sizeable returns of 5.7% and 3.5%, respectively, since June. Their market diversity is also far healthier than the levels we typically look out for reversal risks. Meanwhile, price action in the US IT sector remains weak. This weakness is not considered extreme, and it will require a longer and deeper sell-off before our diversity indicator starts to flag for oversold conditions.
Fig. 28 Average market diversity score by asset class
Diversity of bonds has risen steeply
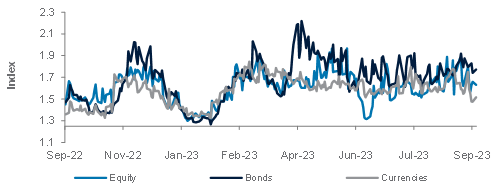
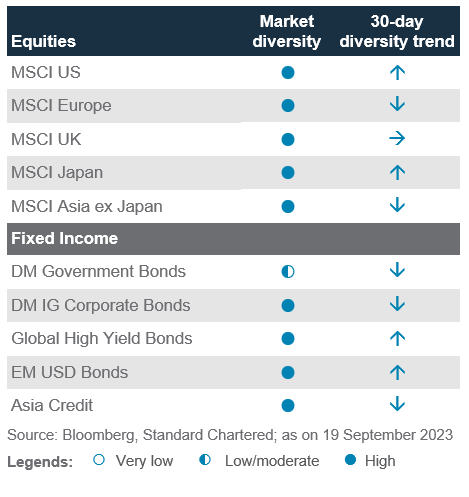
Fig. 29 Percentage of assets with diversity score <1.25
No assets showing reversal risks
Diversity for bond markets remains high in general. The lowest diversity is spotted in DM sovereign bonds at 1.44. They had the poorest performance since June (-2.8%) due to their negative sensitivity to bond yields. We recommend keeping an eye out for DM sovereign bonds given its diversity is declining steeply towards the 1.25 threshold. On the other end of the spectrum, EM USD bonds have the highest diversity at 2.18 due to its lack of clear direction.
In currencies, broad USD strength has resulted in narrower diversity across the board. The CNH, JPY, EUR and AUD have all depreciated against the USD by 2.2%, 2.9%, 3.8% and 4.2% respectively. We recommend keeping an eye out for AUD/USD, especially for a potential reversal should further weakness causes its diversity to worsen from current 1.36 to below 1.25. A hawkish Fed for the remaining FOMC meetings this year could also open up similar opportunities in other currencies when their market diversity falls below 1.25.
Fig. 30 Diversity across key assets
Performance Review
Foundation: Asset allocation summary
Performance of our calls
Fig. 31 Summary of our 2023 calls outlook-to-date
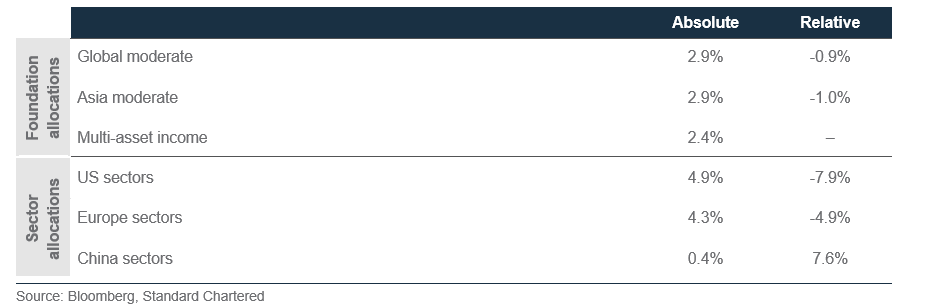
Performance measured from 15 December 2022 or when the call was opened, to 21 September 2023 or when the view was closed.
Past performance is not an indication of future performance. There is no assurance, representation or prediction given as to any results or returns that would actually be achieved in a transaction based on any historical data.
‘Absolute’ represents the simple absolute return. ‘Relative’ tracks our Tactical Asset Allocations vs. our Strategic Asset Allocation, or if a relative measure was specified in individual themes.
Global moderate and Asia moderate comprise our Tactical Asset Allocations as described in the Global Market Outlook publications. Broad asset class allocations are represented by MSCI AC World, FTSE Non-MBS WorldBIG Index, Bloomberg commodities ex-agriculture & livestock, HFRX total return and Bloomberg U.S. Treasury Bills: 1-3 Months Index. Equity allocations are represented by MSCI USA, EMU, UK, Japan, Asia ex-Japan and Other EM total return indices. Bond allocations are represented by FTSE WorldBig Government Index, FTSE WorldBig Corp Index, J.P. Morgan EMBI Global Diversified, EM Local, Asia Credit Index and Bloomberg Global High Yield indices.
Equity sector allocations are represented by MSCI USA sector indices, MSCI Europe sector indices and MSCI China sector indices, based on total returns. In our Multi-Asset Income allocation, bond allocations are represented by Bloomberg Global High Yield Index, S&P Global Leveraged Loan Index, J.P. Morgan EMBI Global Diversified, EM Local, Asia Credit and Asia Credit Index Non- Investment Grade, FTSE WorldBig Corp Index and FTSE WorldBig Government Index and Bloomberg US Agency CMBS Agg Eligible Index. Equity allocations are represented by MSCI North America, AC Europe, AC Asia ex-Japan High Dividend Yield Index and MSCI World Core Infrastructure Index. Non-core allocations are represented by Chicago Board Options Exchange S&P 500 BuyWrite Index and Barclays Global Contingent Capital Index Value Unhedged USD.
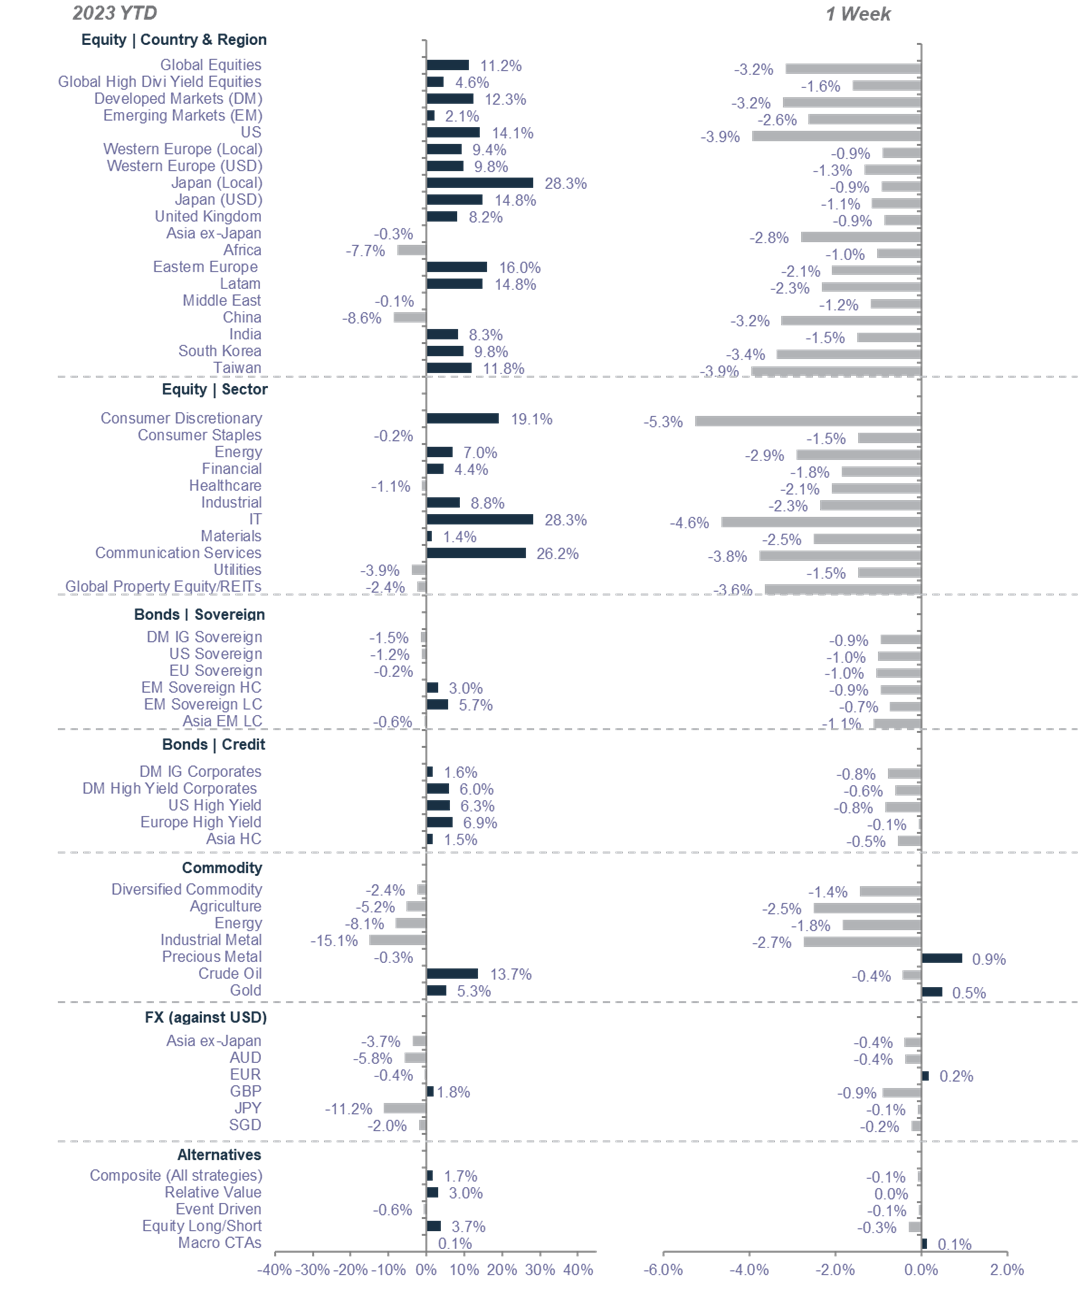
Market performance summary
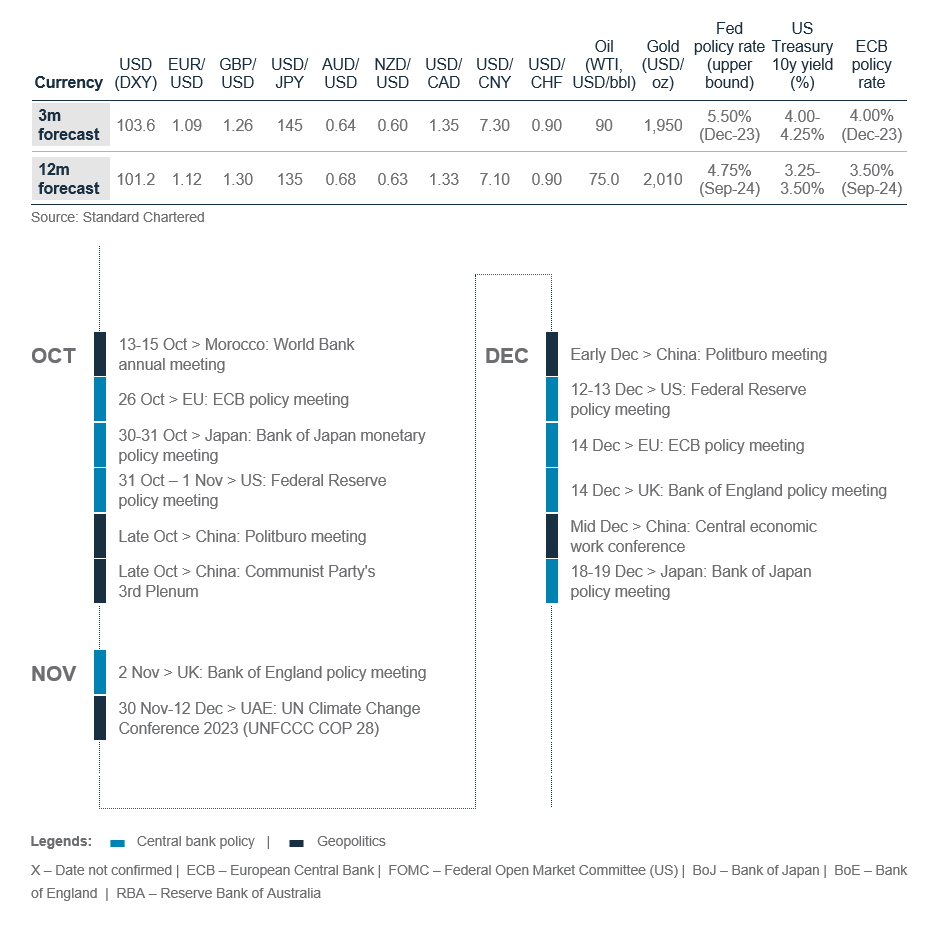
Our key forecasts and calendar events
For more CIO Office insights

Explanatory notes
1. The figures on page 5 show allocations for a moderate risk profile only – different risk profiles may produce significantly different asset allocation results. Page 6 is only an example, provided for general information only and they do not constitute investment advice, an offer, recommendation or solicitation. They do not take into account the specific investment objectives, needs or risk tolerances of a particular person or class of persons and they have not been prepared for any particular person or class of persons.
2. Contingent Convertibles are complex financial instruments and are not a suitable or appropriate investment for all investors. This document is not an offer to sell or an invitation to buy any securities or any beneficial interests therein. Contingent convertible securities are not intended to be sold and should not be sold to retail clients in the European Economic Area (EEA) (each as defined in the Policy Statement on the Restrictions on the Retail Distribution of Regulatory Capital Instruments (Feedback to CP14/23 and Final Rules) (“Policy Statement”), read together with the Product Intervention (Contingent Convertible Instruments and Mutual Society Shares) Instrument 2015 (“Instrument”, and together with the Policy Statement, the “Permanent Marketing Restrictions”), which were published by the United Kingdom’s Financial Conduct Authority in June 2015), other than in circumstances that do not give rise to a contravention of the Permanent Marketing Restrictions.
Disclosure
This document is confidential and may also be privileged. If you are not the intended recipient, please destroy all copies and notify the sender immediately. This document is being distributed for general information only and is subject to the relevant disclaimers available at our Standard Chartered website under Regulatory disclosures. It is not and does not constitute research material, independent research, an offer, recommendation or solicitation to enter into any transaction or adopt any hedging, trading or investment strategy, in relation to any securities or other financial instruments. This document is for general evaluation only. It does not take into account the specific investment objectives, financial situation or particular needs of any particular person or class of persons and it has not been prepared for any particular person or class of persons. You should not rely on any contents of this document in making any investment decisions. Before making any investment, you should carefully read the relevant offering documents and seek independent legal, tax and regulatory advice. In particular, we recommend you to seek advice regarding the suitability of the investment product, taking into account your specific investment objectives, financial situation or particular needs, before you make a commitment to purchase the investment product. Opinions, projections and estimates are solely those of SC at the date of this document and subject to change without notice. Past performance is not indicative of future results and no representation or warranty is made regarding future performance. The value of investments, and the income from them, can go down as well as up, and you may not recover the amount of your original investment. You are not certain to make a profit and may lose money. Any forecast contained herein as to likely future movements in rates or prices or likely future events or occurrences constitutes an opinion only and is not indicative of actual future movements in rates or prices or actual future events or occurrences (as the case may be). This document must not be forwarded or otherwise made available to any other person without the express written consent of the Standard Chartered Group (as defined below). Standard Chartered Bank is incorporated in England with limited liability by Royal Charter 1853 Reference Number ZC18. The Principal Office of the Company is situated in England at 1 Basinghall Avenue, London, EC2V 5DD. Standard Chartered Bank is authorised by the Prudential Regulation Authority and regulated by the Financial Conduct Authority and Prudential Regulation Authority. Standard Chartered PLC, the ultimate parent company of Standard Chartered Bank, together with its subsidiaries and affiliates (including each branch or representative office), form the Standard Chartered Group. Standard Chartered Private Bank is the private banking division of Standard Chartered. Private banking activities may be carried out internationally by different legal entities and affiliates within the Standard Chartered Group (each an “SC Group Entity”) according to local regulatory requirements. Not all products and services are provided by all branches, subsidiaries and affiliates within the Standard Chartered Group. Some of the SC Group Entities only act as representatives of Standard Chartered Private Bank and may not be able to offer products and services or offer advice to clients.
Copyright © 2025, Accounting Research & Analytics, LLC d/b/a CFRA (and its affiliates, as applicable). Reproduction of content provided by CFRA in any form is prohibited except with the prior written permission of CFRA. CFRA content is not investment advice and a reference to or observation concerning a security or investment provided in the CFRA SERVICES is not a recommendation to buy, sell or hold such investment or security or make any other investment decisions. The CFRA content contains opinions of CFRA based upon publicly-available information that CFRA believes to be reliable and the opinions are subject to change without notice. This analysis has not been submitted to, nor received approval from, the United States Securities and Exchange Commission or any other regulatory body. While CFRA exercised due care in compiling this analysis, CFRA, ITS THIRD-PARTY SUPPLIERS, AND ALL RELATED ENTITIES SPECIFICALLY DISCLAIM ALL WARRANTIES, EXPRESS OR IMPLIED, INCLUDING, BUT NOT LIMITED TO, ANY WARRANTIES OF MERCHANTABILITY OR FITNESS FOR A PARTICULAR PURPOSE OR USE, to the full extent permitted by law, regarding the accuracy, completeness, or usefulness of this information and assumes no liability with respect to the consequences of relying on this information for investment or other purposes. No content provided by CFRA (including ratings, credit-related analyses and data, valuations, model, software or other application or output therefrom) or any part thereof may be modified, reverse engineered, reproduced or distributed in any form by any means, or stored in a database or retrieval system, without the prior written permission of CFRA, and such content shall not be used for any unlawful or unauthorized purposes. CFRA and any third-party providers, as well as their directors, officers, shareholders, employees or agents do not guarantee the accuracy, completeness, timeliness or availability of such content. In no event shall CFRA, its affiliates, or their third-party suppliers be liable for any direct, indirect, special, or consequential damages, costs, expenses, legal fees, or losses (including lost income or lost profit and opportunity costs) in connection with a subscriber’s, subscriber’s customer’s, or other’s use of CFRA’s content.
Market Abuse Regulation (MAR) Disclaimer
Banking activities may be carried out internationally by different branches, subsidiaries and affiliates within the Standard Chartered Group according to local regulatory requirements. Opinions may contain outright “buy”, “sell”, “hold” or other opinions. The time horizon of this opinion is dependent on prevailing market conditions and there is no planned frequency for updates to the opinion. This opinion is not independent of Standard Chartered Group’s trading strategies or positions. Standard Chartered Group and/or its affiliates or its respective officers, directors, employee benefit programmes or employees, including persons involved in the preparation or issuance of this document may at any time, to the extent permitted by applicable law and/or regulation, be long or short any securities or financial instruments referred to in this document or have material interest in any such securities or related investments. Therefore, it is possible, and you should assume, that Standard Chartered Group has a material interest in one or more of the financial instruments mentioned herein. Please refer to our Standard Chartered website under Regulatory disclosures for more detailed disclosures, including past opinions/ recommendations in the last 12 months and conflict of interests, as well as disclaimers. A covering strategist may have a financial interest in the debt or equity securities of this company/issuer. All covering strategist are licensed to provide investment recommendations under Monetary Authority of Singapore or Hong Kong Monetary Authority. This document must not be forwarded or otherwise made available to any other person without the express written consent of Standard Chartered Group.
Sustainable Investments
Any ESG data used or referred to has been provided by Morningstar, Sustainalytics, MSCI or Bloomberg. Refer to 1) Morningstar website under Sustainable Investing, 2) Sustainalytics website under ESG Risk Ratings, 3) MCSI website under ESG Business Involvement Screening Research and 4) Bloomberg green, social & sustainability bonds guide for more information. The ESG data is as at the date of publication based on data provided, is for informational purpose only and is not warranted to be complete, timely, accurate or suitable for a particular purpose, and it may be subject to change. Sustainable Investments (SI): This refers to funds that have been classified as ‘Sustainable Investments’ by Morningstar. SI funds have explicitly stated in their prospectus and regulatory filings that they either incorporate ESG factors into the investment process or have a thematic focus on the environment, gender diversity, low carbon, renewable energy, water or community development. For equity, it refers to shares/stocks issued by companies with Sustainalytics ESG Risk Rating of Low/Negligible. For bonds, it refers to debt instruments issued by issuers with Sustainalytics ESG Risk Rating of Low/Negligible, and/or those being certified green, social, sustainable bonds by Bloomberg. For structured products, it refers to products that are issued by any issuer who has a Sustainable Finance framework that aligns with Standard Chartered’s Green and Sustainable Product Framework, with underlying assets that are part of the Sustainable Investment universe or separately approved by Standard Chartered’s Sustainable Finance Governance Committee. Sustainalytics ESG risk ratings shown are factual and are not an indicator that the product is classified or marketed as “green”, “sustainable” or similar under any particular classification system or framework.
Country/Market Specific Disclosures
Botswana: This document is being distributed in Botswana by, and is attributable to, Standard Chartered Bank Botswana Limited which is a financial institution licensed under the Section 6 of the Banking Act CAP 46.04 and is listed in the Botswana Stock Exchange. Brunei Darussalam: This document is being distributed in Brunei Darussalam by, and is attributable to, Standard Chartered Bank (Brunei Branch) | Registration Number RFC/61 and Standard Chartered Securities (B) Sdn Bhd | Registration Number RC20001003. Standard Chartered Bank is incorporated in England with limited liability by Royal Charter 1853 Reference Number ZC18. Standard Chartered Securities (B) Sdn Bhd is a limited liability company registered with the Registry of Companies with Registration Number RC20001003 and licensed by Brunei Darussalam Central Bank as a Capital Markets Service License Holder with License Number BDCB/R/CMU/S3-CL and it is authorised to conduct Islamic investment business through an Islamic window. China Mainland: This document is being distributed in China by, and is attributable to, Standard Chartered Bank (China) Limited which is mainly regulated by National Financial Regulatory Administration (NFRA), State Administration of Foreign Exchange (SAFE), and People’s Bank of China (PBOC). Hong Kong: In Hong Kong, this document, except for any portion advising on or facilitating any decision on futures contracts trading, is distributed by Standard Chartered Bank (Hong Kong) Limited (“SCBHK”), a subsidiary of Standard Chartered PLC. SCBHK has its registered address at 32/F, Standard Chartered Bank Building, 4-4A Des Voeux Road Central, Hong Kong and is regulated by the Hong Kong Monetary Authority and registered with the Securities and Futures Commission (“SFC”) to carry on Type 1 (dealing in securities), Type 4 (advising on securities), Type 6 (advising on corporate finance) and Type 9 (asset management) regulated activity under the Securities and Futures Ordinance (Cap. 571) (“SFO”) (CE No. AJI614). The contents of this document have not been reviewed by any regulatory authority in Hong Kong and you are advised to exercise caution in relation to any offer set out herein. If you are in doubt about any of the contents of this document, you should obtain independent professional advice. Any product named herein may not be offered or sold in Hong Kong by means of any document at any time other than to “professional investors” as defined in the SFO and any rules made under that ordinance. In addition, this document may not be issued or possessed for the purposes of issue, whether in Hong Kong or elsewhere, and any interests may not be disposed of, to any person unless such person is outside Hong Kong or is a “professional investor” as defined in the SFO and any rules made under that ordinance, or as otherwise may be permitted by that ordinance. In Hong Kong, Standard Chartered Private Bank is the private banking division of SCBHK, a subsidiary of Standard Chartered PLC. Ghana: Standard Chartered Bank Ghana Limited accepts no liability and will not be liable for any loss or damage arising directly or indirectly (including special, incidental or consequential loss or damage) from your use of these documents. Past performance is not indicative of future results and no representation or warranty is made regarding future performance. You should seek advice from a financial adviser on the suitability of an investment for you, taking into account these factors before making a commitment to invest in an investment. To unsubscribe from receiving further updates, please send an email to feedback.ghana@sc.com. Please do not reply to this email. Call our Priority Banking on 0302610750 for any questions or service queries. You are advised not to send any confidential and/or important information to Standard Chartered via e-mail, as Standard Chartered makes no representations or warranties as to the security or accuracy of any information transmitted via e-mail. Standard Chartered shall not be responsible for any loss or damage suffered by you arising from your decision to use e-mail to communicate with the Bank. India: This document is being distributed in India by Standard Chartered in its capacity as a distributor of mutual funds and referrer of any other third party financial products. Standard Chartered does not offer any ‘Investment Advice’ as defined in the Securities and Exchange Board of India (Investment Advisers) Regulations, 2013 or otherwise. Services/products related securities business offered by Standard Charted are not intended for any person, who is a resident of any jurisdiction, the laws of which imposes prohibition on soliciting the securities business in that jurisdiction without going through the registration requirements and/or prohibit the use of any information contained in this document. Indonesia: This document is being distributed in Indonesia by Standard Chartered Bank, Indonesia branch, which is a financial institution licensed and supervised by Otoritas Jasa Keuangan (Financial Service Authority) and Bank Indonesia. Jersey: In Jersey, Standard Chartered Private Bank is the Registered Business Name of the Jersey Branch of Standard Chartered Bank. The Jersey Branch of Standard Chartered Bank is regulated by the Jersey Financial Services Commission. Copies of the latest audited accounts of Standard Chartered Bank are available from its principal place of business in Jersey: PO Box 80, 15 Castle Street, St Helier, Jersey JE4 8PT. Standard Chartered Bank is incorporated in England with limited liability by Royal Charter in 1853 Reference Number ZC 18. The Principal Office of the Company is situated in England at 1 Basinghall Avenue, London, EC2V 5DD. Standard Chartered Bank is authorised by the Prudential Regulation Authority and regulated by the Financial Conduct Authority and Prudential Regulation Authority. The Jersey Branch of Standard Chartered Bank is also an authorised financial services provider under license number 44946 issued by the Financial Sector Conduct Authority of the Republic of South Africa. Jersey is not part of the United Kingdom and all business transacted with Standard Chartered Bank, Jersey Branch and other SC Group Entity outside of the United Kingdom, are not subject to some or any of the investor protection and compensation schemes available under United Kingdom law. Kenya: This document is being distributed in Kenya by and is attributable to Standard Chartered Bank Kenya Limited. Investment Products and Services are distributed by Standard Chartered Investment Services Limited, a wholly owned subsidiary of Standard Chartered Bank Kenya Limited that is licensed by the Capital Markets Authority in Kenya, as a Fund Manager. Standard Chartered Bank Kenya Limited is regulated by the Central Bank of Kenya. Malaysia: This document is being distributed in Malaysia by Standard Chartered Bank Malaysia Berhad (“SCBMB”). Recipients in Malaysia should contact SCBMB in relation to any matters arising from, or in connection with, this document. This document has not been reviewed by the Securities Commission Malaysia. The product lodgement, registration, submission or approval by the Securities Commission of Malaysia does not amount to nor indicate recommendation or endorsement of the product, service or promotional activity. Investment products are not deposits and are not obligations of, not guaranteed by, and not protected by SCBMB or any of the affiliates or subsidiaries, or by Perbadanan Insurans Deposit Malaysia, any government or insurance agency. Investment products are subject to investment risks, including the possible loss of the principal amount invested. SCBMB expressly disclaim any liability and responsibility for any loss arising directly or indirectly (including special, incidental or consequential loss or damage) arising from the financial losses of the Investment Products due to market condition. Nigeria: This document is being distributed in Nigeria by Standard Chartered Bank Nigeria Limited (SCB Nigeria), a bank duly licensed and regulated by the Central Bank of Nigeria. SCB Nigeria accepts no liability for any loss or damage arising directly or indirectly (including special, incidental or consequential loss or damage) from your use of these documents. You should seek advice from a financial adviser on the suitability of an investment for you, taking into account these factors before making a commitment to invest in an investment. To unsubscribe from receiving further updates, please send an email to clientcare.ng@sc.com requesting to be removed from our mailing list. Please do not reply to this email. Call our Priority Banking on 02 012772514 for any questions or service queries. SCB Nigeria shall not be responsible for any loss or damage arising from your decision to send confidential and/or important information to Standard Chartered via e-mail. SCB Nigeria makes no representations or warranties as to the security or accuracy of any information transmitted via e-mail. Pakistan: This document is being distributed in Pakistan by, and attributable to Standard Chartered Bank (Pakistan) Limited having its registered office at PO Box 5556, I.I Chundrigar Road Karachi, which is a banking company registered with State Bank of Pakistan under Banking Companies Ordinance 1962 and is also having licensed issued by Securities & Exchange Commission of Pakistan for Security Advisors. Standard Chartered Bank (Pakistan) Limited acts as a distributor of mutual funds and referrer of other third-party financial products. Singapore: This document is being distributed in Singapore by, and is attributable to, Standard Chartered Bank (Singapore) Limited (Registration No. 201224747C/ GST Group Registration No. MR-8500053-0, “SCBSL”). Recipients in Singapore should contact SCBSL in relation to any matters arising from, or in connection with, this document. SCBSL is an indirect wholly owned subsidiary of Standard Chartered Bank and is licensed to conduct banking business in Singapore under the Singapore Banking Act, 1970. Standard Chartered Private Bank is the private banking division of SCBSL. IN RELATION TO ANY SECURITY OR SECURITIES-BASED DERIVATIVES CONTRACT REFERRED TO IN THIS DOCUMENT, THIS DOCUMENT, TOGETHER WITH THE ISSUER DOCUMENTATION, SHALL BE DEEMED AN INFORMATION MEMORANDUM (AS DEFINED IN SECTION 275 OF THE SECURITIES AND FUTURES ACT, 2001 (“SFA”)). THIS DOCUMENT IS INTENDED FOR DISTRIBUTION TO ACCREDITED INVESTORS, AS DEFINED IN SECTION 4A(1)(a) OF THE SFA, OR ON THE BASIS THAT THE SECURITY OR SECURITIES-BASED DERIVATIVES CONTRACT MAY ONLY BE ACQUIRED AT A CONSIDERATION OF NOT LESS THAN S$200,000 (OR ITS EQUIVALENT IN A FOREIGN CURRENCY) FOR EACH TRANSACTION. Further, in relation to any security or securities-based derivatives contract, neither this document nor the Issuer Documentation has been registered as a prospectus with the Monetary Authority of Singapore under the SFA. Accordingly, this document and any other document or material in connection with the offer or sale, or invitation for subscription or purchase, of the product may not be circulated or distributed, nor may the product be offered or sold, or be made the subject of an invitation for subscription or purchase, whether directly or indirectly, to persons other than a relevant person pursuant to section 275(1) of the SFA, or any person pursuant to section 275(1A) of the SFA, and in accordance with the conditions specified in section 275 of the SFA, or pursuant to, and in accordance with the conditions of, any other applicable provision of the SFA. In relation to any collective investment schemes referred to in this document, this document is for general information purposes only and is not an offering document or prospectus (as defined in the SFA). This document is not, nor is it intended to be (i) an offer or solicitation of an offer to buy or sell any capital markets product; or (ii) an advertisement of an offer or intended offer of any capital markets product. Deposit Insurance Scheme: Singapore dollar deposits of non-bank depositors are insured by the Singapore Deposit Insurance Corporation, for up to S$100,000 in aggregate per depositor per Scheme member by law. Foreign currency deposits, dual currency investments, structured deposits and other investment products are not insured. This advertisement has not been reviewed by the Monetary Authority of Singapore. Taiwan: SC Group Entity or Standard Chartered Bank (Taiwan) Limited (“SCB (Taiwan)”) may be involved in the financial instruments contained herein or other related financial instruments. The author of this document may have discussed the information contained herein with other employees or agents of SC or SCB (Taiwan). The author and the above-mentioned employees of SC or SCB (Taiwan) may have taken related actions in respect of the information involved (including communication with customers of SC or SCB (Taiwan) as to the information contained herein). The opinions contained in this document may change, or differ from the opinions of employees of SC or SCB (Taiwan). SC and SCB (Taiwan) will not provide any notice of any changes to or differences between the above-mentioned opinions. This document may cover companies with which SC or SCB (Taiwan) seeks to do business at times and issuers of financial instruments. Therefore, investors should understand that the information contained herein may serve as specific purposes as a result of conflict of interests of SC or SCB (Taiwan). SC, SCB (Taiwan), the employees (including those who have discussions with the author) or customers of SC or SCB (Taiwan) may have an interest in the products, related financial instruments or related derivative financial products contained herein; invest in those products at various prices and on different market conditions; have different or conflicting interests in those products. The potential impacts include market makers’ related activities, such as dealing, investment, acting as agents, or performing financial or consulting services in relation to any of the products referred to in this document. UAE: DIFC – Standard Chartered Bank is incorporated in England with limited liability by Royal Charter 1853 Reference Number ZC18.The Principal Office of the Company is situated in England at 1 Basinghall Avenue, London, EC2V 5DD. Standard Chartered Bank is authorised by the Prudential Regulation Authority and regulated by the Financial Conduct Authority and Prudential Regulation Authority. Standard Chartered Bank, Dubai International Financial Centre having its offices at Dubai International Financial Centre, Building 1, Gate Precinct, P.O. Box 999, Dubai, UAE is a branch of Standard Chartered Bank and is regulated by the Dubai Financial Services Authority (“DFSA”). This document is intended for use only by Professional Clients and is not directed at Retail Clients as defined by the DFSA Rulebook. In the DIFC we are authorised to provide financial services only to clients who qualify as Professional Clients and Market Counterparties and not to Retail Clients. As a Professional Client you will not be given the higher retail client protection and compensation rights and if you use your right to be classified as a Retail Client we will be unable to provide financial services and products to you as we do not hold the required license to undertake such activities. For Islamic transactions, we are acting under the supervision of our Shariah Supervisory Committee. Relevant information on our Shariah Supervisory Committee is currently available on the Standard Chartered Bank website in the Islamic banking section. For residents of the UAE – Standard Chartered Bank UAE does not provide financial analysis or consultation services in or into the UAE within the meaning of UAE Securities and Commodities Authority Decision No. 48/r of 2008 concerning financial consultation and financial analysis. Uganda: Our Investment products and services are distributed by Standard Chartered Bank Uganda Limited, which is licensed by the Capital Markets Authority as an investment adviser. United Kingdom: In the UK, Standard Chartered Bank is authorised by the Prudential Regulation Authority and regulated by the Financial Conduct Authority and Prudential Regulation Authority. This communication has been approved by Standard Chartered Bank for the purposes of Section 21 (2) (b) of the United Kingdom’s Financial Services and Markets Act 2000 (“FSMA”) as amended in 2010 and 2012 only. Standard Chartered Bank (trading as Standard Chartered Private Bank) is also an authorised financial services provider (license number 45747) in terms of the South African Financial Advisory and Intermediary Services Act, 2002. The Materials have not been prepared in accordance with UK legal requirements designed to promote the independence of investment research, and that it is not subject to any prohibition on dealing ahead of the dissemination of investment research. Vietnam: This document is being distributed in Vietnam by, and is attributable to, Standard Chartered Bank (Vietnam) Limited which is mainly regulated by State Bank of Vietnam (SBV). Recipients in Vietnam should contact Standard Chartered Bank (Vietnam) Limited for any queries regarding any content of this document. Zambia: This document is distributed by Standard Chartered Bank Zambia Plc, a company incorporated in Zambia and registered as a commercial bank and licensed by the Bank of Zambia under the Banking and Financial Services Act Chapter 387 of the Laws of Zambia.