31 October 2025
Global Market Outlook
Global Market Outlook
Staying constructive into year-end
The glass-half-full narrative is set to hold in the final months of 2025. Fed cuts give us confidence the US economy will achieve a soft landing, though trade policy and inflation remain key risks. The USD rebound should prove temporary.
The recent pullback in gold prices reopens the window to add. We remain Overweight, given long-term diversification demand remains robust. The ongoing pullback offers an opportunity to add.
Remain Overweight equities into year-end, preferring stocks over credit. Fed cuts and robust earnings expectations should ultimately lift stocks into year-end. We continue to prefer Asia ex-Japan and US equities and Emerging Market local currency bonds.
Is gold overvalued after the recent rally?
Where are the short-term tactical opportunities?
Are your quant models still positive on risk assets?
Strategy
Investment strategy and key themes
|
|
||||
|

12m Foundation Overweights:
- Global equities, gold
- US, Asia ex-Japan equities
- Emerging Market (EM) local currency bonds
Opportunistic ideas – Equities
- Global gold miners*
- US tech^, pharma*, utilities*
- China non-financial high-dividend state-owned entities and Hang Seng Technology index
- Europe industrials
Sector Overweights:
- US: Tech, healthcare, utilities
- Europe: Healthcare, industrials, tech
- China: Tech, comm, discretionary
Opportunistic ideas – Bonds
- US Treasury Inflation-Protected Securities, short-duration HY
- Asia Investment Grade*
Staying constructive into year-end
- The glass-half-full narrative is set to hold in the final months of 2025. Fed cuts give us confidence the US economy will achieve a soft landing, though trade policy and inflation remain key risks. The USD rebound should prove temporary.
- The recent pullback in gold prices reopens the window to add. We remain Overweight, given long-term diversification demand remains robust. The ongoing pullback offers an opportunity to add.
- Remain Overweight equities into year-end, preferring stocks over credit. Fed cuts and robust earnings expectations should ultimately lift stocks into year-end. We continue to prefer Asia ex-Japan and US equities and EM local currency bonds.
Climbing the walls of worry
Seasonal weakness has been far from investors’ minds. Since the end of September, global equities have eked out positive gains, despite a minor mid-month wobble. Global bonds were largely flat even as US bond yields declined. Gold recorded positive full-month gains even after accounting for the sizeable drawdown in recent weeks.
Financial markets continue to view incoming data through a glass-half-full lens. An overview of recent macro data (using alternative private sector US data, given the government shutdown) suggests that growth data, particularly in the US, remains resilient. This is visible most so in PMI business surveys. This follows what is proving to be an increasingly extended US government shutdown and a resurgence in blow-hot-blow-cold trade tensions between the US and several key trading partners.
The likelihood of continued Fed cuts remains a cornerstone of our positive outlook for risk assets. US inflation expectations for the next one to two years continue to soften, opening greater room for policymakers to cut rates. We now assign about a 60% chance of a soft landing and reduce our recession probability to 20%. Meanwhile, expectations of continued policy support in China have helped maintain optimism. On balance, we continue to expect policy support across most major economies to help lean against signs of slowing economic data, especially going into year-end, supporting our preference for equities over bonds and cash.
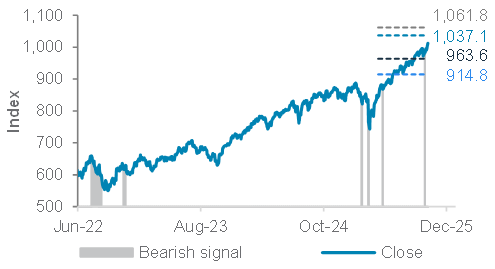
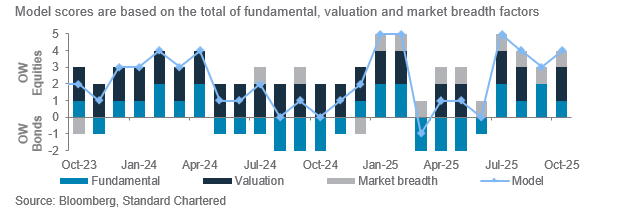
Fig. 1 Our short-term equity model is bullish on global equities, despite strong gains since April lows
Our quantitative stock-bond model; currently OW equities
A window to add gold?
One of the most notable market moves in recent weeks has been the sharp pullback in gold, which follows a dramatic rally following the early-September breakout.
We view this pullback as temporary and driven by a normalisation of excessively optimistic investor positioning. We believe the long-term drivers of gold remain in place – diversification demand, especially from central banks, is strong while gold also arguably offers some hedging characteristics in an environment where inflation remains a key concern. It is possible for the current positioning normalisation to take several weeks to fully play out. However, we firmly view this pullback as an opportunity to add, with technical support sitting at USD 3,945-4,060/oz. We expect gold to reach USD 4,500 in 12 months.
Pro-equities, but where?
The narrative around the near-term outlook for global stock markets going into year-end remains caught between the positivity of still-strong growth and Fed rate cuts, and the negativity of elevated valuations and a US labour market that continues to hang in the balance.
We remain positive. While optimistic investor positioning means the journey from today to year-end may be a more volatile one than we’ve experienced for much of this year, we continue to expect the direction to be positive. Strong earnings growth and positive earnings revisions remain a cornerstone of our view. Further Fed rate cuts are another factor that should offer support.
An overview of quantitative indicators supports this view. For global equities, our short-term quantitative model remains bullish, despite mid-month volatility. Our long-term stock-bond model remains unambiguously bullish due to supportive fundamentals, healthy market breadth and improved DM equity valuation after an early month pullback.
Our regional preferences remain unchanged – we are Overweight the US (led by strong economic and earnings growth) and Asia ex-Japan (led by policy easing and a weak
Fig. 2 Gold investor positioning unwind may extend near term, but we see this as a buying opportunity
Gold price vs. USD index (DXY, inverted)
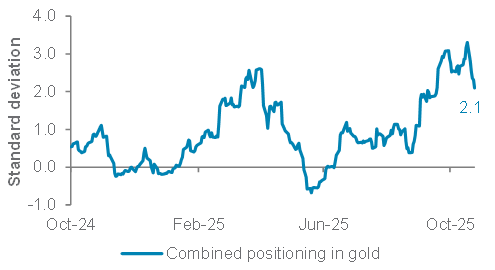
USD). We now also prefer equities (Overweight) to credit (Underweight). In an environment of elevated valuations across both asset classes, we prefer the relatively less constrained potential upside in equities over corporate bonds.
Trade and central bank policy are the two key risks. On the first, Trump recently offered us two examples (China and Canada) on how policy can change at short notice. However, recent history suggests that, ultimately, US policymakers will seek to achieve a compromise. On the second, markets are assuming the Fed will continue to cut rates and support growth. A hawkish surprise at the December Fed meeting would negatively surprise markets.
A brief USD rebound
The USD index (DXY) has fallen c.10% this year – one of the largest annual declines in history. We expect a temporary rebound in the final months of 2025 as one-sided expectations partly unwind and the bar for further USD-negative news rises. Having said that, we do not expect a return to prior trading ranges above 100 and expect any rallies to be firmly capped.
Looking beyond the next one to three months, though, we expect USD weakness to persist. US interest rates are likely to fall much more than those for other major currencies. Also, still-elevated valuations mean the USD is expected to weaken further once near-term upward pressures ease. This is one important reason why we remain Overweight on Asia ex-Japan equities and EM local currency bonds.
Rotating opportunistic trades
Within bonds, we take profit on our UK government bond trade after the sharp drop in bond yields as growth data continued to slow. We open a new opportunistic bullish idea on Asia IG bonds, which we expect to benefit from stable credit quality and gradually lower USD bond yields.
Within equities, we open a bullish idea on gold miners at current market prices to take advantage of the pullback in gold. We also open opportunistic bullish ideas in the US pharmaceutical sub-sector and the utilities sector to add some defensive growth.
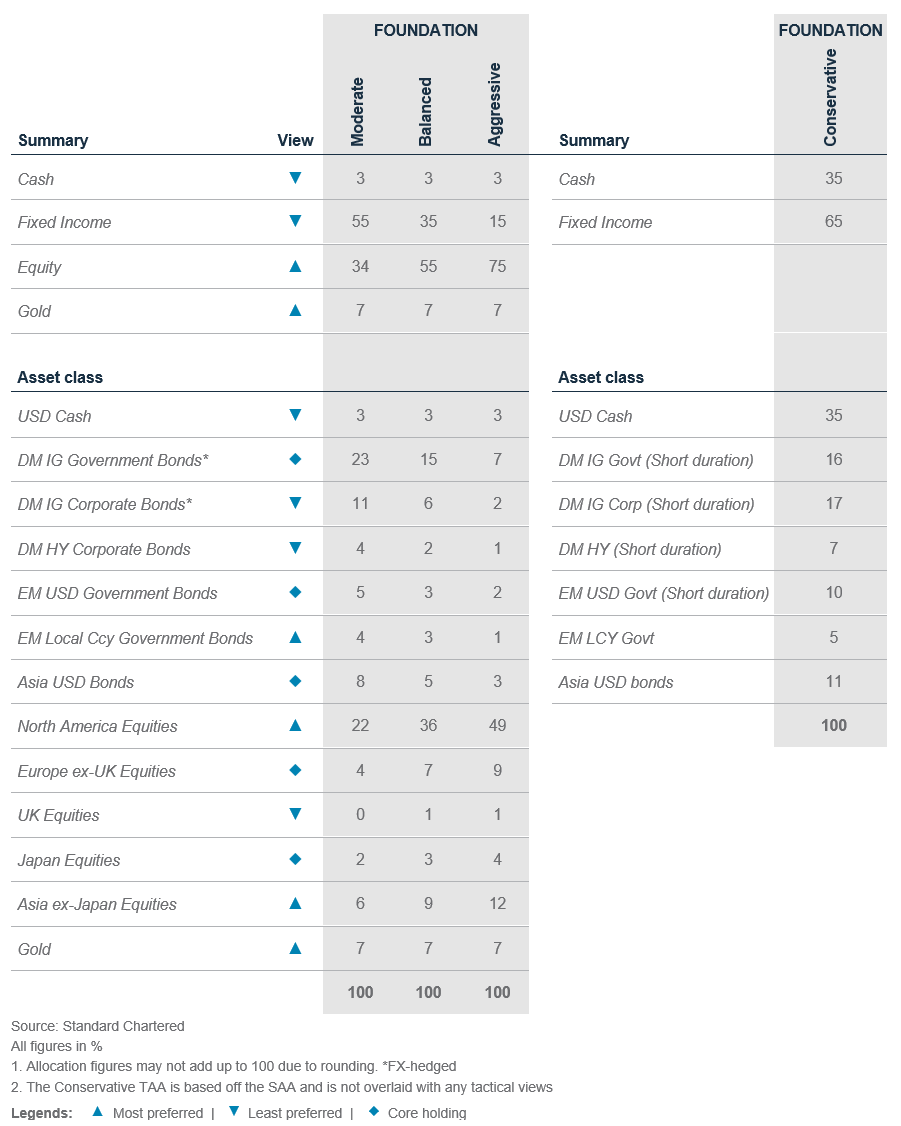
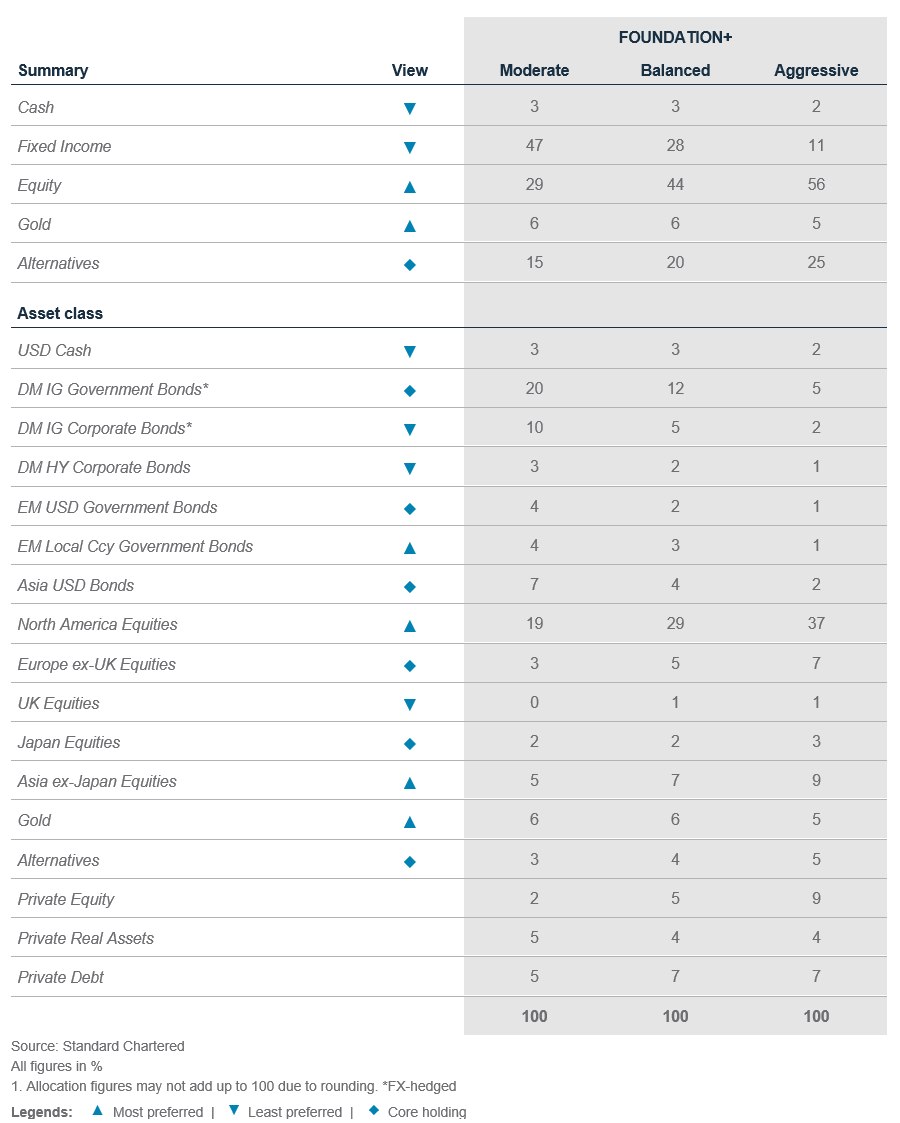
Foundation asset allocation models
The Foundation and Foundation+ models are allocations that you can use as the starting point for building a diversified investment portfolio. The Foundation model showcases a set of allocations focusing on traditional asset classes that are accessible to most investors, while the Foundation+ model includes allocations to private assets that may be accessible to investors in some jurisdictions, but not others.
Fig. 3 Foundation asset allocation for a balanced risk profile
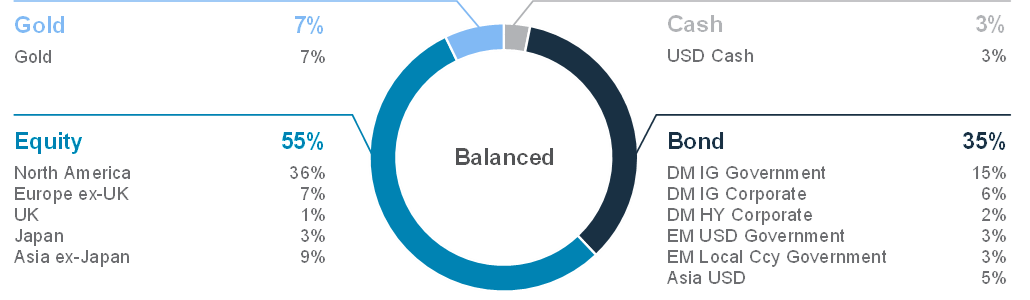
Fig. 4 Foundation+ asset allocation for a balanced risk profile
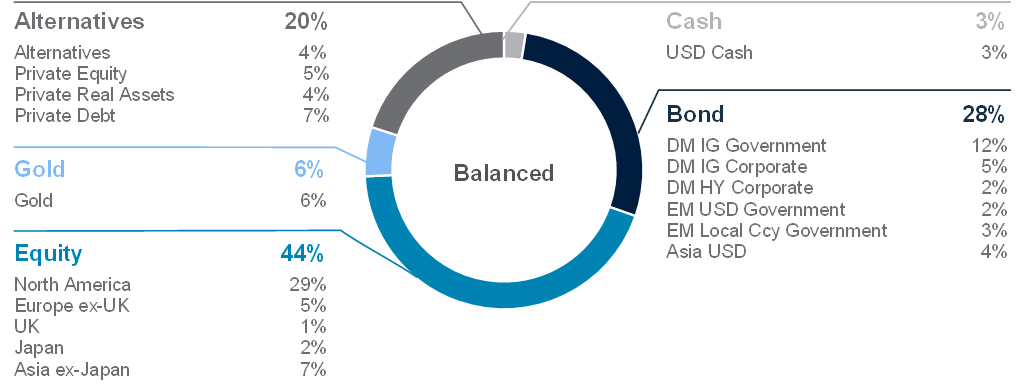
Fig. 5 Multi-asset income allocation for a moderate risk profile
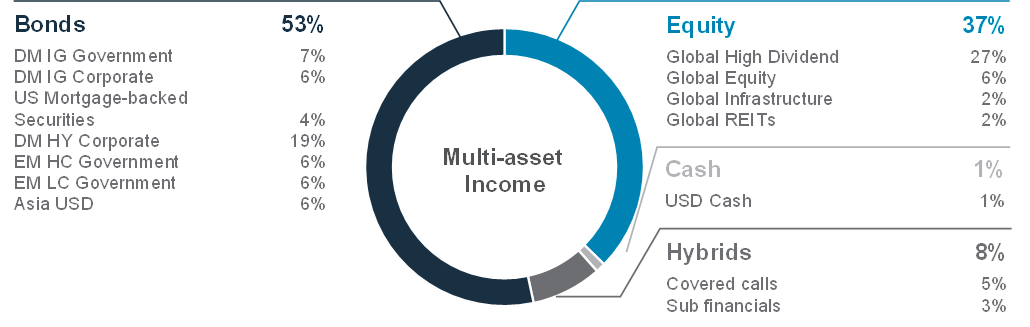
Source: Standard Chartered
Foundation: Our tactical asset allocation views
Fig. 6 Performance of our Foundation Allocations*
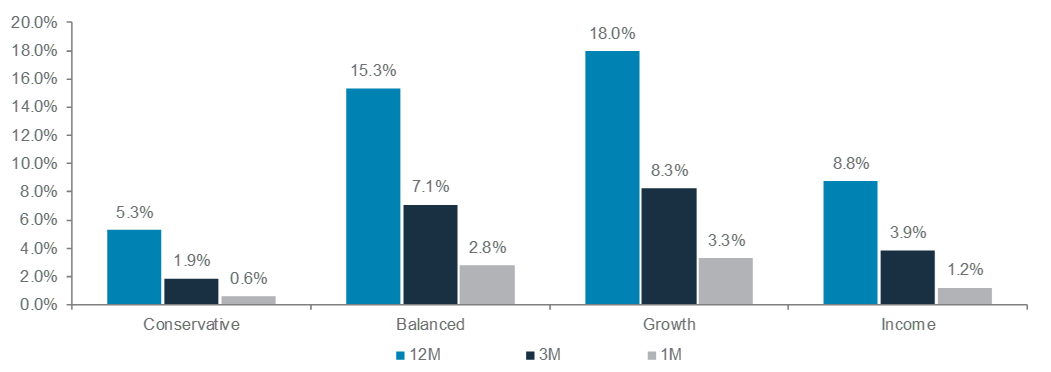
Source: Bloomberg, Standard Chartered; *12-month performance data from 29 October 2024 to 29 October 2025, 3-month performance from 29 July 2025 to 29 October 2025, 1-month performance from 29 September 2025 to 29 October 2025
Perspectives on key client questions
|
|
||||
Is gold overvalued after the recent rally?
Gold’s record-breaking rally, which has lifted prices by over 50% this year (20% since mid-August), has raised questions about whether the precious metal is overvalued. Although gold does not lend itself to traditional valuation measures, since holders do not earn regular income, some relative valuation metrics indicate room for further upside, despite near-term correction. We have raised our 3- and 12-month gold price targets to USD 4,300/oz and USD 4,500/oz. Our constructive stance is primarily driven by structural drivers and supported by cyclical factors in the next 6-12 months.
Structural drivers of the gold rally
The structural drivers of gold are threefold: a) Geopolitical uncertainty, which has led EMs to consistently boost their gold reserves in the past three years, especially after the US and EU decisions to freeze Russian central bank assets following the start of the Ukraine war in early 2022. The top three EM central bank gold holders – China, India and Russia – have 6.7%, 13% and 36% of their reserves in gold.
b) Concerns about expansionary fiscal policies worldwide, and US fiscal policy, after the passage of the US budget for the fiscal year started 1 Oct. The “One Big Beautiful Bill” is estimated by the Tax Policy Center to add US federal debt by USD 4.2tn, or 9% of GDP, by 2034, raising the risk of further USD weakness as the need to fund the deficits grows. In this case, gold is seen as an antidote to a weaker USD.
c) Increased doubts about the Fed’s independence after President Trump’s decision to fire Fed Governor Cook on 25 August (subsequently stayed by courts). Trump, who already has three allies in the seven-member Fed Board of Governors, will have a majority of allies on the Board if he successfully replaces Cook. Trump also plans to replace Fed Chair Powell when his term ends in May 2026, avowedly with a nominee willing to significantly cut interest rates despite US inflation remaining well above the Fed’s 2% target. Such a step could lead to a sharp USD depreciation.
Cyclical drivers for the next 6-12 months
Besides structural drivers, gold has cyclical support from three factors: a) Fed policy easing and falling real rates, turning gold more attractive: The Fed resumed rate cuts in September, after a nine-month pause, to support a slowing job market. It cut its rates again in October to 4.0%, despite core inflation remaining close to 3%. We expect the Fed to cut rates another 100bps by end-2026, dragging real yields lower.

Fig. 7 Gold, adjusted for inflation, currently trades at a level higher than the 1970s’ stagflation period
Inflation-adjusted gold price
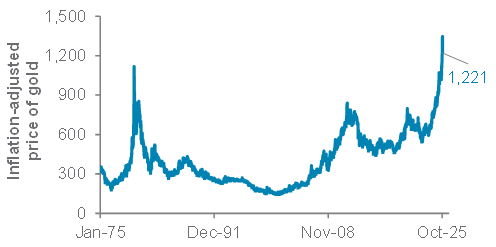
Fig. 8 However, gold trades at rock-bottom levels relative to US equities
Gold’s performance vs. the S&P500 (100 = Jan 1975)
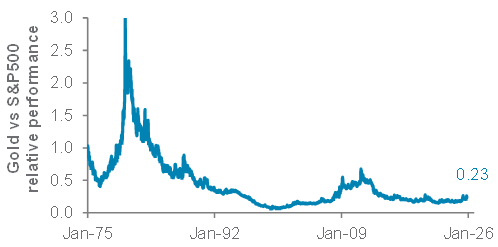
Source: Bloomberg, Standard Chartered
b) Seasonal demand from China ahead of the Lunar New Year. Jewellery accounts for half of global gold demand, with China and India accounting for over half of the world jewellery market. Seasonal demand typically picks up from the Indian festive season in September and runs until the Lunar New Year in January/February. While reports suggest India’s festive season saw a decline in volumes as buyers turned more price sensitive, overall value of gold sold hit new highs, with demand shifting to gold bars and coins and digital gold.
Fig. 9 Investor allocations to gold through exchange-traded funds are still below the 2020 peak
Total known ETF holdings of gold in volumes
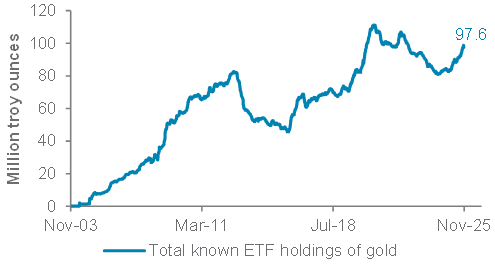
c) Rising demand for gold as an alternative investment. The nascent shift in Indian demand towards gold bars, coins, gold-backed ETFs and digital gold suggests gold’s rising role as an alternative investment. Among institutional investors, gold remains under-owned, with significant scope for upside.
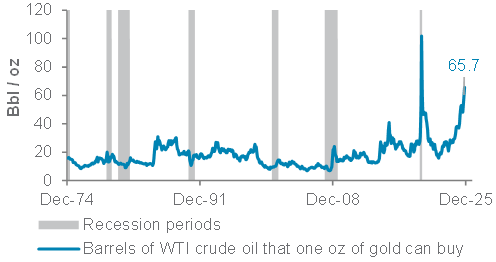
Fig. 10 Outside of the brief oil selloff during COVID, gold is priced at its highest vs. oil in at least 50 years
Barrels of WTI crude oil available for one oz of gold
How to value gold as an investment?
It is hard to value gold as a financial asset, given the lack of cash flows. However, we can assess gold’s worth in two ways:
a) Relative value terms: Measuring gold in inflation-adjusted terms shows the precious metal is priced today marginally higher than the peak of the stagflationary 1970s. Fig. 7 shows that gold displays its true worth in times of crises – eg, the 1970s stagflation, the 2007-08 Global Financial Crisis, the 2020 COVID pandemic and the latest geopolitical shock caused by the Russia-Ukraine conflict and Trump 2.0.
Nevertheless, Fig. 10 shows gold is expensive compared with crude oil. On balance, the above relative value assessment suggests gold is likely to hold its value as long as the world remains in a state of heightened policy uncertainty.
b) Asset allocation terms: Gold’s historically low correlation with other assets makes it one of the best portfolio diversifiers. For instance, gold delivered an average 22% real annualised return during stagflation periods since 1973, vs. -1.5% return on US equities. Also, gold is extremely inexpensive vs. US equities (Fig. 8), given the outperformance of stocks in the past 3 decades. Gold’s share of a typical portfolio would have plunged unless investors actively added gold over the years. Figs. 9 & 11 show investors remain underinvested in gold, with allocation through ETFs still below the 2020 peak. Our balanced strategy has a 7% allocation to gold.
Fig. 11 Gold has room to rise as a share of assets
Gold’s share of global equity market capitalisation and bond outstanding
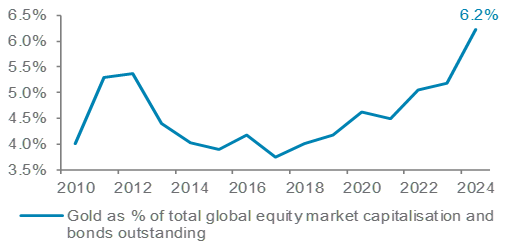
Source: FRED, BIS, World Bank, Bloomberg, Standard Chartered
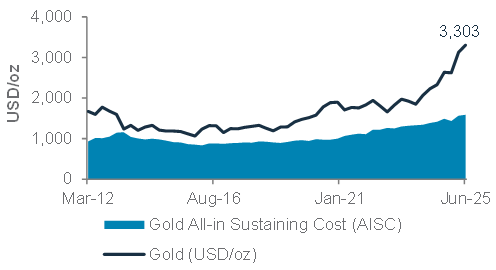
Conclusion: Based on the above review, while gold appears expensive in some relative value metrics, strategic and cyclical factors suggest the ongoing technical correction in gold is an opportunity for those underinvested in gold to build allocations towards desired targets. Investors looking for a high beta (more volatile) play on gold could consider gold miner equities as the sector benefits from exceptionally high profit margins, given the production cost of gold remains well below USD 2,000/oz. We are more cautious on silver, though, and will re-evaluate if prices drop to USD 40/oz.
Fig. 12 Gold miners are benefitting from high profit margins, given the low production cost vs. sale prices
Gold prices vs. all-in production costs. As of June 2025.
Macro overview
Our macroeconomic outlook and key questions
|
Our view
Core scenario (soft landing, 60% probability): We raise the probability of a US economic soft landing from 55% amid reduced downside risk. The resumption of Fed rate cuts, easing trade tensions and a mildly stimulative budget should offset the negative impact of tariffs. We expect a 25bps Fed rate cut to 3.75% in December and further 75bps of cuts to 3.0% by end-2026 to support a slowing US job market. The ECB is likely to cut its deposit rate by another 25bps to 1.75bps and then hold through end-2026 as the German fiscal stimulus kicks in. Meanwhile, policy easing in China is likely to support hi-tech and consumption-led growth.
Downside risk (hard landing, 20% probability): We cut the probability of a US hard landing from 30% as Fed rate cuts ease financial conditions. A prolonged US government shutdown is a near-term risk. Also, US tariffs hurting either corporate margins or consumption remains a key risk. US bond and USD selloffs due to concerns about debt or Fed independence are other risks.
Upside risk (no landing, 20% probability): We raise the probability of a no landing from 15%. Fed rate cuts, US trade deals and a global fiscal stimulus could revive the world’s three biggest economic blocs. US deregulation and tax incentives could help revive private sector “animal spirits”. A Russia-Ukraine peace deal and/or US-China “grand bargain” could provide further upside.
Key chart
Business confidence remains resilient across most Developed Markets (DMs) amid easing financial conditions. US to lead rate cuts among DMs amid a slowing job market; Brazil to lead rate cuts among Emerging Markets (EMs).
Fig. 13 DM business confidence remains resilient; rate cuts to support US, EM growth
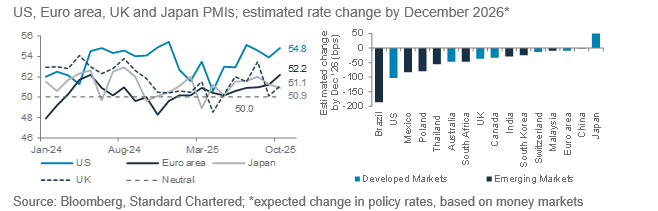
Macro factors to watch
Fed rate cuts, trade deals, tax incentives to offset tariff impact: Limited data due to the US government shutdown since 1 October makes it harder to assess the health of the economy. Alternative data from the private sector and Fed surveys suggests a resilient economy fuelled by high-income household consumption. The impact of tariffs is yet to be felt, with many firms holding back higher import costs on worries the low- to middle-income segments will be unable to bear the costs as the job market slows. The delayed consumer inflation report for September showed the impact of tariffs on goods inflation remains limited while shelter disinflation continued.
This year’s USD decline and stock market surge have eased financial conditions. Against this backdrop, another 100bps of expected Fed rate cuts by end-2026 should help offset the impact of tariffs. Trade deals with US partners during President Trump’s Asian trip, including a truce with China, should ease uncertainty. US tax incentives in the new fiscal year from 1 October should fuel AI-related investment and revive investment in strategic sectors and growth in 2026.
ECB nears end of rate cut cycle as German stimulus kicks in. Germany’s fiscal stimulus, due to accelerate from 2026, should lift Euro area growth by 0.3-0.5ppt in 2026. We see one last 25bps ECB cut to 1.75% in December before the German stimulus and EU-wide defence spending kick in. The ECB’s 200bps of rate cuts since June last year have helped partly offset the impact of a strong EUR. The trade deal with the US, which left the EU facing 15% tariffs, same as rivals Japan and South Korea, eases a key uncertainty. France’s political and fiscal uncertainty is the biggest regional risk.
China Plenum signals more stimulus, supply-side reform: China’s Fourth Plenum to finalise the next five-year (2026-30) plan focused on innovation and advanced technology to boost self-reliance and productivity. The plan also proposed flexible fiscal and monetary policies to lift domestic consumption and tackle sectoral overcapacity to fight deflationary pressures. The central bank has already restarted government bond purchases to ease liquidity. We expect more targeted easing measures to revive domestic demand as an exports boost from front-running of US tariffs fades.
Asset Classes
Bonds
|
|
||||
|
Our view
Foundation: We have reduced global bonds in our overall allocation to Underweight. This is implemented by a lowering corporate bonds (‘credits’) to an Underweight allocation, while government bonds (‘rates’) remain a Core allocation.
In an environment of elevated valuations across equities and corporate bonds, we prefer the relatively less constrained upside opportunities in equities, compared with corporate bonds. This underpins our Underweight on Developed Market (DM) Investment Grade (IG) corporate and High Yield (HY) in our foundation asset allocation. Given elevated valuations in credits, we find relative valuations in government bonds more attractive. In USD-denominated bonds, we anticipate short-term yields to decline more than long-term yields, driven by an expected lowering of the Fed Funds rate to 3% by end 2026 2 . We expect rates volatility to rebound from the recent trough due to uncertainties surrounding the US fiscal outlook, tariffs and Fed independence. We view increases in long-term yields as transitory and opportunities to lock in still-high absolute yields. We forecast the US 10-year government bond yield to range between 3.75% and 4.00% over the next 12 months. Bonds with five- to seven-year maturities offer the most attractive balance between yields and fiscal and inflation risks.
We maintain an Overweight view on Emerging Market (EM) local currency (LCY) government bonds, driven by benign local inflation, dovish monetary policy outlook, improvements in fiscal positions and our expectation of a weak USD.
Opportunistic ideas: We initiate a bullish Asia USD IG bonds idea, expecting the strong year-to-date performance to extend, driven by strong fundamentals, favourable technical dynamics and fund inflows. We remain bullish on US Treasury Inflation-Protected Securities (TIPS) and short-duration US HY bonds. We take profit and close our bullish view on UK government bonds (FX-unhedged). We expect that volatility in Gilts and GBP will rise as we approach the budget release in end-November.
Key chart
We are Underweight DM IG and HY corporate bonds, as corporate yield premia remain tight; we are Overweight EM LCY government bonds amid solid EM fundamentals relative to DMs’.
Fig. 14 DM IG and HY corporate bond yield premia are close to historical low levels; EM fundamentals are solid when compared to DMs’.
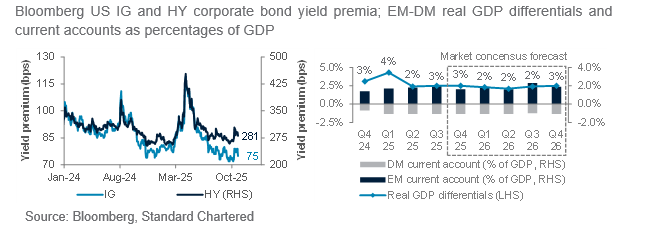
We have cut our allocation to global bonds to Underweight, a shift mainly driven by lowering corporate bonds to Underweight. Government bonds remain a Core allocation.
We retain an Overweight on EM LCY government bonds. Our expectation for the Fed to further loosen monetary policy over the next 12 months should provide EM central banks flexibility to be more accommodating. Additionally, we view real (net-of-inflation) yields as attractive, and our expectation of a weak USD is supportive to returns. We move DM IG corporate bonds to Underweight, alongside our existing Underweight on DM HY corporate bonds. Yield premia for both asset classes are tight, and we prefer using equities to express our still-bullish view on corporates. The strong supply of DM corporate bonds, driven by increasing capex requirements and M&A activity, adds to downside risks.
We are opportunistically bullish TIPS, as it provides protection against upside risks to longer-term inflation amid fiscal concerns, tariff-driven inflation and commodity-driven inflation due to flare ups in geopolitical risks.
We are opportunistically bullish short-duration US HY bonds because of their attractive absolute yields with relatively low expected default rates. We initiate an opportunistic bullish Asia USD IG bonds idea. We believe the technical outlook for Asia IG bonds remains strong, with net negative issuance and investors still waiting to deploy excess cash holdings.
Equity
|
|
||||
|
|
||||
Our view
We retain our Overweight allocation to global equities, supported by receding geopolitical risks and a resilient fundamental backdrop. Our preferred regions are Asia ex-Japan and the US. A robust US Q3 earnings season and increasingly accommodative Fed policy both support a soft landing in the US economy.
We expect Asia ex-Japan to deliver the highest earnings growth among major regions over the next 12 months. We prefer China equities within the region, supported by the government’s Fourth Plenum commitments to achieve high-quality growth by increasing services consumption and strengthening its science and technology sector.
We maintain a Core allocation to Japan equities as fading political uncertainties and potential fiscal expansion are likely to be offset by lagging earnings growth projections. We upgrade Europe ex-UK to a Coreholding, given attractive valuations and fading political risks. We are staying UnderweightUK equities as the lack of exposure to technology and growth sectors compared to global equities is likely to weigh on their relative performance. The UK also has a relatively vulnerable fiscal position.
Key chart
US and AxJ equities buoyed by AI-driven earnings.
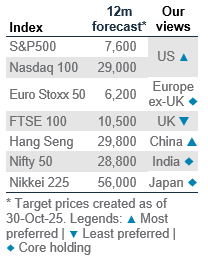
Fig. 15 US and Asia ex-Japan equities lead in 12-month forward earnings growth expectations; US and China likely to be in a “truce out of convenience”
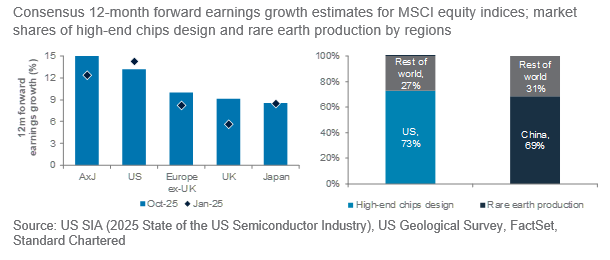
Broadly constructive outlook
Global equity markets continue to benefit from a strong earnings season and an improving macroeconomic backdrop. We remain Overweight US equities, driven by strong Q3 25 earnings; the US market remains well ahead of other Developed Markets based on projected 12-month forward earnings growth rankings. The S&P500 is also on track to deliver its strongest sales beat in almost four years. Fed easing reinforces our view the economy can achieve a soft landing, which should further support earnings momentum. We also believe the US and China will be in a trade “truce out of convenience,” given each side has leverage over the other. Risks include very bullish investor positioning, rising private credit concerns and slowing earnings breadth.
We are Overweight Asia ex-Japan. Asian equities have historically performed well in a weak USD environment. China’s Fourth Plenum reinforced plans to bolster service consumption
and support corporate earnings, with the next focus being the Central Economic Work Conference meeting in December. We prefer offshore equities, given its greater tilt towards our preferred growth sectors. Meanwhile, we have Core holdings on Taiwan and South Korea, as strong demand on AI infrastructure is offset by elevated valuations. We also see India as a Core holding – long-term growth prospects remain strong, despite tariff concerns and earnings downgrades. We favour large-cap equities versus mid-/small-caps, given their greater earnings and valuations margin of safety. We are Underweight ASEAN equities on a weaker earnings outlook.
We upgrade Europe ex-UK to a Core holding. Favourable economic conditions boost market sentiment, given the strong exposures of the region to cyclical stocks. Valuations are appealing, with the region’s equities trading at a deep discount to global equities. Risks include worsening of France’s political environment, while EUR strength may hurt exporters’ earnings.
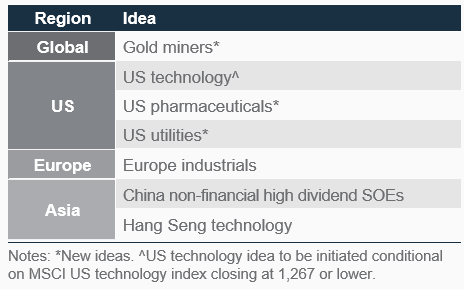
Equity opportunistic views
|
Adding more defensive ideas
- We initiate an opportunistic idea in gold miners after the recent pullback. We are structurally bullish on gold prices, which are supporting gold miners with higher profit margins and surging free cash flows. Gold miners’ equities are typically more volatile than gold prices. Weaker-than-expected gold prices would be a risk.
- We initiate a new opportunistic idea on US pharmaceuticals, given attractive valuations and earnings growth. Regulatory uncertainty has been a headwind for the sector this year, but we believe this risk has receded as President Trump agreed on pricing and tariff concessions with pharma companies. Further regulatory uncertainty is a risk.
- We initiate a new opportunistic idea on US utilities, which also offer defensive earnings growth and reasonable valuations. Earnings growth is accelerating, with the data centre boom supporting electricity demand growth over the next decade. A slowdown in data centre buildout is a risk.
- We would initiate an opportunistic position in the US technology sector after a 3%* pullback, given potential volatility in the ongoing Q3 earnings season. We remain positive on the sector, as AI spending supports the semiconductor industry and cloud service providers while AI applications support software development.
Fig. 16 Opportunistic ideas
Ongoing ideas
Europe industrials: We continue to see gains triggered by infrastructure and defence spending as Europe makes up for years of underinvestment, led by Germany. Although other countries face harder budget constraints, we believe there is strong political will for this strategic investment. A sharp slowdown in Europe’s economy is a risk.
China non-financial high-dividend state-owned enterprises (SOEs) aredomestically focused with less direct trade exposure. The stable dividend income is attractive while non-financial SOEs are less exposed to the troubled property sector. Adverse regulatory changes are a risk.
Hang Seng technology: We expect the valuation re-rating to continue as the earnings outlook improves heading into next year. Policymakers continue to support AI adoption and technology development, while major technology platforms are investing heavily, with benefits in monetisation and increased efficiency. Adverse regulatory changes are a risk.
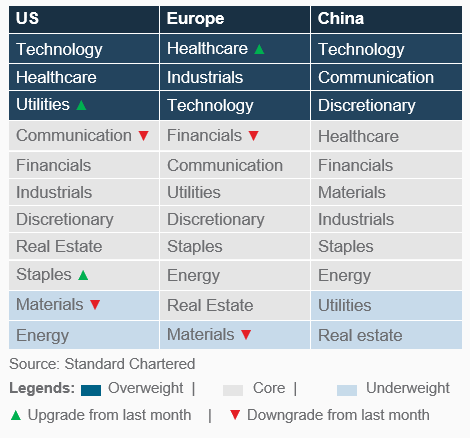
Sector views: Barbell in growth and defensive
We continue to prefer technology for growth exposure in the US, Europe and China, amid AI and software developments. In the US, we take a barbell approach with an Overweight in technology along with defensive exposure in healthcare and utilities. We downgrade communication to Neutral as heavy investment into AI infrastructure may dampen profit margins in the near term. In Europe, we adopt a similar barbell approach with Overweights in technology and industrials (for growth) and healthcare (defensive). We downgrade financials to Neutral as earnings growth slows, dragged by ECB rate cuts. We downgrade materials to Underweight in the US and Europe amid slowing global growth. In China, we maintain exposure to improving consumption and AI adoption, with an Overweight in technology, communication and discretionary. These sectors also generate strong cash flows, which are used for AI investments amid strong demand.
Fig. 17 Our sector views by region
FX
|
Our view
We expect the USD to rebound modestly to 100 over the next one to three months. The USD appears to be bottoming out in the near term, with bearish positioning starting to normalise and scope emerging for a short squeeze. However, the USD Index (DXY) is likely to face firm resistance around the 100 level, given technical and fundamental conditions remain insufficient to drive a sustained return to the pre-2025 range of 100-110. Therefore, we would view any near-term USD rebound as an opportunity to add to weak-USD trades.
Beyond a short-term rebound, we expect the USD to weaken over the next 6-12 months to 96. A weak US labour market, moderating economic growth and rising policy uncertainty are likely to push the Fed to cut rates further through 2026. As US policy rate moves lower, while other major central banks hold rates (or raise in Japan), the USD should follow. Structural drags – such as persistent twin deficits – suggest that any rallies will be short-lived. Fed Chair Powell signalled the end of quantitative tightening in December, which is likely to act as another headwind for the USD.
Key chart
Volatility in major currencies remains largely below the five-year average, suggesting FX spot moves are likely to remain moderate.
Fig. 18 FX volatility has fallen below the five-year average; FX forecast table
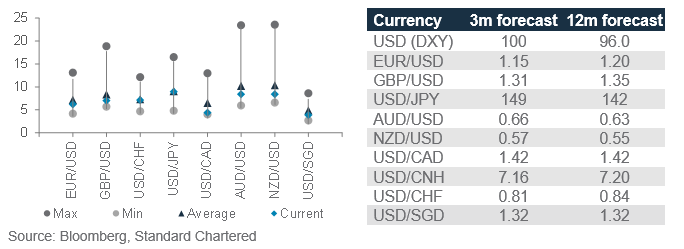
In Europe, the focus is likely to shift to the GBP. Slower-than-expected UK inflation has fuelled a surge in BoE rate cut expectations. Markets now price around a 70% probability of a quarter-point reduction by year-end, up from roughly 20% a month ago. Expectations of deeper easing next year are also likely to increase. We see GBP/USD declining towards 1.31 over the next 3 months before consolidating around the recent 6-month average of 1.35 over the next 12 months. Meanwhile, we see EUR/USD easing marginally to 1.15 following a USD rebound and trade policy uncertainty. The ECB is unlikely to ease significantly further, limiting downside risks for the EUR. Initial resistance is at 1.20, with the pace of USD weakness a key factor behind whether this holds.
Safe haven currency performance is likely to diverge. Japan’s new political leadership has revived market concerns over fiscal challenges. However, we expect the BoJ to eventually raise rates to counter rising wage-driven inflationary pressures. Combined with expected Fed rate cuts, this should push
USD/JPY towards 149 over the next 3 months and further down to 142 over 12 months. In contrast, recent market stress has strengthened the real trade-weighted Swiss Franc. However, further gains appear limited due to intervention risks. We therefore expect USD/CHF to rebound towards 0.81 in 3 months and 0.84 in 12 months.
We expect commodity currencies to consolidate. We see AUD/USD trading around 0.66, supported by CNH and gold price resilience, while NZD/USD stabilises around 0.57. In Canada, trade talks with the US have collapsed. Despite the risk of higher oil prices following US sanctions on Russia’s largest oil companies, USD/CAD could test resistance at 1.42 until trade uncertainties are resolved. Asian currencies should remain stable. We expect USD/CNH to consolidate around 7.16, then edge higher to 7.20 over the next 12 months as China’s economy slows. Singapore’s MAS has tilted towards easing. However, upside inflation risks persist. A policy pause remains likely, giving the MAS flexibility to respond to potential turbulence. We expect USD/SGD to hover around 1.32 over the next three months and stabilise thereafter.
Gold, crude oil
|
|
||||
|
Our view
We raise our 3- and 12-month gold price targets to USD 4,300/oz and USD 4,500/oz, respectively. We remain constructive on gold, maintaining our Overweight. Under-allocated investors can consider adding at USD 3945-4060/oz.
We expect West Texas Intermediate (WTI) oil to remain around USD 60/bbl and USD 63/bbl over the next 3- and 12-month horizons, respectively. Excess supply continues to be the dominant factor that should cap temporary rebounds in prices due to potential geopolitical risks.
Key chart
Fig. 19 Gold prices have reached a level that has historically signalled a pullback
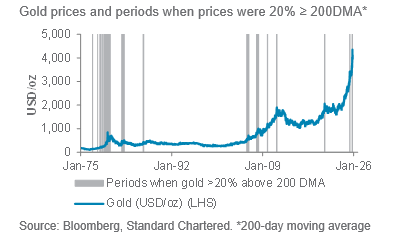
Fig. 21 Despite sanctions, Russian oil output has remained within a relatively narrow band
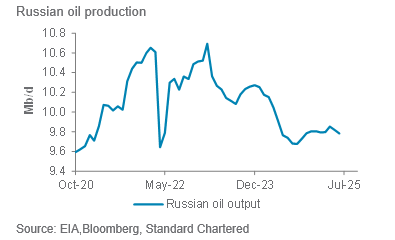
Fig. 20 Gold ETF holdings remain below their 2020 peak, suggesting room for upside after current pullback
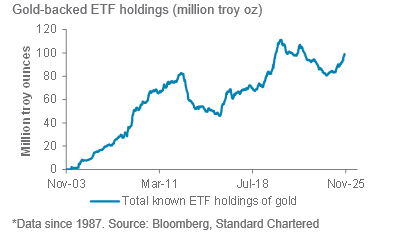
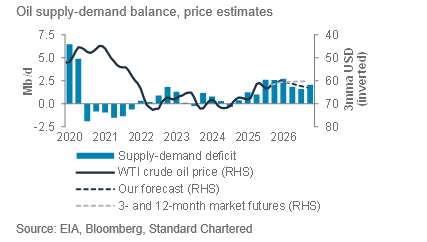
Fig. 22 The oil market is likely to remain in surplus this year, keeping prices in check
Gold outlook: Gold has finally corrected after nine straight weeks of gains. The pullback was overdue after such a rapid rally, and we see it as a healthy development to cool off overbought conditions. While positive long-term structural drivers remain for gold, we prefer to let the correction run its course before re-entering around USD 3,945-4,060/oz.
Oil outlook: Recent sanctions on Russian oil firms have had a muted impact on global oil markets. However, the broader supply backdrop remains comfortable, with US shale output still rising, albeit at a slower pace compared with previous expansion phases. At the same time, OPEC+ is maintaining elevated production levels. While geopolitical risks may trigger temporary price spikes, these are likely to be short-lived, given the prevailing excess supply. We expect WTI prices to stay rangebound around USD 63/bbl over the next 6-12 months on balance, with sentiment remaining bearish.
Additional perspectives
Quant perspective
Maintain bullish equity views
|
|
||||
Summary
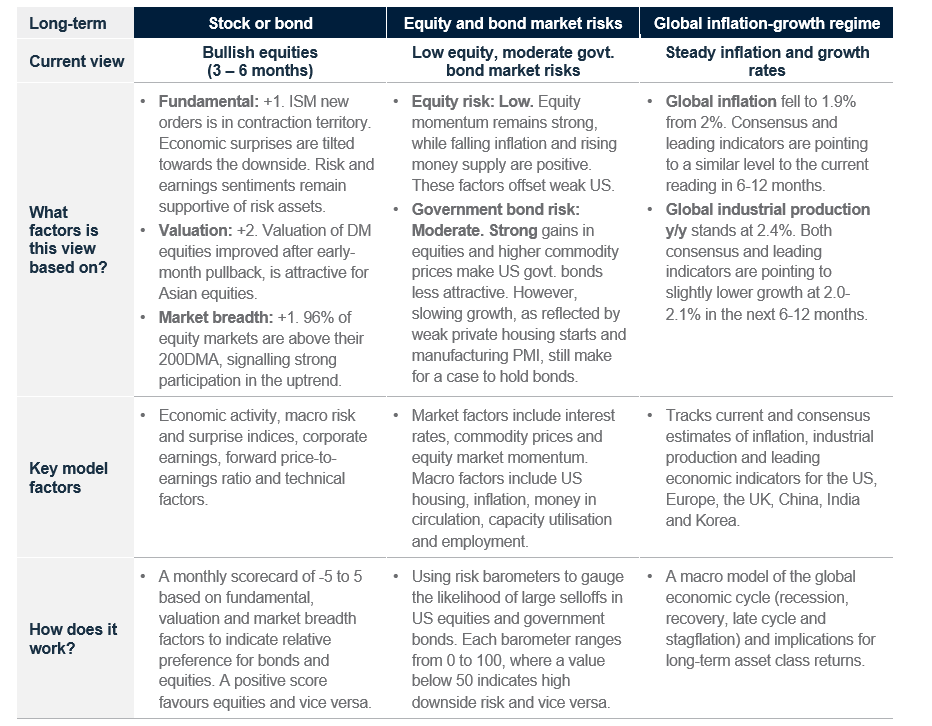
Long-term and short-term indicators are bullish risk assets. Long term: Our stock-bond model increased its Overweight to equities as Developed Market equity valuations improved This led to the model’s valuation score rising to +2 from 0 (a positive score indicates preference for equities over bonds) in October. The model’s fundamental score deteriorated slightly to +1 from +2 as PMI new orders contracted; the model’s technical score stayed at +1 as participation by individual markets in the current global equity uptrend remained strong. The combined score of +4 (out of 5) indicates a strong preference for equities over bonds. YTD outperformance relative to the 60/40 equity/bond benchmark rose to +71bps – a solid turnaround from the underperformance in Q1, when global equities lagged.
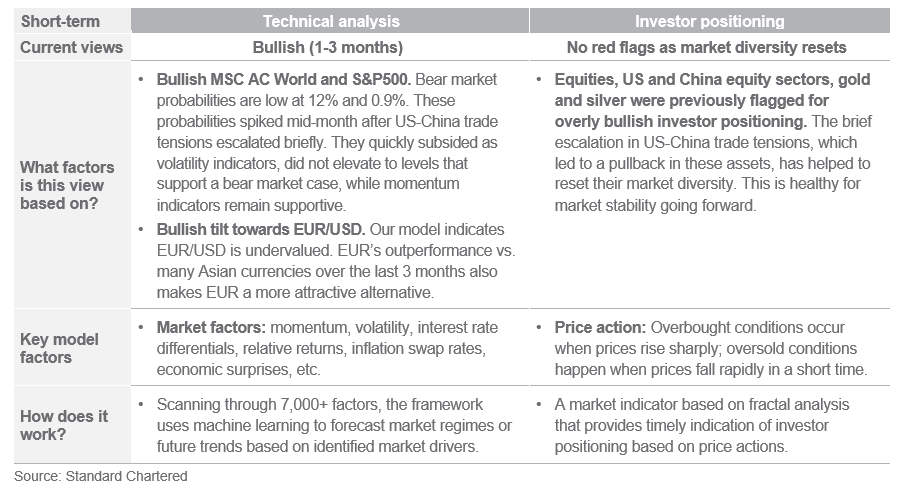
Short term: Our technical models also remain bullish on the S&P500 and MSCI AC World indices The brief escalation in US-China trade tensions caused the estimated bear market probabilities to jump in mid-October. Yet, they were insufficient to cause a bear signal, as momentum indicators remained bullish and more than offset the rise in volatility indicators. The current estimated bear market probabilities are a mere 0.9% and 12% for the S&P500 and MSCI AC World indices, respectively.
New short-term technical model for currency: Bullish EURUSD. The framework scans through 7000+ factors (e.g. momentum, risk indicators, yield differentials, inflation swap rate, economic surprise indices, etc.) and uses machine learning to identify bearish/ bullish market regimes. Current model signal indicates that the EUR is undervalued relative to USD. The stronger relative performance of EUR against many other currencies (such as Asian FX) in the last 3 months also makes it more attractive, from a momentum perspective. Our market diversity indicators are also no longer signalling stretched investor positioning after the recent pullbacks in equities, gold and silver. Gold was flagged for short-term reversal in our Weekly Market Views on 10 October 2025. The reset in the market diversity of the assets promotes greater market stability going forward.
Key chart
Our stock-bond model is Overweight equities, as the model score stands at +4 out of 5. Valuation, fundamental and technical factors all prefer equities over bonds.
Fig. 23 Breakdown of our stock-bond rotation model’s scores
Our short-term technical model for the S&P500 remains bullish through October, despite market jitters from US-China trade tensions, which have now eased.
Fig. 24 Our technical model turned bullish on the S&P500
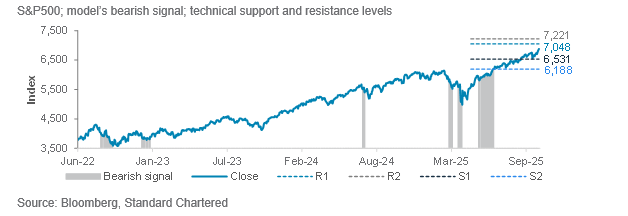
Fig. 25 Long- and short-term quantitative models are bullish risky assets
Long-term models below have a typical time horizon of 3-6 months, while short-term models have a 1-3 month horizon
Performance review
Foundation: Asset allocation summary
Foundation+: Asset allocation summary
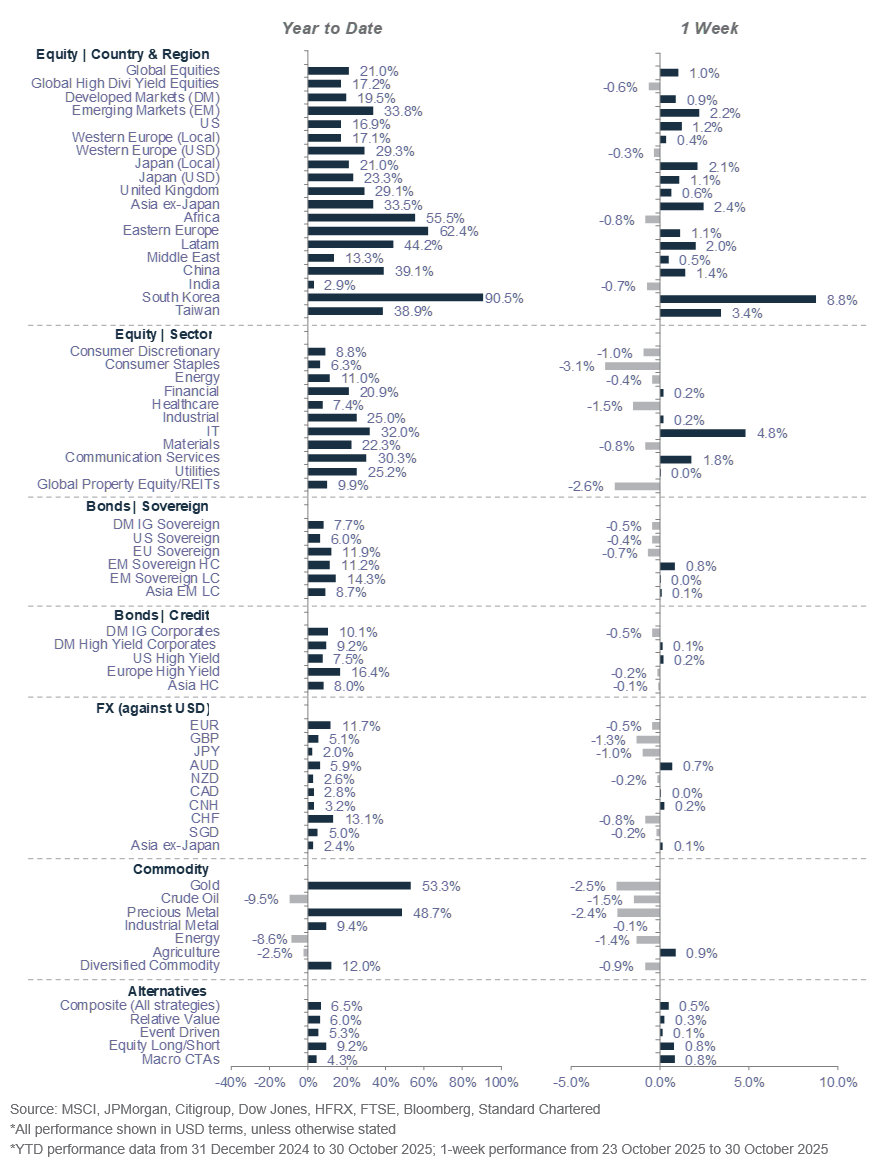
Market performance summary
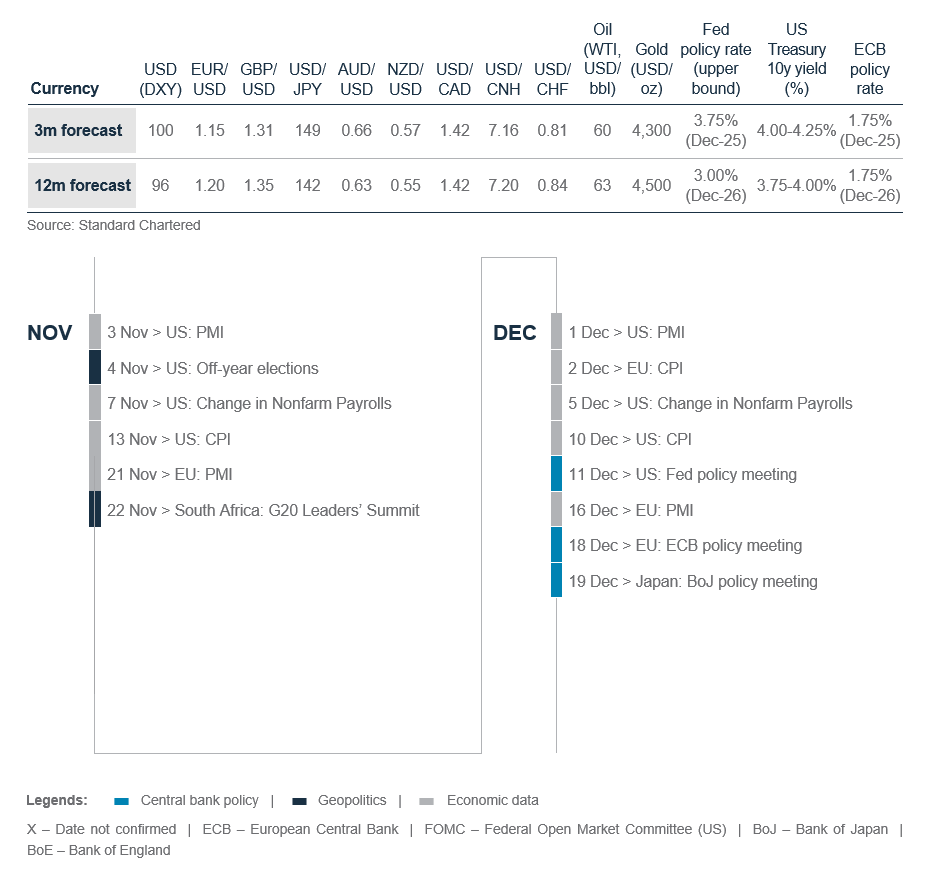
Our key forecasts and calendar events
Today, Tomorrow and Forever


Explanatory notes
1. The figures on page 5 show allocations for a moderately aggressive risk profile only – different risk profiles may produce significantly different asset allocation results. Page 5 is only an example, provided for general information only and they do not constitute investment advice, an offer, recommendation or solicitation. They do not take into account the specific investment objectives, needs or risk tolerances of a particular person or class of persons and they have not been prepared for any particular person or class of persons.
2. Contingent Convertibles are complex financial instruments and are not a suitable or appropriate investment for all investors. This document is not an offer to sell or an invitation to buy any securities or any beneficial interests therein. Contingent convertible securities are not intended to be sold and should not be sold to retail clients in the European Economic Area (EEA) (each as defined in the Policy Statement on the Restrictions on the Retail Distribution of Regulatory Capital Instruments (Feedback to CP14/23 and Final Rules) (“Policy Statement”), read together with the Product Intervention (Contingent Convertible Instruments and Mutual Society Shares) Instrument 2015 (“Instrument”, and together with the Policy Statement, the “Permanent Marketing Restrictions”), which were published by the United Kingdom’s Financial Conduct Authority in June 2015), other than in circumstances that do not give rise to a contravention of the Permanent Marketing Restrictions.
Disclosure
This document is confidential and may also be privileged. If you are not the intended recipient, please destroy all copies and notify the sender immediately. This document is being distributed for general information only and is subject to the relevant disclaimers available at our Standard Chartered website under Regulatory disclosures. It is not and does not constitute research material, independent research, an offer, recommendation or solicitation to enter into any transaction or adopt any hedging, trading or investment strategy, in relation to any securities or other financial instruments. This document is for general evaluation only. It does not take into account the specific investment objectives, financial situation or particular needs of any particular person or class of persons and it has not been prepared for any particular person or class of persons. You should not rely on any contents of this document in making any investment decisions. Before making any investment, you should carefully read the relevant offering documents and seek independent legal, tax and regulatory advice. In particular, we recommend you to seek advice regarding the suitability of the investment product, taking into account your specific investment objectives, financial situation or particular needs, before you make a commitment to purchase the investment product. Opinions, projections and estimates are solely those of SC at the date of this document and subject to change without notice. Past performance is not indicative of future results and no representation or warranty is made regarding future performance. The value of investments, and the income from them, can go down as well as up, and you may not recover the amount of your original investment. You are not certain to make a profit and may lose money. Any forecast contained herein as to likely future movements in rates or prices or likely future events or occurrences constitutes an opinion only and is not indicative of actual future movements in rates or prices or actual future events or occurrences (as the case may be). This document must not be forwarded or otherwise made available to any other person without the express written consent of the Standard Chartered Group (as defined below). Standard Chartered Bank is incorporated in England with limited liability by Royal Charter 1853 Reference Number ZC18. The Principal Office of the Company is situated in England at 1 Basinghall Avenue, London, EC2V 5DD. Standard Chartered Bank is authorised by the Prudential Regulation Authority and regulated by the Financial Conduct Authority and Prudential Regulation Authority. Standard Chartered PLC, the ultimate parent company of Standard Chartered Bank, together with its subsidiaries and affiliates (including each branch or representative office), form the Standard Chartered Group. Standard Chartered Private Bank is the private banking division of Standard Chartered. Private banking activities may be carried out internationally by different legal entities and affiliates within the Standard Chartered Group (each an “SC Group Entity”) according to local regulatory requirements. Not all products and services are provided by all branches, subsidiaries and affiliates within the Standard Chartered Group. Some of the SC Group Entities only act as representatives of Standard Chartered Private Bank and may not be able to offer products and services or offer advice to clients.
Copyright © 2026, Accounting Research & Analytics, LLC d/b/a CFRA (and its affiliates, as applicable). Reproduction of content provided by CFRA in any form is prohibited except with the prior written permission of CFRA. CFRA content is not investment advice and a reference to or observation concerning a security or investment provided in the CFRA SERVICES is not a recommendation to buy, sell or hold such investment or security or make any other investment decisions. The CFRA content contains opinions of CFRA based upon publicly-available information that CFRA believes to be reliable and the opinions are subject to change without notice. This analysis has not been submitted to, nor received approval from, the United States Securities and Exchange Commission or any other regulatory body. While CFRA exercised due care in compiling this analysis, CFRA, ITS THIRD-PARTY SUPPLIERS, AND ALL RELATED ENTITIES SPECIFICALLY DISCLAIM ALL WARRANTIES, EXPRESS OR IMPLIED, INCLUDING, BUT NOT LIMITED TO, ANY WARRANTIES OF MERCHANTABILITY OR FITNESS FOR A PARTICULAR PURPOSE OR USE, to the full extent permitted by law, regarding the accuracy, completeness, or usefulness of this information and assumes no liability with respect to the consequences of relying on this information for investment or other purposes. No content provided by CFRA (including ratings, credit-related analyses and data, valuations, model, software or other application or output therefrom) or any part thereof may be modified, reverse engineered, reproduced or distributed in any form by any means, or stored in a database or retrieval system, without the prior written permission of CFRA, and such content shall not be used for any unlawful or unauthorized purposes. CFRA and any third-party providers, as well as their directors, officers, shareholders, employees or agents do not guarantee the accuracy, completeness, timeliness or availability of such content. In no event shall CFRA, its affiliates, or their third-party suppliers be liable for any direct, indirect, special, or consequential damages, costs, expenses, legal fees, or losses (including lost income or lost profit and opportunity costs) in connection with a subscriber’s, subscriber’s customer’s, or other’s use of CFRA’s content.
Market Abuse Regulation (MAR) Disclaimer
Banking activities may be carried out internationally by different branches, subsidiaries and affiliates within the Standard Chartered Group according to local regulatory requirements. Opinions may contain outright “buy”, “sell”, “hold” or other opinions. The time horizon of this opinion is dependent on prevailing market conditions and there is no planned frequency for updates to the opinion. This opinion is not independent of Standard Chartered Group’s trading strategies or positions. Standard Chartered Group and/or its affiliates or its respective officers, directors, employee benefit programmes or employees, including persons involved in the preparation or issuance of this document may at any time, to the extent permitted by applicable law and/or regulation, be long or short any securities or financial instruments referred to in this document or have material interest in any such securities or related investments. Therefore, it is possible, and you should assume, that Standard Chartered Group has a material interest in one or more of the financial instruments mentioned herein. Please refer to our Standard Chartered website under Regulatory disclosures for more detailed disclosures, including past opinions/ recommendations in the last 12 months and conflict of interests, as well as disclaimers. A covering strategist may have a financial interest in the debt or equity securities of this company/issuer. All covering strategist are licensed to provide investment recommendations under Monetary Authority of Singapore or Hong Kong Monetary Authority. This document must not be forwarded or otherwise made available to any other person without the express written consent of Standard Chartered Group.
Sustainable Investments
Any ESG data used or referred to has been provided by Morningstar, Sustainalytics, MSCI or Bloomberg. Refer to 1) Morningstar website under Sustainable Investing, 2) Sustainalytics website under ESG Risk Ratings, 3) MCSI website under ESG Business Involvement Screening Research and 4) Bloomberg green, social & sustainability bonds guide for more information. The ESG data is as at the date of publication based on data provided, is for informational purpose only and is not warranted to be complete, timely, accurate or suitable for a particular purpose, and it may be subject to change. Sustainable Investments (SI): This refers to funds that have been classified as ‘ESG Intentional Investments – Overall’ by Morningstar. SI funds have explicitly stated in their prospectus and regulatory filings that they either incorporate ESG factors into the investment process or have a thematic focus on the environment, gender diversity, low carbon, renewable energy, water or community development. For equity, it refers to shares/stocks issued by companies with Sustainalytics ESG Risk Rating of Low/Negligible. For bonds, it refers to debt instruments issued by issuers with Sustainalytics ESG Risk Rating of Low/Negligible, and/or those being certified green, social, sustainable bonds by Bloomberg. For structured products, it refers to products that are issued by any issuer who has a Sustainable Finance framework that aligns with Standard Chartered’s Green and Sustainable Product Framework, with underlying assets that are part of the Sustainable Investment universe or separately approved by Standard Chartered’s Sustainable Finance Governance Committee. Sustainalytics ESG risk ratings shown are factual and are not an indicator that the product is classified or marketed as “green”, “sustainable” or similar under any particular classification system or framework.
Country/Market Specific Disclosures
Bahrain: This document is being distributed in Bahrain by Standard Chartered Bank, Bahrain Branch, having its address at P.O. 29, Manama, Kingdom of Bahrain, is a branch of Standard Chartered Bank and is licensed by the Central Bank of Bahrain as a conventional retail bank. Botswana: This document is being distributed in Botswana by, and is attributable to, Standard Chartered Bank Botswana Limited which is a financial institution licensed under the Section 6 of the Banking Act CAP 46.04 and is listed in the Botswana Stock Exchange. Brunei Darussalam: This document is being distributed in Brunei Darussalam by, and is attributable to, Standard Chartered Bank (Brunei Branch) | Registration Number RFC/61 and Standard Chartered Securities (B) Sdn Bhd | Registration Number RC20001003. Standard Chartered Bank is incorporated in England with limited liability by Royal Charter 1853 Reference Number ZC18. Standard Chartered Securities (B) Sdn Bhd is a limited liability company registered with the Registry of Companies with Registration Number RC20001003 and licensed by Brunei Darussalam Central Bank as a Capital Markets Service License Holder with License Number BDCB/R/CMU/S3-CL and it is authorised to conduct Islamic investment business through an Islamic window. China Mainland: This document is being distributed in China by, and is attributable to, Standard Chartered Bank (China) Limited which is mainly regulated by National Financial Regulatory Administration (NFRA), State Administration of Foreign Exchange (SAFE), and People’s Bank of China (PBOC). Hong Kong: In Hong Kong, this document, except for any portion advising on or facilitating any decision on futures contracts trading, is distributed by Standard Chartered Bank (Hong Kong) Limited (“SCBHK”), a subsidiary of Standard Chartered PLC. SCBHK has its registered address at 32/F, Standard Chartered Bank Building, 4-4A Des Voeux Road Central, Hong Kong and is regulated by the Hong Kong Monetary Authority and registered with the Securities and Futures Commission (“SFC”) to carry on Type 1 (dealing in securities), Type 4 (advising on securities), Type 6 (advising on corporate finance) and Type 9 (asset management) regulated activity under the Securities and Futures Ordinance (Cap. 571) (“SFO”) (CE No. AJI614). The contents of this document have not been reviewed by any regulatory authority in Hong Kong and you are advised to exercise caution in relation to any offer set out herein. If you are in doubt about any of the contents of this document, you should obtain independent professional advice. Any product named herein may not be offered or sold in Hong Kong by means of any document at any time other than to “professional investors” as defined in the SFO and any rules made under that ordinance. In addition, this document may not be issued or possessed for the purposes of issue, whether in Hong Kong or elsewhere, and any interests may not be disposed of, to any person unless such person is outside Hong Kong or is a “professional investor” as defined in the SFO and any rules made under that ordinance, or as otherwise may be permitted by that ordinance. In Hong Kong, Standard Chartered Private Bank is the private banking division of SCBHK, a subsidiary of Standard Chartered PLC. Ghana: Standard Chartered Bank Ghana Limited accepts no liability and will not be liable for any loss or damage arising directly or indirectly (including special, incidental or consequential loss or damage) from your use of these documents. Past performance is not indicative of future results and no representation or warranty is made regarding future performance. You should seek advice from a financial adviser on the suitability of an investment for you, taking into account these factors before making a commitment to invest in an investment. To unsubscribe from receiving further updates, please send an email to feedback.ghana@sc.com. Please do not reply to this email. Call our Priority Banking on 0302610750 for any questions or service queries. You are advised not to send any confidential and/or important information to Standard Chartered via e-mail, as Standard Chartered makes no representations or warranties as to the security or accuracy of any information transmitted via e-mail. Standard Chartered shall not be responsible for any loss or damage suffered by you arising from your decision to use e-mail to communicate with the Bank. India: This document is being distributed in India by Standard Chartered in its capacity as a distributor of mutual funds and referrer of any other third party financial products. Standard Chartered does not offer any ‘Investment Advice’ as defined in the Securities and Exchange Board of India (Investment Advisers) Regulations, 2013 or otherwise. Services/products related securities business offered by Standard Charted are not intended for any person, who is a resident of any jurisdiction, the laws of which imposes prohibition on soliciting the securities business in that jurisdiction without going through the registration requirements and/or prohibit the use of any information contained in this document. Indonesia: This document is being distributed in Indonesia by Standard Chartered Bank, Indonesia branch, which is a financial institution licensed and supervised by Otoritas Jasa Keuangan (Financial Service Authority) and Bank Indonesia. Jersey: In Jersey, Standard Chartered Private Bank is the Registered Business Name of the Jersey Branch of Standard Chartered Bank. The Jersey Branch of Standard Chartered Bank is regulated by the Jersey Financial Services Commission. Copies of the latest audited accounts of Standard Chartered Bank are available from its principal place of business in Jersey: PO Box 80, 15 Castle Street, St Helier, Jersey JE4 8PT. Standard Chartered Bank is incorporated in England with limited liability by Royal Charter in 1853 Reference Number ZC 18. The Principal Office of the Company is situated in England at 1 Basinghall Avenue, London, EC2V 5DD. Standard Chartered Bank is authorised by the Prudential Regulation Authority and regulated by the Financial Conduct Authority and Prudential Regulation Authority. The Jersey Branch of Standard Chartered Bank is also an authorised financial services provider under license number 44946 issued by the Financial Sector Conduct Authority of the Republic of South Africa. Jersey is not part of the United Kingdom and all business transacted with Standard Chartered Bank, Jersey Branch and other SC Group Entity outside of the United Kingdom, are not subject to some or any of the investor protection and compensation schemes available under United Kingdom law. Kenya: This document is being distributed in Kenya by and is attributable to Standard Chartered Bank Kenya Limited. Investment Products and Services are distributed by Standard Chartered Investment Services Limited, a wholly owned subsidiary of Standard Chartered Bank Kenya Limited that is licensed by the Capital Markets Authority in Kenya, as a Fund Manager. Standard Chartered Bank Kenya Limited is regulated by the Central Bank of Kenya. Malaysia: This document is being distributed in Malaysia by Standard Chartered Bank Malaysia Berhad (“SCBMB”). Recipients in Malaysia should contact SCBMB in relation to any matters arising from, or in connection with, this document. This document has not been reviewed by the Securities Commission Malaysia. The product lodgement, registration, submission or approval by the Securities Commission of Malaysia does not amount to nor indicate recommendation or endorsement of the product, service or promotional activity. Investment products are not deposits and are not obligations of, not guaranteed by, and not protected by SCBMB or any of the affiliates or subsidiaries, or by Perbadanan Insurans Deposit Malaysia, any government or insurance agency. Investment products are subject to investment risks, including the possible loss of the principal amount invested. SCBMB expressly disclaim any liability and responsibility for any loss arising directly or indirectly (including special, incidental or consequential loss or damage) arising from the financial losses of the Investment Products due to market condition. Nigeria: This document is being distributed in Nigeria by Standard Chartered Bank Nigeria Limited (SCB Nigeria), a bank duly licensed and regulated by the Central Bank of Nigeria. SCB Nigeria accepts no liability for any loss or damage arising directly or indirectly (including special, incidental or consequential loss or damage) from your use of these documents. You should seek advice from a financial adviser on the suitability of an investment for you, taking into account these factors before making a commitment to invest in an investment. To unsubscribe from receiving further updates, please send an email to clientcare.ng@sc.com requesting to be removed from our mailing list. Please do not reply to this email. Call our Priority Banking on 02 012772514 for any questions or service queries. SCB Nigeria shall not be responsible for any loss or damage arising from your decision to send confidential and/or important information to Standard Chartered via e-mail. SCB Nigeria makes no representations or warranties as to the security or accuracy of any information transmitted via e-mail. Pakistan: This document is being distributed in Pakistan by, and attributable to Standard Chartered Bank (Pakistan) Limited having its registered office at PO Box 5556, I.I Chundrigar Road Karachi, which is a banking company registered with State Bank of Pakistan under Banking Companies Ordinance 1962 and is also having licensed issued by Securities & Exchange Commission of Pakistan for Security Advisors. Standard Chartered Bank (Pakistan) Limited acts as a distributor of mutual funds and referrer of other third-party financial products. Singapore: This document is being distributed in Singapore by, and is attributable to, Standard Chartered Bank (Singapore) Limited (Registration No. 201224747C/ GST Group Registration No. MR-8500053-0, “SCBSL”). Recipients in Singapore should contact SCBSL in relation to any matters arising from, or in connection with, this document. SCBSL is an indirect wholly owned subsidiary of Standard Chartered Bank and is licensed to conduct banking business in Singapore under the Singapore Banking Act, 1970. Standard Chartered Private Bank is the private banking division of SCBSL. IN RELATION TO ANY SECURITY OR SECURITIES-BASED DERIVATIVES CONTRACT REFERRED TO IN THIS DOCUMENT, THIS DOCUMENT, TOGETHER WITH THE ISSUER DOCUMENTATION, SHALL BE DEEMED AN INFORMATION MEMORANDUM (AS DEFINED IN SECTION 275 OF THE SECURITIES AND FUTURES ACT, 2001 (“SFA”)). THIS DOCUMENT IS INTENDED FOR DISTRIBUTION TO ACCREDITED INVESTORS, AS DEFINED IN SECTION 4A(1)(a) OF THE SFA, OR ON THE BASIS THAT THE SECURITY OR SECURITIES-BASED DERIVATIVES CONTRACT MAY ONLY BE ACQUIRED AT A CONSIDERATION OF NOT LESS THAN S$200,000 (OR ITS EQUIVALENT IN A FOREIGN CURRENCY) FOR EACH TRANSACTION. Further, in relation to any security or securities-based derivatives contract, neither this document nor the Issuer Documentation has been registered as a prospectus with the Monetary Authority of Singapore under the SFA. Accordingly, this document and any other document or material in connection with the offer or sale, or invitation for subscription or purchase, of the product may not be circulated or distributed, nor may the product be offered or sold, or be made the subject of an invitation for subscription or purchase, whether directly or indirectly, to persons other than a relevant person pursuant to section 275(1) of the SFA, or any person pursuant to section 275(1A) of the SFA, and in accordance with the conditions specified in section 275 of the SFA, or pursuant to, and in accordance with the conditions of, any other applicable provision of the SFA. In relation to any collective investment schemes referred to in this document, this document is for general information purposes only and is not an offering document or prospectus (as defined in the SFA). This document is not, nor is it intended to be (i) an offer or solicitation of an offer to buy or sell any capital markets product; or (ii) an advertisement of an offer or intended offer of any capital markets product. Deposit Insurance Scheme: Singapore dollar deposits of non-bank depositors are insured by the Singapore Deposit Insurance Corporation, for up to S$100,000 in aggregate per depositor per Scheme member by law. Foreign currency deposits, dual currency investments, structured deposits and other investment products are not insured. This advertisement has not been reviewed by the Monetary Authority of Singapore. Taiwan: SC Group Entity or Standard Chartered Bank (Taiwan) Limited (“SCB (Taiwan)”) may be involved in the financial instruments contained herein or other related financial instruments. The author of this document may have discussed the information contained herein with other employees or agents of SC or SCB (Taiwan). The author and the above-mentioned employees of SC or SCB (Taiwan) may have taken related actions in respect of the information involved (including communication with customers of SC or SCB (Taiwan) as to the information contained herein). The opinions contained in this document may change, or differ from the opinions of employees of SC or SCB (Taiwan). SC and SCB (Taiwan) will not provide any notice of any changes to or differences between the above-mentioned opinions. This document may cover companies with which SC or SCB (Taiwan) seeks to do business at times and issuers of financial instruments. Therefore, investors should understand that the information contained herein may serve as specific purposes as a result of conflict of interests of SC or SCB (Taiwan). SC, SCB (Taiwan), the employees (including those who have discussions with the author) or customers of SC or SCB (Taiwan) may have an interest in the products, related financial instruments or related derivative financial products contained herein; invest in those products at various prices and on different market conditions; have different or conflicting interests in those products. The potential impacts include market makers’ related activities, such as dealing, investment, acting as agents, or performing financial or consulting services in relation to any of the products referred to in this document. UAE: DIFC – Standard Chartered Bank is incorporated in England with limited liability by Royal Charter 1853 Reference Number ZC18.The Principal Office of the Company is situated in England at 1 Basinghall Avenue, London, EC2V 5DD. Standard Chartered Bank is authorised by the Prudential Regulation Authority and regulated by the Financial Conduct Authority and Prudential Regulation Authority. Standard Chartered Bank, Dubai International Financial Centre having its offices at Dubai International Financial Centre, Building 1, Gate Precinct, P.O. Box 999, Dubai, UAE is a branch of Standard Chartered Bank and is regulated by the Dubai Financial Services Authority (“DFSA”). This document is intended for use only by Professional Clients and is not directed at Retail Clients as defined by the DFSA Rulebook. In the DIFC we are authorised to provide financial services only to clients who qualify as Professional Clients and Market Counterparties and not to Retail Clients. As a Professional Client you will not be given the higher retail client protection and compensation rights and if you use your right to be classified as a Retail Client we will be unable to provide financial services and products to you as we do not hold the required license to undertake such activities. For Islamic transactions, we are acting under the supervision of our Shariah Supervisory Committee. Relevant information on our Shariah Supervisory Committee is currently available on the Standard Chartered Bank website in the Islamic banking section. For residents of the UAE – Standard Chartered UAE (“SC UAE”) is licensed by the Central Bank of the U.A.E. SC UAE is licensed by Securities and Commodities Authority to practice Promotion Activity. SC UAE does not provide financial analysis or consultation services in or into the UAE within the meaning of UAE Securities and Commodities Authority Decision No. 48/r of 2008 concerning financial consultation and financial analysis. Uganda: Our Investment products and services are distributed by Standard Chartered Bank Uganda Limited, which is licensed by the Capital Markets Authority as an investment adviser. United Kingdom: In the UK, Standard Chartered Bank is authorised by the Prudential Regulation Authority and regulated by the Financial Conduct Authority and Prudential Regulation Authority. This communication has been approved by Standard Chartered Bank for the purposes of Section 21 (2) (b) of the United Kingdom’s Financial Services and Markets Act 2000 (“FSMA”) as amended in 2010 and 2012 only. Standard Chartered Bank (trading as Standard Chartered Private Bank) is also an authorised financial services provider (license number 45747) in terms of the South African Financial Advisory and Intermediary Services Act, 2002. The Materials have not been prepared in accordance with UK legal requirements designed to promote the independence of investment research, and that it is not subject to any prohibition on dealing ahead of the dissemination of investment research. Vietnam: This document is being distributed in Vietnam by, and is attributable to, Standard Chartered Bank (Vietnam) Limited which is mainly regulated by State Bank of Vietnam (SBV). Recipients in Vietnam should contact Standard Chartered Bank (Vietnam) Limited for any queries regarding any content of this document. Zambia: This document is distributed by Standard Chartered Bank Zambia Plc, a company incorporated in Zambia and registered as a commercial bank and licensed by the Bank of Zambia under the Banking and Financial Services Act Chapter 387 of the Laws of Zambia.