2 September 2022
Global Market Outlook
Global Market Outlook
Narrowing our focus
The Fed’s emphasis on fighting inflation is causing investors to question whether the recent rebound in risky assets is sustainable. We believe retaining equities as a core holding is the most attractive way to balance the bull and bear scenarios.
Within equities, we see the pullback in Asia ex-Japan equities as an opportunity given the increasingly growth-supportive policy stance in China. We also prefer UK equities given attractive valuations and relatively higher dividend yields.
Asia USD bonds remain preferred given a still-attractive yield for a mainly Investment Grade asset class. We take advantage of the recent rally to close our preference for High Yield bonds.
Are all bear markets the same?
What are the main macro factors to watch?
What are your key currency convictions?
Strategy
Investment strategy and key themes
|
|
||||

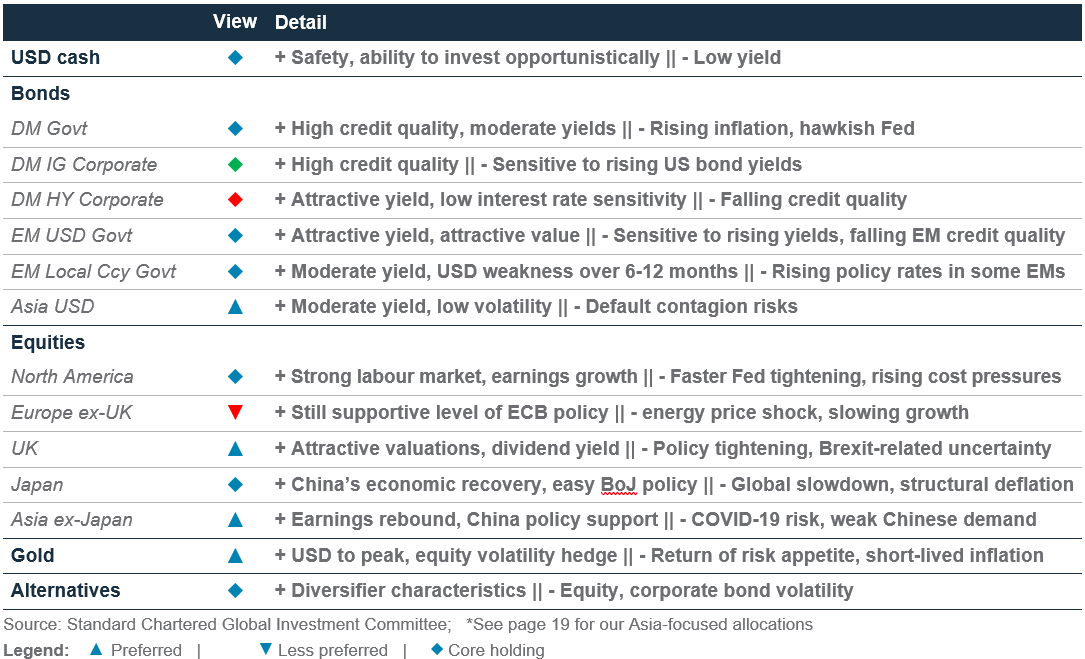
Our preferences (12-month view)
Foundation allocation preferences
- Prefer Gold
- In equities: Asia ex-Japan and the UK
- In bonds: Asia USD
- In FX: Bearish USD; bullish EUR, AUD, NZD, CAD
Sector preferences
- US: Energy, Financials, Healthcare
- Europe: Energy, Financials, Healthcare
- China: Energy, Financials, Industrials, Comms. Services, Materials
Longer-term themes
- The Winds of Climate Change
- Clean Technology, Electric Vehicles, Water Scarcity, Infrastructure/ Green Capex
- Embracing a Digital Future
- Cybersecurity
- China’s ‘Common Prosperity’
- Hard Tech/Semiconductor, Renewables
Narrowing our focus
- The Fed’s emphasis on fighting inflation is causing investors to question whether the recent rebound in risky assets is sustainable. We believe retaining equities as a core holding and focusing on region and sector picks is the most attractive way to balance the bull and bear scenarios.
- Within equities, we see the pullback in Asia ex-Japan equities as an opportunity given the increasingly growth-supportive policy stance in China. We also prefer UK equities given attractive valuations and relatively higher dividend yields.
- Asia USD bonds remain preferred given a still-attractive yield for a mainly Investment Grade (IG) asset class. We take advantage of the recent rally to close our preference for High Yield (HY) bonds.
The Fed stays the course
Risky assets staged a relatively strong rally from their mid-June lows to their mid-August peak, with global equities rising about 13% over this period. Since mid-August, though, global equities have given back over half their gains, with other major risk assets following a similar pattern.
The outlook for US monetary policy remains a key driver of these moves. Until recently, expectations had risen that the Fed could consider softening the pace of rate hikes amid what appeared to be relatively weak data points across key growth and housing market indicators. However, at the Jackson Hole conference, Fed Chair Powell was at pains to emphasise the fight with inflation remained the primary priority, for now. In our view, the Fed is likely to stay the course on tightening policy for the rest of 2022 and our investment committee believes policy rates are likely to rise to 3.75% by year-end.
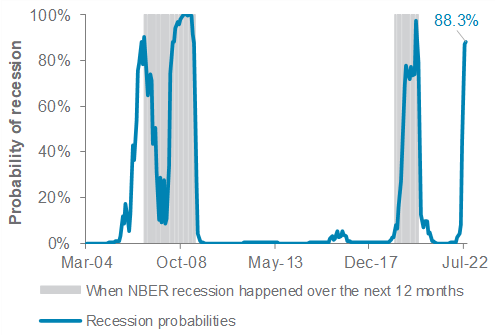
Does this make an economic recession more likely, and by extension, does this mean there are continued downside risks to equity markets? Our (quantitative) recession indicator has spiked, causing us to believe the risks of a US economic recession in the next 12 months continue to rise. However, whether this translates into significant and sustained equity and HY bond market losses from here is less clear-cut.
Fig.1 A US recession in the next 12 months is widely anticipated…
Our quantitative US recession probability indicator
Bear market rally?
The bearish argument rests on three factors: (i) equities usually bottom only when central bank policy changes direction; (ii) the size and speed of the US equity rally since mid-July bears similarities to normal bear market rallies, with ‘lower lows’; and (iii) valuations have not become outright cheap even as earnings downgrades remain ahead of us.
Having said that, a more bullish view argues that (i) Fed rate expectations are now above the so-called ‘neutral’ level, which is likely to make the Fed more sensitive to weaker growth data later this year or in early 2023, especially if this comes against clearer signs of an inflation peak; (ii) investor positioning in equities remains low; and that (iii) a binary recession indicator does not tell us anything about the depth or length of any recession. On this last point, while a very inflation-focused Fed risks hiking rates excessively, it also creates more room to cut rates quickly and sizeably in need.
To balance this out, we retain equities as a core holding, relative to bonds and cash, preferring to focus on opportunities across regions and sectors within equities. Asia ex-Japan equities remain preferred; we view the underperformance since July as an opportunity to add exposure, given Chinese policy remains pro-growth. We also retain UK equities as preferred given attractive valuations and dividend yield. We have reduced Euro area equities to less preferred as the energy shock adds downward pressure on earnings growth. Among sectors, we retain a Value bias, with exposure to energy and financials globally, and defensive exposure in the US and Euro area through healthcare.
Reducing credit risks
Within bonds, we seek to take advantage of the recent rally in risk assets to go further up the quality scale. US/Euro HY bonds have performed well since mid-July and we take the opportunity to close our preferred view on them, rebalancing towards IG corporate bonds, which we raise to a core holding. While we recognise that a still-hawkish Fed means US government bond yields could still rise modestly from here, we believe any rise is likely to be contained to c.3.50% on the 10-
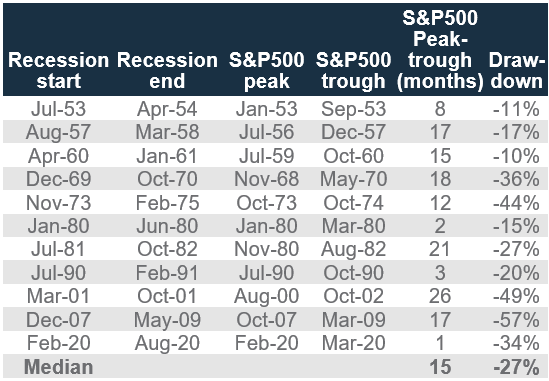
Fig.2 …and the 17% drop in S&P500 YTD suggests equity markets have priced that in by a large extent
US equity market drawdowns during past recessions
year yield. This, together with today’s higher yields and rising recession risks, also means IG bonds offer a more attractive risk/reward balance than before.
This leaves Asia USD bonds as our preferred sub-asset class in bonds, a view we believe remains justified by still-attractive yields for what is a predominantly IG asset class. Similar to US/Euro HY bonds, though, we take the opportunity to close our preferred view on Asia HY bonds. While yields remain attractive, policy efforts to stabilise the property development sector, a significant weight in Asia HY, have thus far not gone to the extent that our more constructive scenarios envisaged.
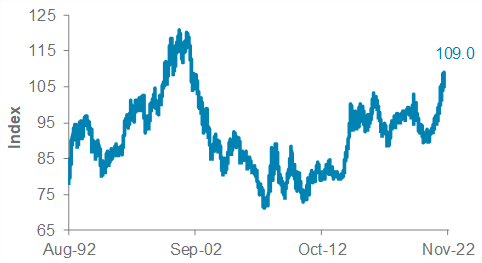
Upside risks for USD in the short term
We continue to see the USD facing very divergent short-term (three-month) and long-term (12-month) scenarios. Over the upcoming 1-3 months, the EUR is likely to face further weakness as the energy price shock hurts real bond yields. Given its significant weight in the USD indices, this naturally introduces an upside bias in the USD over the short term. Having said that, on a longer-term (12-month) basis, we believe this intensifies the USD’s over-valuation, making it more vulnerable to an eventual slowing of Fed rate hike expectations, while other global central banks tighten. This causes us to retain a bearish long-term view on the USD.
Fig.3 USD carries upside risks in the short term, but long term, it is not far from multi-decade highs
USD Index (DXY)
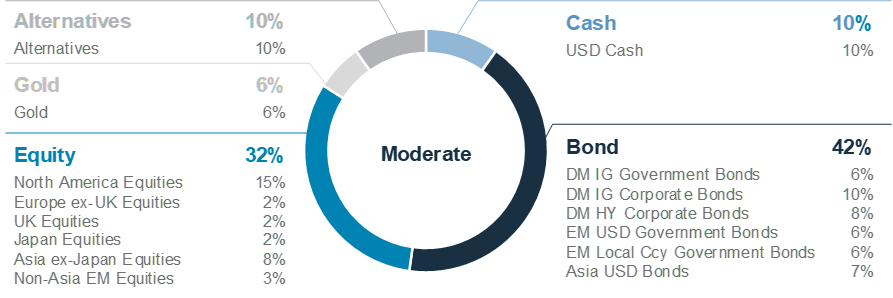
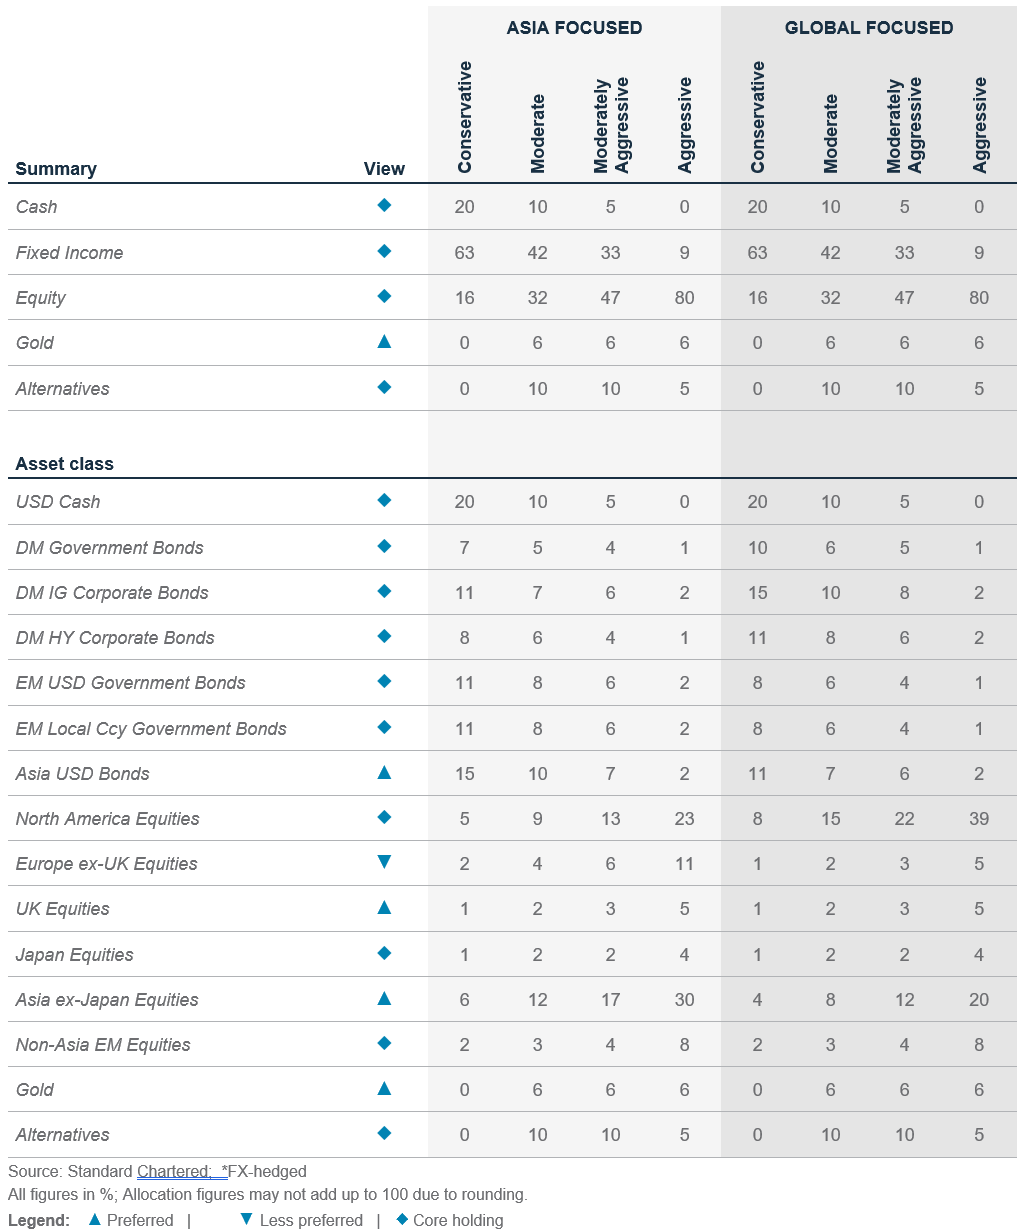
Foundation: Tactical asset allocation
Global* allocation model for a moderate risk profile
Multi-asset income allocation model for a moderate risk profile
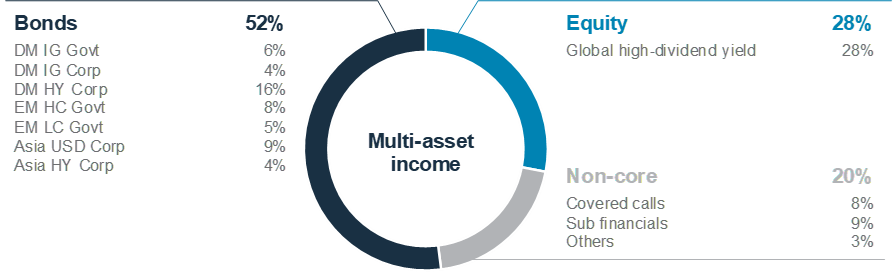
Perspectives on key client questions
|
Are all bear markets the same?
The odds of a US recession have increased markedly over the past two months. Our quantitative recession model now indicates an 88% probability (up from 45%) of a recession over the next 12 months, driven by a slowdown in leading indicators (LEI) and a continued inversion of the 10y2y yield curve. Contrast that with the Fed’s or the National Bureau of Economic Research (NBER) recession indicators, which indicate a much lower chance of recession; how do investors make sense of these contradictions?
The NBER and Fed recession probabilities are estimated based on a set of economic statistics, which are released and revised with a lag, with the latest readings from Fed model based on data as of 30 June 2022. In contrast, our quantitative recession model draws input from real-time market indicators. These signals may be noisier but generally, when probability spikes above 50%, it is a good time to start worrying.
For investors, the more important question to ask is what might the next recession look like and what are the implications for different assets? Would a recession result in a mild market pullback or something more severe since steep declines in stock markets often coincide with severe economic downturns?
A review of history suggests the following: (i) Bear markets caused by economic imbalances or financial bubbles tend to be long-lasting and the most damaging as they are not easily resolved by conventional policy tools; (ii) event-driven bear markets caused by one-off shocks (COVID-19 and wars) tend to be sharp, but short-lived; and (iii) cyclical bear markets are the most common of the three and are part and parcel of economic cycles as central banks tighten policy in response to rising inflation. The US economy will eventually succumb to a recession at some point over the coming years. But, if history is any guide, losses from cyclical bear markets, while sharp, can be relatively swift to recover. Here, we review a list of assets investors can complement their portfolio with during a significant equity market drawdown.

Fig. 4 Cyclical bear markets are the most common, but structural bear markets last the longest
Average S&P500 drawdown, duration and recovery duration by bear market type since 1960s
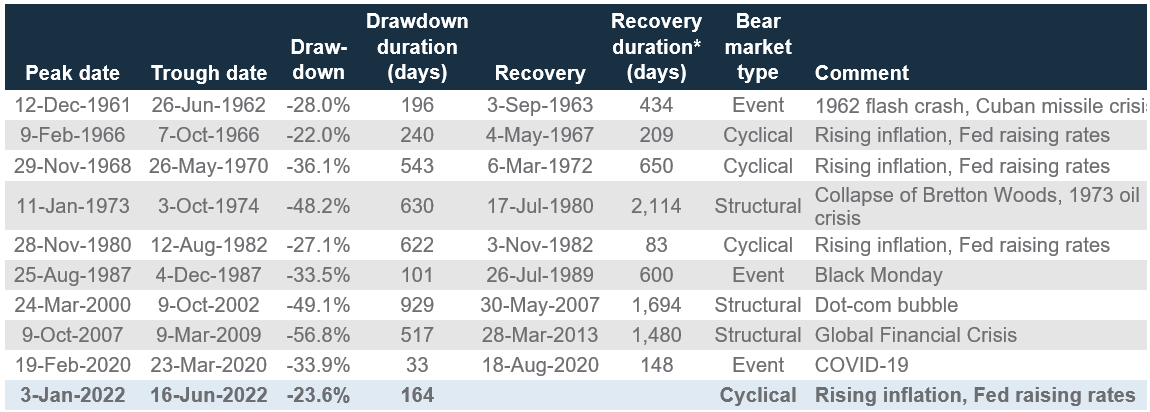
Source: Goldman Sachs, Bloomberg, Standard Chartered
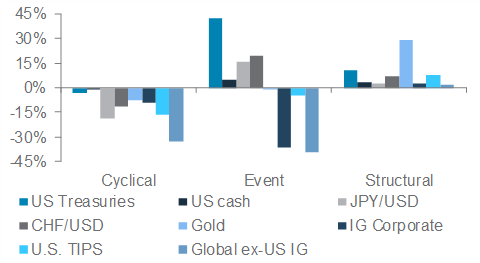
Inclusion of safe-haven assets
Preservation of capital is key during a bear market. Among traditional safe-havens, USD cash is the most reliable in mitigating losses. It is the only refuge for investors during cyclical bear markets, where rising yields pose headwinds to both rate-sensitive bonds and gold, while supporting a firmer USD – similar to today’s environment.
But cash’s relative stability comes at a cost. It takes cash, on average, more than a month to achieve the same returns S&P500 manages in a week. Returns also lag inflation, which means that in real terms, a large cash allocation could result in significant losses. Investors should weigh the advantages of cash against its opportunity costs and adjust allocation according to one’s risk tolerance and investment objectives.
Fig. 5 Cash, the only refuge during cyclical bear markets
Average annualised returns across different bear markets
Quality bonds a good hedge, most of the time
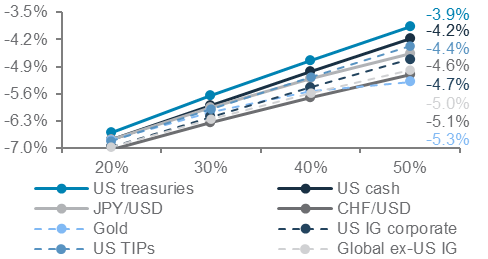
Relative to cash, high quality US government bonds are arguably more versatile. They provide positive returns two-thirds of the time during declines in US equities, but also capture some upside recovery. A 30% allocation to US government bonds has historically provided similar downside protection as a 40% allocation in gold. It also delivers positive returns across most bear markets, with the exception of cyclical or inflationary bears (during the 1970s and early 2022). With bond yields back above 3%, US government bonds are starting to look interesting once again as a portfolio diversifier, though the risk from a more hawkish Fed remains.
Fig. 6 A 30% allocation to US government bonds confers similar protection to 40% allocation in gold
Conditional value-at-risk (a measure of tail risk) of portfolios with increasing allocation to safe-haven asset
Gold, less shiny during cyclical bears, but offers potential portfolio benefits
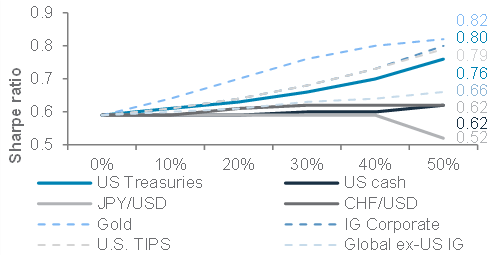
The safe-haven characteristics of gold and safe-haven currencies are not as consistent as cash, TIPS or US government bonds. However, gold’s low correlation to equities provides diversification benefits, and a potential to participate in the ensuing upside recovery, given half its demand comes from jewellery, which tends to rise during improving economic conditions. It is also a good hedge for structural bear markets.
Fig. 7 Gold provides better risk-adjusted returns compared with other safe-haven currencies
Sharpe ratio of portfolios with increasing allocation to safe-haven assets
Source: Bloomberg, Standard Chartered
Waiting out the recovery through dividend strategies
Almost all stocks tend to decline in a bear market. However, high dividend equities can be a source of income and relative stability during equity market drawdowns. In months when the VIX equity market volatility index increases by more than 10 points, dividend equities typically outperform the broader market indices. It is also one way to await a recovery, while getting paid (through dividends) especially in the late stages of any market decline. Hence, dividend strategies tend to weather bear markets better than the broad equity markets.
Focus on the bigger picture
A bear market will test the resolve of even the most resolute investors. Selling out entirely during a drawdown is just as risky as being fully invested during a bear market. Few investors can expect to reliably time markets. Investors who sell during a drawdown will most likely miss out on sharp rallies that tend to follow bear markets, reducing their long-term returns. Similarly, one who stays overinvested in equities will subject the portfolio to unnerving drawdowns.
Ensuring one’s portfolio has a diversified “foundation” allocation (which includes exposure to different asset classes) is important to build resilience in a bear market. The inclusion of safe-haven assets to an existing portfolio is one way to mitigate bear market losses, while remaining invested. The bigger picture: Every bear market in the past has been followed by a bull market, so they represent opportunities to buy on the cheap, in hindsight.
Our thematic ideas
|
Key themes
Below we provide a brief overview of our open thematic ideas, coupled with some recent highlights.
The winds of climate change
While markets remain volatile on the back of hawkish central bank sentiment, our climate-related themes have rebounded since our July Global Market Outlook. More notably, we see our cleantech sub-theme outperforming global equities by c.5% since our July Outlook publication. Valuations and earnings revisions suggest a near-term muted outlook for climate-related themes, however structural drivers that we highlight below continue to remain supportive.
Higher rates and elevated inflation remain a key market narrative. With all the attention focused on bringing down inflation, President Biden introduced the Inflation Reduction Act (IRA,) which is aimed at reducing climate-related social costs and making prices more stable via a clean energy transition. An estimated investment of USD 369bn is planned to increase cleaner energy production and reduce carbon emissions by 40% by 2030 via measures such as including tax credits for zero-carbon power plants, incentives for electric vehicles (EV) and the construction of domestic clean energy manufacturing facilities.
The structural drivers for climate are reinforced by supportive government actions, such as the IRA, and the existing energy crisis in Europe that will continue to accelerate the trend towards clean energy. While rising bond yields remain a near term headwind, we continue to see opportunities for long-term investors to average in within climate themes on pullbacks.
Embracing a digital future
Mirroring gains in the broader US market, the cybersecurity sub-theme managed to notch its second consecutive month of gains and trim YTD losses to 21%. Investor sentiment has turned the corner, with net inflows into relevant US-listed ETFs poised to turn positive for the first time in three months. Earnings revisions have likewise continued to rebound off their 2-year lows, with more than 75% of companies in the Nasdaq CTA Cybersecurity Index revealing earnings surprises in the most recent reporting quarter. This compares favourably to the Nasdaq Composite Index, which only saw slightly more than half of its index members reporting earnings surprises.
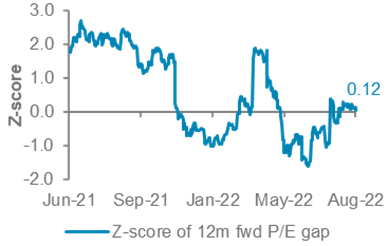
On the valuation front, while 12-month forward P/E has slipped to 32.7x, the sector’s historical valuation gap relative to the Nasdaq Composite Index has instead risen to a more neutral territory. This indicates that relative to the Nasdaq
Composite Index, the sector is likely fairly valued following months of undervaluation.
However, we remain positive on the sub-theme, given the sector’s relative resilience to an economic downturn due to entrenched cybersecurity spending plans and changes in regulatory requirements. Proposed regulations by the SEC on cybersecurity disclosure are also now in the “final rule stage,” despite ongoing disagreements in the business community on its implementation.
Fig. 8 Valuation of the cybersecurity sector is at the neutral territory after months of relative undervaluation
Z-score (the number of standard deviations from the mean) of the 12m forward P/E gap between the Nasdaq CTA Cybersecurity Index and Nasdaq Composite Index
China’s ‘Common Prosperity’
Buffeted by downbeat consumer sentiment and deteriorating business cycle indicators, sub-themes within China’s “Common Prosperity” saw their second consecutive month of losses. Despite the near-term outlook remaining fragile, we remain positive on Chinese renewables, in particular the New Energy Vehicles (NEV) sector, which should benefit from further policy easing by the PBoC, given the sector’s sensitivity to interest rates.
Sales of NEVs have otherwise remained brisk. More than 590,000 NEVs were sold in July, an annual growth of 119% and representing almost 25% of all automobile sales for the month. The front-loading of purchases ahead of an expected end to subsidies in 2023 is likely to continue supporting demand in the coming months, allowing total sales for the year to reach analysts’ estimates of c.5.5m units.
Solar installation has similarly continued to make progress despite the rising polysilicon prices. The National Energy Administration of China (NEA) recently announced that 54.75 GW of renewable energy was installed in H1 2022, a 137.4% annual growth over the same period last year.
Macro overview – at a glance
Summary
|
Key themes
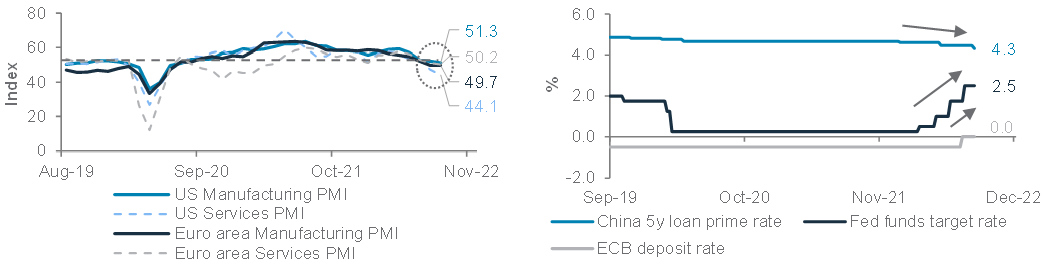
Economic activity in the US and Euro area has continued to slow as tighter monetary and fiscal policies, and multi-decade high inflation, dampen business and consumer confidence, despite robust job markets. At the Fed’s annual Jackson Hole retreat, Fed and ECB officials signalled their willingness to continue tightening monetary policy, even at the expense of growth, until near-term inflation sustainably declines for a few months. Thus, we now expect the Fed funds target rate to end the year at 3.75% (vs. 3.25% previously) and continue to expect the ECB deposit rate to end at 0.5-0.75%. Our probabilities of a recession in the US and Euro area in the next 12 months have also risen to 50% and 60%, respectively.
In contrast with the US and Europe, China continues to ease monetary and credit policies to revive growth after relaxing some COVID-19 restrictions. China’s service sector activity recovered for the second straight month in July, but manufacturing activity slowed again amid weakening global demand, resurgent COVID-19 waves in some regions and power shortages due to droughts in southern China. While a full reopening of the economy is unlikely before the Communist Party Congress in October, we expect authorities to continue lowering borrowing costs to accelerate infrastructure projects and relaxing some property sector measures to revive housing demand. We also expect more targeted measures to stimulate domestic consumption.
Key chart
We expect US and European policymakers to continue tightening monetary policy until inflation falls sustainably; in contrast, China is likely to continue easing its policy
Fig. 9 US, Europe continue to tighten policy despite slowing activity; China is easing
US and Euro area PMIs; Fed, ECB and PBoC benchmark policy rates
Macro factors to watch
- Impact on job markets as major central banks target inflation: The main message from Jackson Hole was that most Developed Market (DM) central banks, except for the BoJ, remain singularly focussed on taming inflation sustainably back to their 2% target, even if growth slows significantly in the coming months. In essence, central banks are ready to accept higher jobless rates in a bid to reduce wage pressures and consumption and, ultimately, subdue long-term inflation expectations. Thus, job market data, including initial jobless claims and monthly jobless rate numbers in the US and Europe, will be key indicators to watch in the coming months, besides m/m inflation trends. In the US, the jobless rate may have to rise above the Fed’s estimated long-run 4% rate, from the current 50-year low of 3.5%, before it pauses rate hikes.
- China’s property market revival. While we remain constructive on China’s policy-driven economic recovery, a continued slump in the housing market is a key risk given the sector’s linkages with consumer sentiment and domestic demand. With global growth slowing sharply, a revival of domestic consumption is likely to be a key part of the government’s growth revival strategy. The latest 19-point policy package, which coincided with a reduction in a key interest rate used for mortgages, is a sign that authorities are focused on reviving the property sector. Specifically, we expect more rate cuts, a further relaxation of down-payment requirements for buying second homes and greater funding support for selected developers. We are also closely watching the energy shortages in southern China (especially the Sichuan province), caused by severe droughts that have disrupted manufacturing activity.
- Europe’s energy crisis: European gas prices surged in August after a series of pipeline maintenance shutdowns by Russia’s Gazprom. However, Germany could reach its goal of 85% storage capacity by early September, a month earlier than planned. Also, EU gas inventories have surpassed 2021 highs, despite an 80% cut to the Nordstream supply. EU’s reduced reliance on Russia could ease concerns about energy shortages this winter.
Asset Classes
Bonds – at a glance
|
|
||||
Key themes
Bond yields have rebounded since mid-August amid waning expectations of a dovish monetary policy pivot by global central banks. The Fed’s Jackson Hole retreat reinforced the view that central banks are likely to keep tightening policy for a while. We maintain our 12-month target for the US 10-year government bond yield at c.3.25%, with a slight upward bias since June.
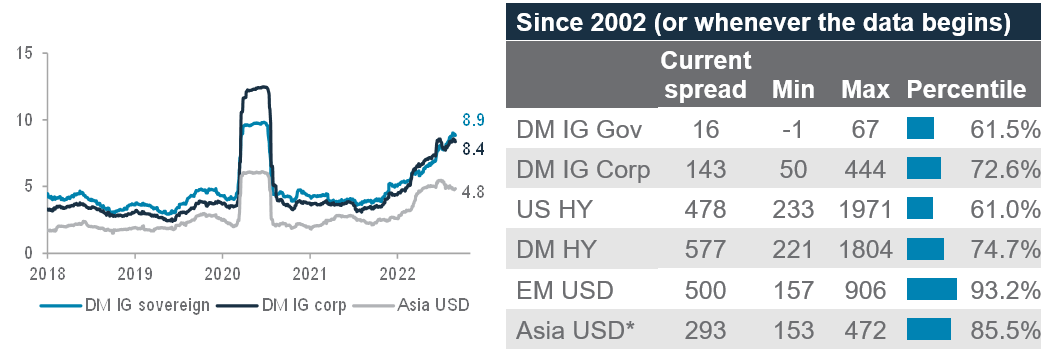
Asia USD bonds remain a preferred holding as we continue to see more policy relaxation in China. Although pandemic lockdowns remain a risk, we expect China’s economic growth to accelerate in H2 2022. The high average credit quality (mostly Investment Grade [IG] ratings) and relatively lower interest rate risk compared with other bond asset classes support our view.
We close our preferred view on Developed Market (DM) High Yield (HY) corporate bonds, taking advantage of the recent rally in risk assets, moving them to a core holding. We also move up the credit quality curve, upgrading DM IG corporate bonds to a core holding from less preferred, since we believe their risk-reward balance has grown more attractive due to higher yields.
Key chart
Asia USD bonds are our top pick among bonds due to their high credit quality, attractive yields and lower volatility than IG bond asset classes
Fig. 10 Asia USD bonds offer an attractive yield by historical standards, with relatively lower volatility compared with IG bonds
90d price volatility in DM IG sovereign bonds, DM IG corporate bonds and Asia USD bonds; Current and historical min/max spreads and percentile of various bond asset classes
How should bond investors position in the current market environment?
The US 10-year government bond yield has rebounded from the 1 August close of 2.57%, driving yields of other major bond asset classes higher, after major global central banks reiterated their hawkish policy bias with an aim to bring inflation back down to their long-term targets.
As the tussle between the hawkish central bank policy and slowing economic data will likely last for a while, we believe the 10-year US government bond yield is likely to hover around 3.25%, with a modest upside risk in the next 12 months.
In this scenario, we prefer Asia USD bonds among major bond asset classes due to their attractive yield, high credit quality (mostly IG) and relatively lower interest rate risk when compared with other major bond asset classes. In addition,
we view China’s ongoing policy loosening and the prospect of an economic recovery in the coming quarters as positive for Asia USD bonds. Asia HY bonds have rallied over the past month amid some positive developments in the distressed Chinese property sector. However, with the property sector outlook still weak, we would take this opportunity to close our preferred view on Asia HY bonds and, instead, lift exposure to IG bonds.
Among DM corporate bonds, risky assets have rallied substantially in recent weeks. We take this opportunity to reduce our exposure to DM HY corporate bonds. On the other hand, the latest surge in bond yields, especially for DM IG corporate bonds (in the US and Europe), offers an attractive opportunity to add exposure to higher quality debt, and thus improve the credit quality of our overall allocation amid growing headwinds to the global economy.
Equity – at a glance
|
|
||||
|
Key themes
Global equities remain a core holding on a 12-month horizon. We expect resilient US earnings, a potential peak in US inflation and a still healthy labour market to sustain investors’ long-term interest in risky assets.
Hawkish narratives by global central banks, however, may dampen sentiment in the near term. We downgraded Euro area equities to less preferred due to spiking energy prices which are likely to hurt consumer confidence and threaten profit margins.
Asia ex-Japan remains our preferred market – the region’s valuations are relatively undemanding, with its 12-month forward P/E ratio at a 17% discount to global equities. Although China equities have underperformed since July amid geopolitical tensions and concerns about the property sector, there has been progress in talks between US and China authorities on information disclosure for Chinese ADRs. Moreover, China has continued to step up its policy support, with further liquidity injection into its property market, which we believe will support China and Asia ex-Japan equity market sentiment in the near term.
Key chart
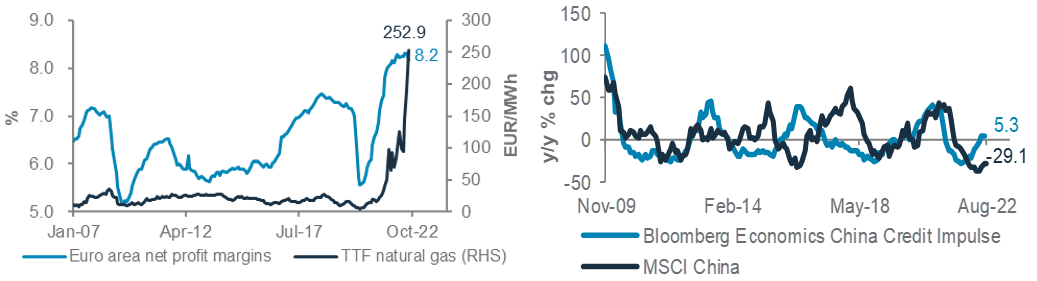
The spike in energy costs is likely to put Euro area equities under pressure. Meanwhile, China’s improving credit impulse should support Asia ex-Japan and China equities
Fig. 11 Profit margins are likely to come under pressure for Euro area equities with the spike in energy prices, in our view; we expect improving credit impulse in China to enable Asia ex-Japan and China equities to outperform global equities
Consensus 12m forward net profit margins for MSCI EMU and Dutch TTF natural gas prices; Bloomberg economics China credit impulse and MSCI China index, y/y % changes
Still fighting inflation; but not in China
The Fed and ECB continue to focus on fighting inflation with tighter monetary policies. We expect interest rates to continue rising in the US, which poses a headwind to equity valuations. However, this is balanced by resilient earnings growth, supporting US equities to perform in line with global equities, in our view.
However, in the Euro area, rising interest rates are likely to dampen growth, while sharply higher energy prices, as Russian gas supplies dwindle, keep inflation high. These are likely to put earnings growth under pressure in the Euro area. Hence, we downgrade Euro area equities from core holding to less preferred as we expect the Euro area to underperform global equities the next 6-12 months. Any resolution to the Russia-Ukraine conflict is an upside risk to this view.
We continue to prefer Asia ex-Japan equities, underpinned by China’s policy support and reasonable valuations. Instead of inflation, China is fighting a growth slowdown with pro-growth policies, even as it maintains strict COVID-19 restrictions. We
expect more policy measures, including rate cuts, in the coming months to support the real estate sector, consumption growth and infrastructure spending. Asia ex-Japan equities remain attractively valued, with consensus 12-month forward P/E at a 17% discount to global equities (average discount is 11% historically). We expect Asia ex-Japan and China to outperform global equities in the next 6-12 months.
Besides Asia ex-Japan, we also have a preferred view of UK equities. Compared with global equities, the UK equity market has a heavier weight in sectors we like, such as energy (lagging the oil price and earnings rebound) and financials (higher rates supporting higher interest income). The UK remains attractively valued, with consensus 12-month forward P/E at a 35% discount to global equities (average discount is 13% historically). It also offers among the highest dividend yields globally, at 4.3%. The transition in political leadership and weakness in oil prices would be key risks to UK equities.
We also expect Japan equities to perform in line with global equities in USD terms.
FX – at a glance
|
|
||||
Key themes
We remain bearish on the USD on a 6-12 month horizon. Over the past few weeks, the Fed’s laser sharp focus on fighting inflation has led markets to price in more rapid Fed rate hike expectations. The tougher Fed stance, combined with greater US and global growth concerns, led to the USD benefitting from safe-haven demand (as evidenced by stretched positioning) and the DXY testing its 20-year highs.
While we expect the USD to strengthen modestly over the next three months, multiple factors argue we may be close to a potential cyclical peak in the USD – i) Markets may be close to pricing in peak Fed hawkishness, with market-implied peak Fed Fund rate being close to 3.8%, (ii) other major central banks, including the ECB, RBA and BoE, are likely to hike rates at a faster pace than the Fed over the next 12 months, leading to narrowing of interest rate differentials against the USD, (iii) capital flows are likely to rotate away from the US, owing to more attractive valuations, and (iv) increased political uncertainty in the US ahead of the mid-term elections is likely to weigh on the USD.
The key risks to our view, which could trigger further USD strength, include (i) stronger-than-expected US economic growth and consumer sentiment which may result in the Fed delaying potential rate cuts beyond mid-2023, which are being currently priced in by the market, (ii) economic weakness in key regions, such as Europe and China, which may increase the allure of US assets as a safe-haven, and (iii) any sharp escalation in geopolitical tensions.
From a technical perspective, DXY is testing its 20-year high of 109.3; a break higher could lead to a test of 111.3 over the next few weeks. However, any break below 107.4 would add confidence that the USD downtrend could accelerate towards 105.75.
Key chart
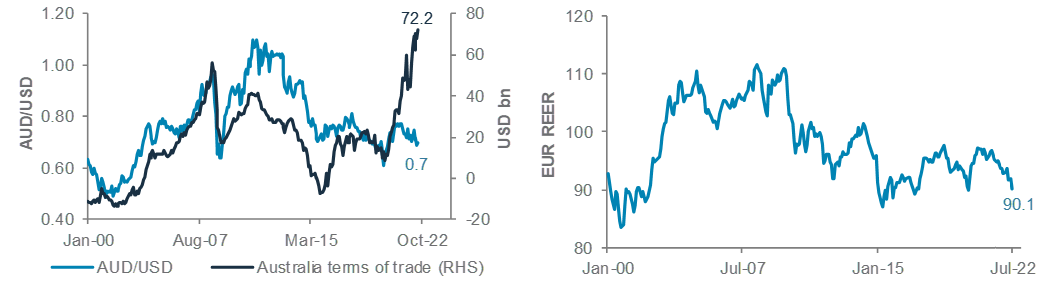
We expect the AUD to strengthen owing to hawkish RBA stance and a strong Terms of Trade; the EUR is undervalued from a fundamental perspective. A more hawkish ECB, clarity around energy security and eventual normalisation of trade balance are likely to push the EUR higher
Fig. 12 Fundamentals argue for AUD and EUR strength over the next 12 months
AUD/USD and Australia Terms of Trade; EUR REER Index
What are your key currency convictions?
We remain bullish on the EUR, AUD, NZD and CAD on a 12-month horizon. We scale back our bullish stance on the GBP.
High inflation, slowing growth, reduced energy security and potential Eurozone instability have been the key headwinds for the EUR over the past few months. While these are unlikely to fade soon, we see a few encouraging developments: (i) Germany recently said its gas reserves were at higher-than-expected levels, and the EU is reportedly considering intervening in its energy market to dampen elevated power costs; (ii) simultaneously, ECB guidance has turned more hawkish, with markets assigning a high probability of a 75bps rate hike in September. Hence, while we do not rule out a test of 0.95 and 0.96 supports in the near term, on a 12-month horizon, we expect the EUR to rise towards 1.035 and 1.050.
In recent months, the AUD has decoupled from fundamentals, as the currency has diverged from the strong Terms of Trade (a proxy for net exports) given the elevated concerns around Chinese commodity demand. However, with the RBA likely to remain hawkish over the next few quarters and interest rate differentials firmly in favour of the AUD, we expect the currency to appreciate over the next three and 12 months.
However, we have scaled back our bullish stance towards the GBP. While we still expect the GBP to appreciate modestly over the next 12 months, it faces headwinds from elevated inflation and weak growth, besides political uncertainty until a new UK prime minister is chosen. The new leader will then need to confront the challenges of post-Brexit EU relations and call for a Scottish independence vote. A re-test of the 1.14 low is possible before a long-term rally towards 1.21.
Gold, crude oil – at a glance
|
|
||||
Key themes
We continue to view gold as preferred, with its portfolio diversifier characteristics being a key factor. The possibility of modestly higher US bond yields and upside risks to the USD remain risks in the short term, but gold has proven itself as an attractive diversifier in the event the pullback in risk assets has further to go. In the longer term, though, we believe an eventual USD and US bond yield peak should prove supportive for the precious metal, especially if the USD turns notably lower.
Oil prices went through a period of softness as rising recession fears drove expectations of weakening demand. However, we remain more constructive. While some short-term measures of demand remain relatively weak, supply remains a concern amid the possibility of restricted Russian supplies and an OPEC signal of discomfort with lower prices. The possibility of a US-Iran deal remains a wildcard that could improve the supply situation, but the possibility of new supplies via such an agreement remains finely balanced, in our view.
Key chart
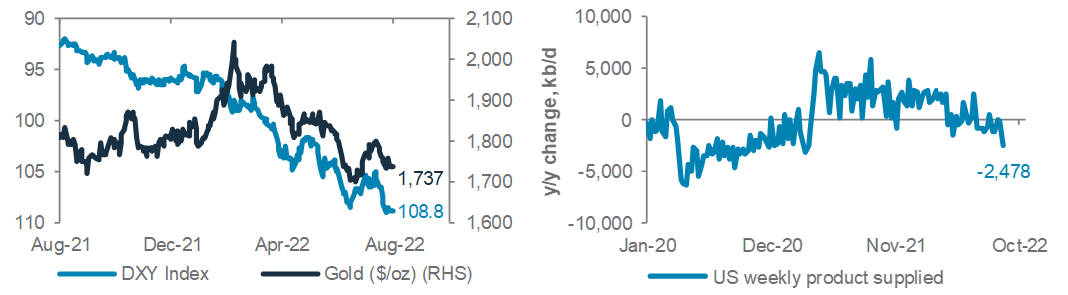
Gold remains an attractive portfolio diversifier, in our assessment, though an easing of USD pressure would help unlock upside.
Worries of weaker demand remain part of the oil narrative, but we believe key upcoming risks may sit on the supply side.
Fig. 13 The USD remains a limiting factor for gold; US oil demand has softened recently, but upcoming risks remain on the supply side.
LHS chart: Gold vs USD Index (DXY, inverse)
RHS chart: US EIA weekly product supplied (a demand measure; y/y kbpd)
Gold holds its own against headwinds
A hawkish Fed that remains focused on fighting inflation remains one potential challenge for gold given the likelihood of modestly higher bond yields and upside risks to the USD are both factors that traditionally work against gold.
Having said that, our long-term preference for gold continues to be led by its portfolio diversifier characteristics. Historically, gold has done well in the initial stages of equity volatility, which could prove valuable should the pullback in risk assets have further to go. Any rebound in geopolitical risk can also be a positive driver, especially if the US and Iran fail to achieve a deal.
In the longer term, we expect an eventual peak in US bond yields and the USD should remove two key headwinds for the precious metal, with an eventual turn lower in the USD likely to be one driver. In the shorter term, while we retain an upward bias, gold prices could hold in a range as upward pressure from risk asset volatility runs up against an upwards bias in bond yields and the USD.
Oil: Supply, the long-term challenge
Oil prices initially extended declines, with WTI prices moving to test the key technical support level of USD82/bbl, as worries over the possibility of demand destruction amid recession fears dominated the narrative. However, these quickly reversed following OPEC signals that it was not comfortable with the price weakness.
We remain constructive on oil prices and expect WTI to move back above USD 100/bbl on a 6-12 month horizon. While we acknowledge downside risks to demand as US recession risks rise, unless the recession is unusually deep, supply factors are likely to continue to be a key swing factor. OPEC retains relatively limited spare capacity and upcoming EU sanctions on Russian oil are likely to be a looming constraint. The possibility of a US-Iran deal remains the wildcard that could alter the outlook. However, we believe the chances of achieving such a deal remain finely balanced.
Quant perspective
US market risk model – bullish bond
|
Bearish equity but bullish bond risks
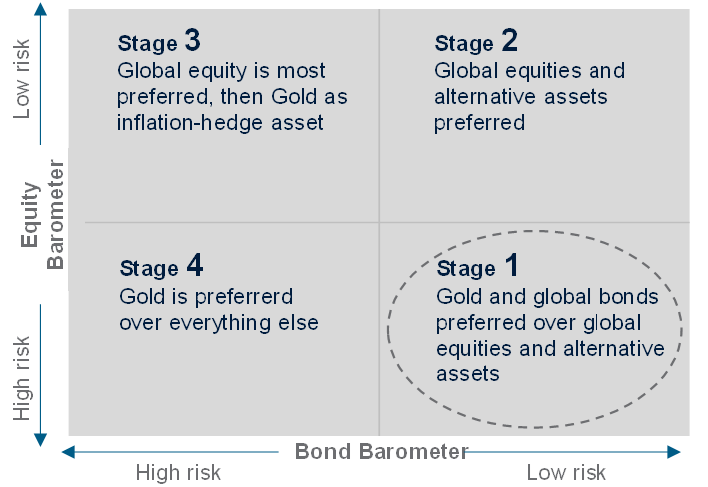
Our US Equity-Bond Market Risk (EBMR) models the downside risks in US equities and the US 10-year government bonds. It uses 11 economic and market factors to create equity and bond risk barometers. If the value of a barometer falls below 50, it signals higher downside risks and vice versa.
The US EBMR model remains in Stage 1 since July as the model started to anticipate lower downside risks to US government bonds. The model’s equity barometer continues to point to heightened US equity market risks, unfazed by the short-term rally in the S&P500 index. Meanwhile, the model, after accurately capturing c.2.1% rise in US government bond yield since Aug-2020, continues to expect limited upside risks since it changed its view last month. This implies a low likelihood of a steep rise after witnessing c.50bps rise in the US 10-year government bond yield already in August.
Fig. 14 EBMR bearish on equity and bond market risks
US equity and bond market risk barometers
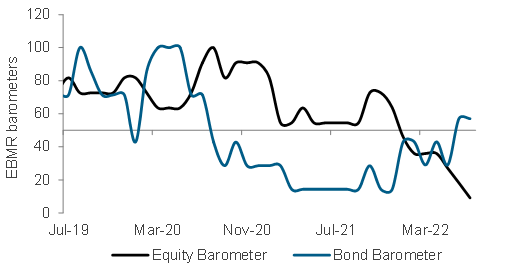
The equity barometer consists of 11 equity indicators. In August, the barometer worsened further from 18 to 9, due to slower growth. The deterioration this month is due to the negative turn in the 12-month momentum of industrial commodity prices, as it signals a potential slowdown in demand. With a combination of bearish equity signals, such as slowing growth and still elevated inflation, the equity barometer could remain below 50 for longer.
The bond barometer, which tracks six bond indicators, remains bullish after rising above 50 in July for the first time since Aug-2020. The barometer is currently supported by a slowdown in all its growth indicators (favours defensive assets such as bonds), which include commodity, prices, US housing starts, US capacity utilisation and the US PMI. Low jobless claims are currently the only negative factor for the bond barometer as a tight labour market provides ammunitions for the Fed to hike rates. But even so, US jobless claims have bottomed and been rising since March.
The model’s projections are skewed towards a recession scenario over the next two months and split between recession and recovery (Stage 2) for November and December. This implies US equities are still likely to face higher downside risk over the next few months, while high duration bonds could start seeing a bottom.
Implications on global assets
Data since 1999 suggest gold and bonds are preferred in Stage 1. The model’s preference for the asset is based on its long-term relationship with the market cycle, which favours gold and bonds as defensive assets in Stage 1.
Fig. 15 Scenarios over the coming months till December 2022 vs December 2021 (Outlook 2022) projections
Probability of the evolution of the financial market risk cycle from the current Stage 1 and preferred assets
Model’s estimated probabilities in December 2021
| Stage | Dec-21 | Jan-22 | Feb-22 | Mar-22 |
|---|---|---|---|---|
| 1 | 0% | 0% | 0% | 0% |
| 2 | 0% | 0% | 0% | 0% |
| 3 | 100% | 100% | 100% | 99% |
| 4 | 0% | 0% | 0% | 0% |
Model’s estimated probabilities in August 2022
| Stage | Sep-22 | Oct-22 | Nov-22 | Dec-22 |
|---|---|---|---|---|
| 1 | 96% | 81% | 57% | 53% |
| 2 | 0% | 6% | 41% | 45% |
| 3 | 0% | 3% | 1% | 1% |
| 4 | 4% | 9% | 1% | 0% |
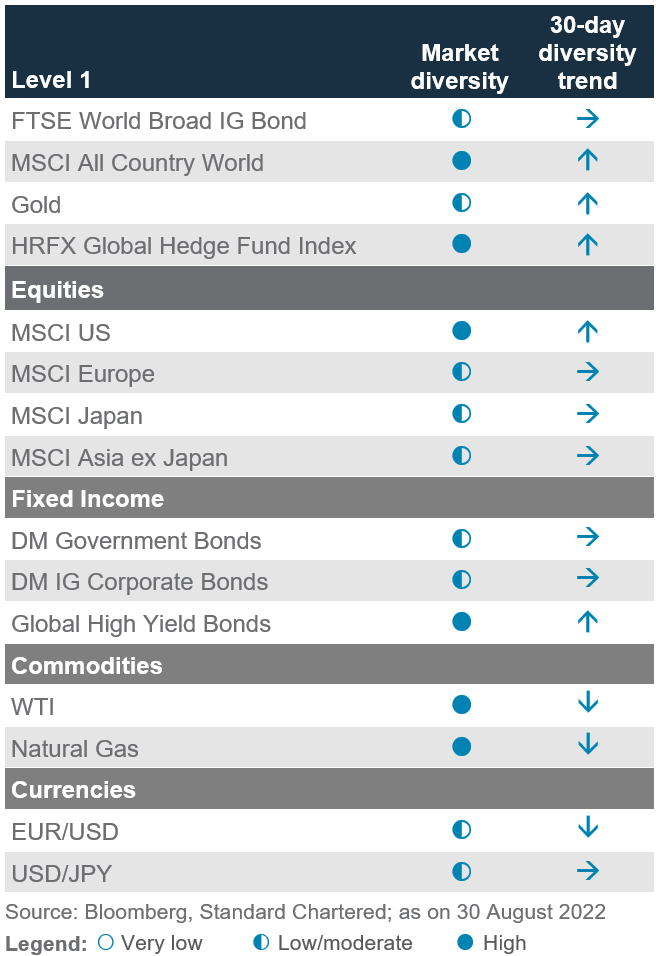
Tracking market diversity
|
About our market diversity indicators
Our market diversity indicators help to identify a potential change in short-term trends due to a fall in market breadth across equities, credit, FX and commodities. When market diversity falls, it implies either buyers or sellers are dominating, leading to a rapid rise or fall in asset prices. This is usually unsustainable and is likely to be followed by a slowdown or a reversal. Our diversity indicator is based on a statistical index called fractal dimension; a value below 1.25 serves as a guideline that prices are rising or falling too fast.
Where is diversity falling or rising this month?
Broad market diversity has declined steeply over the past two weeks as the recovery in both bonds and equities proved to be short-lived, while the USD has also resumed its uptrend. However, current level of market diversity across bonds, equities and currencies remains above the 1.25 threshold, implying the longer-term asset trends seen since the start of 2022 remain intact.
None of the equity markets we track are currently flashing oversold conditions. The rally between June and August for US, European and UK equities has helped balance out their previously narrowing diversity. Although their recent corrections have caused market diversity to narrow once again, it appears to be just a resumption of equity weakness seen since the start of 2022. Their current diversity is nowhere near a level that would readily warrant an immediate upward reversal in the near term.
Fig. 16 Average market diversity score by asset class
Diversity narrows steeply as 2022 trends resume
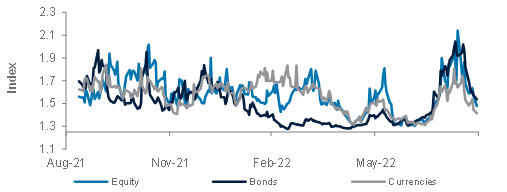
Fig. 18 Percentage of assets with diversity score <1.25
No red flags across key asset classes
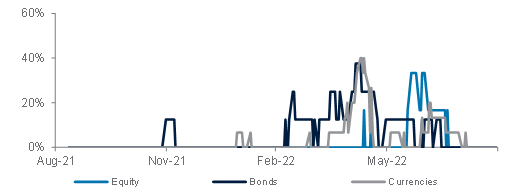
Diversity of bond markets has also declined after having a significant improvement last month as their weakness seen this year resumed. We previously highlighted a bullish view from the US EBMR model that the downside risk in bonds is likely limited going forward but cautioned against taking excessive exposure in the short term as uncertainty around monetary policy remains. With diversity of bond markets also sitting above the 1.25 threshold despite recent corrections, we remain cautious over the short term.
Fig. 18 Diversity across key assets
Performance Review
Foundation: Asset allocation summary
Market performance summary
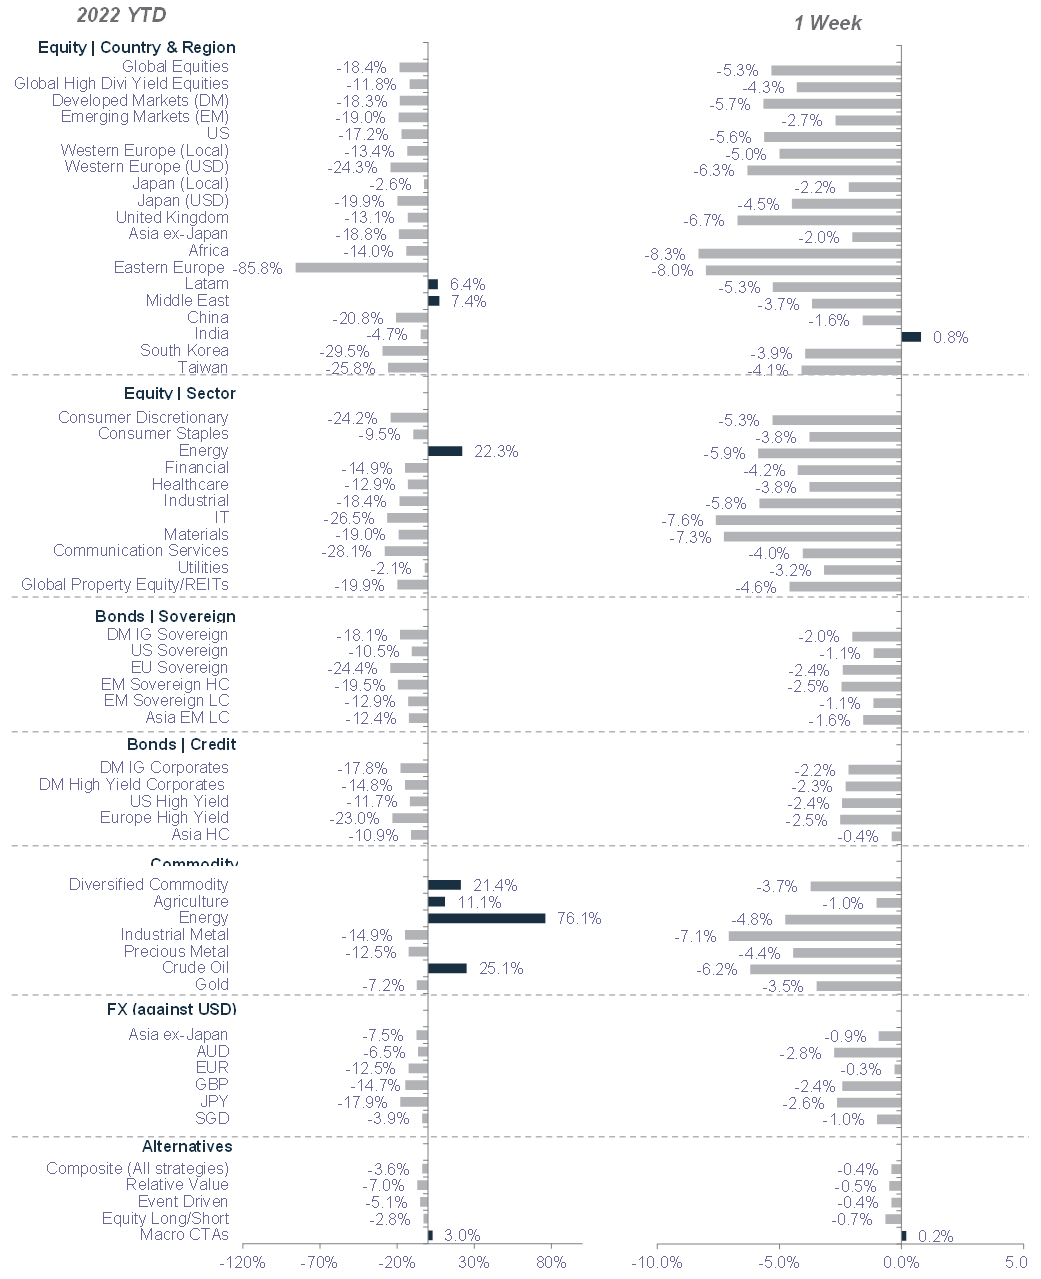
*All performance shown in USD terms, unless otherwise stated
*YTD performance data from 31 December 2021 to 01 September 2022 and 1 week-performance from 25 August 2022 to 01 September 2022
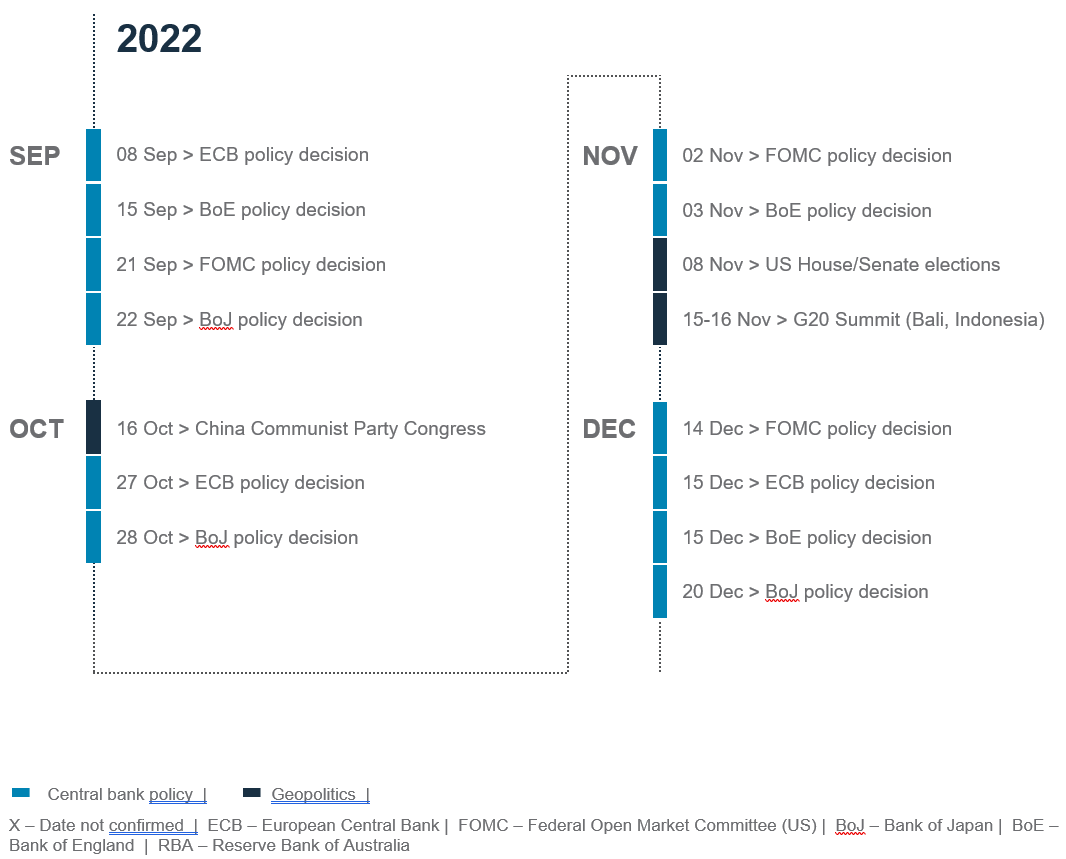
Key events
For more insights

Explanatory notes
1. The figures on page 5 show allocations for a moderate risk profile only – different risk profiles may produce significantly different asset allocation results. Page 5 is only an example, provided for general information only and they do not constitute investment advice, an offer, recommendation or solicitation. They do not take into account the specific investment objectives, needs or risk tolerances of a particular person or class of persons and they have not been prepared for any particular person or class of persons.
2. Contingent Convertibles are complex financial instruments and are not a suitable or appropriate investment for all investors. This document is not an offer to sell or an invitation to buy any securities or any beneficial interests therein. Contingent convertible securities are not intended to be sold and should not be sold to retail clients in the European Economic Area (EEA) (each as defined in the Policy Statement on the Restrictions on the Retail Distribution of Regulatory Capital Instruments (Feedback to CP14/23 and Final Rules) (“Policy Statement”), read together with the Product Intervention (Contingent Convertible Instruments and Mutual Society Shares) Instrument 2015 (“Instrument”, and together with the Policy Statement, the “Permanent Marketing Restrictions”), which were published by the United Kingdom’s Financial Conduct Authority in June 2015), other than in circumstances that do not give rise to a contravention of the Permanent Marketing Restrictions.
Disclosure
This document is confidential and may also be privileged. If you are not the intended recipient, please destroy all copies and notify the sender immediately. This document is being distributed for general information only and is subject to the relevant disclaimers available at our Standard Chartered website under Regulatory disclosures. It is not and does not constitute research material, independent research, an offer, recommendation or solicitation to enter into any transaction or adopt any hedging, trading or investment strategy, in relation to any securities or other financial instruments. This document is for general evaluation only. It does not take into account the specific investment objectives, financial situation or particular needs of any particular person or class of persons and it has not been prepared for any particular person or class of persons. You should not rely on any contents of this document in making any investment decisions. Before making any investment, you should carefully read the relevant offering documents and seek independent legal, tax and regulatory advice. In particular, we recommend you to seek advice regarding the suitability of the investment product, taking into account your specific investment objectives, financial situation or particular needs, before you make a commitment to purchase the investment product. Opinions, projections and estimates are solely those of SC at the date of this document and subject to change without notice. Past performance is not indicative of future results and no representation or warranty is made regarding future performance. The value of investments, and the income from them, can go down as well as up, and you may not recover the amount of your original investment. You are not certain to make a profit and may lose money. Any forecast contained herein as to likely future movements in rates or prices or likely future events or occurrences constitutes an opinion only and is not indicative of actual future movements in rates or prices or actual future events or occurrences (as the case may be). This document must not be forwarded or otherwise made available to any other person without the express written consent of the Standard Chartered Group (as defined below). Standard Chartered Bank is incorporated in England with limited liability by Royal Charter 1853 Reference Number ZC18. The Principal Office of the Company is situated in England at 1 Basinghall Avenue, London, EC2V 5DD. Standard Chartered Bank is authorised by the Prudential Regulation Authority and regulated by the Financial Conduct Authority and Prudential Regulation Authority. Standard Chartered PLC, the ultimate parent company of Standard Chartered Bank, together with its subsidiaries and affiliates (including each branch or representative office), form the Standard Chartered Group. Standard Chartered Private Bank is the private banking division of Standard Chartered. Private banking activities may be carried out internationally by different legal entities and affiliates within the Standard Chartered Group (each an “SC Group Entity”) according to local regulatory requirements. Not all products and services are provided by all branches, subsidiaries and affiliates within the Standard Chartered Group. Some of the SC Group Entities only act as representatives of Standard Chartered Private Bank and may not be able to offer products and services or offer advice to clients.
Copyright © 2024, Accounting Research & Analytics, LLC d/b/a CFRA (and its affiliates, as applicable). Reproduction of content provided by CFRA in any form is prohibited except with the prior written permission of CFRA. CFRA content is not investment advice and a reference to or observation concerning a security or investment provided in the CFRA SERVICES is not a recommendation to buy, sell or hold such investment or security or make any other investment decisions. The CFRA content contains opinions of CFRA based upon publicly-available information that CFRA believes to be reliable and the opinions are subject to change without notice. This analysis has not been submitted to, nor received approval from, the United States Securities and Exchange Commission or any other regulatory body. While CFRA exercised due care in compiling this analysis, CFRA, ITS THIRD-PARTY SUPPLIERS, AND ALL RELATED ENTITIES SPECIFICALLY DISCLAIM ALL WARRANTIES, EXPRESS OR IMPLIED, INCLUDING, BUT NOT LIMITED TO, ANY WARRANTIES OF MERCHANTABILITY OR FITNESS FOR A PARTICULAR PURPOSE OR USE, to the full extent permitted by law, regarding the accuracy, completeness, or usefulness of this information and assumes no liability with respect to the consequences of relying on this information for investment or other purposes. No content provided by CFRA (including ratings, credit-related analyses and data, valuations, model, software or other application or output therefrom) or any part thereof may be modified, reverse engineered, reproduced or distributed in any form by any means, or stored in a database or retrieval system, without the prior written permission of CFRA, and such content shall not be used for any unlawful or unauthorized purposes. CFRA and any third-party providers, as well as their directors, officers, shareholders, employees or agents do not guarantee the accuracy, completeness, timeliness or availability of such content. In no event shall CFRA, its affiliates, or their third-party suppliers be liable for any direct, indirect, special, or consequential damages, costs, expenses, legal fees, or losses (including lost income or lost profit and opportunity costs) in connection with a subscriber’s, subscriber’s customer’s, or other’s use of CFRA’s content.
Market Abuse Regulation (MAR) Disclaimer
Banking activities may be carried out internationally by different branches, subsidiaries and affiliates within the Standard Chartered Group according to local regulatory requirements. Opinions may contain outright “buy”, “sell”, “hold” or other opinions. The time horizon of this opinion is dependent on prevailing market conditions and there is no planned frequency for updates to the opinion. This opinion is not independent of Standard Chartered Group’s trading strategies or positions. Standard Chartered Group and/or its affiliates or its respective officers, directors, employee benefit programmes or employees, including persons involved in the preparation or issuance of this document may at any time, to the extent permitted by applicable law and/or regulation, be long or short any securities or financial instruments referred to in this document or have material interest in any such securities or related investments. Therefore, it is possible, and you should assume, that Standard Chartered Group has a material interest in one or more of the financial instruments mentioned herein. Please refer to our Standard Chartered website under Regulatory disclosures for more detailed disclosures, including past opinions/ recommendations in the last 12 months and conflict of interests, as well as disclaimers. A covering strategist may have a financial interest in the debt or equity securities of this company/issuer. This document must not be forwarded or otherwise made available to any other person without the express written consent of Standard Chartered Group.
Sustainable Investments
Any ESG data used or referred to has been provided by Morningstar, Sustainalytics, MSCI or Bloomberg. Refer to 1) Morningstar website under Sustainable Investing, 2) Sustainalytics website under ESG Risk Ratings, 3) MCSI website under ESG Business Involvement Screening Research for more information. The ESG data is as at the date of publication based on data provided, is for informational purpose only and is not warranted to be complete, timely, accurate or suitable for a particular purpose, and it may be subject to change. Sustainable Investments (SI): This refers to funds that have been classified as ‘Sustainable Investments’ by Morningstar. SI funds have explicitly stated in their prospectus and regulatory filings that they either incorporate ESG factors into the investment process or have a thematic focus on the environment, gender diversity, low carbon, renewable energy, water or community development. For equity, it refers to shares/stocks issued by companies with Sustainalytics ESG Risk Rating of Low/Negligible. For bonds, it refers to debt instruments issued by issuers with Sustainalytics ESG Risk Rating of Low/Negligible, and/or those being certified green, social, sustainable bonds. For structured products, it refers to products that are issued by any issuer who has a Sustainable Finance framework that aligns with Standard Chartered’s Green and Sustainable Product Framework, with underlying assets that are part of the Sustainable Investment universe or separately approved by Standard Chartered’s Sustainable Finance Governance Committee.
Country/Market Specific Disclosures
Botswana: This document is being distributed in Botswana by, and is attributable to, Standard Chartered Bank Botswana Limited which is a financial institution licensed under the Section 6 of the Banking Act CAP 46.04 and is listed in the Botswana Stock Exchange. Brunei Darussalam: This document is being distributed in Brunei Darussalam by, and is attributable to, Standard Chartered Bank (Brunei Branch) | Registration Number RFC/61 and Standard Chartered Securities (B) Sdn Bhd | Registration Number RC20001003. Standard Chartered Bank is incorporated in England with limited liability by Royal Charter 1853 Reference Number ZC18. Standard Chartered Securities (B) Sdn Bhd is a limited liability company registered with the Registry of Companies with Registration Number RC20001003 and licensed by Brunei Darussalam Central Bank as a Capital Markets Service License Holder with License Number BDCB/R/CMU/S3-CL and it is authorised to conduct Islamic investment business through an Islamic window. China Mainland: This document is being distributed in China by, and is attributable to, Standard Chartered Bank (China) Limited which is mainly regulated by National Financial Regulatory Administration (NFRA), State Administration of Foreign Exchange (SAFE), and People’s Bank of China (PBOC). Hong Kong: In Hong Kong, this document, except for any portion advising on or facilitating any decision on futures contracts trading, is distributed by Standard Chartered Bank (Hong Kong) Limited (“SCBHK”), a subsidiary of Standard Chartered PLC. SCBHK has its registered address at 32/F, Standard Chartered Bank Building, 4-4A Des Voeux Road Central, Hong Kong and is regulated by the Hong Kong Monetary Authority and registered with the Securities and Futures Commission (“SFC”) to carry on Type 1 (dealing in securities), Type 4 (advising on securities), Type 6 (advising on corporate finance) and Type 9 (asset management) regulated activity under the Securities and Futures Ordinance (Cap. 571) (“SFO”) (CE No. AJI614). The contents of this document have not been reviewed by any regulatory authority in Hong Kong and you are advised to exercise caution in relation to any offer set out herein. If you are in doubt about any of the contents of this document, you should obtain independent professional advice. Any product named herein may not be offered or sold in Hong Kong by means of any document at any time other than to “professional investors” as defined in the SFO and any rules made under that ordinance. In addition, this document may not be issued or possessed for the purposes of issue, whether in Hong Kong or elsewhere, and any interests may not be disposed of, to any person unless such person is outside Hong Kong or is a “professional investor” as defined in the SFO and any rules made under that ordinance, or as otherwise may be permitted by that ordinance. In Hong Kong, Standard Chartered Private Bank is the private banking division of SCBHK, a subsidiary of Standard Chartered PLC. Ghana: Standard Chartered Bank Ghana Limited accepts no liability and will not be liable for any loss or damage arising directly or indirectly (including special, incidental or consequential loss or damage) from your use of these documents. Past performance is not indicative of future results and no representation or warranty is made regarding future performance. You should seek advice from a financial adviser on the suitability of an investment for you, taking into account these factors before making a commitment to invest in an investment. To unsubscribe from receiving further updates, please send an email to feedback.ghana@sc.com. Please do not reply to this email. Call our Priority Banking on 0302610750 for any questions or service queries. You are advised not to send any confidential and/or important information to Standard Chartered via e-mail, as Standard Chartered makes no representations or warranties as to the security or accuracy of any information transmitted via e-mail. Standard Chartered shall not be responsible for any loss or damage suffered by you arising from your decision to use e-mail to communicate with the Bank. India: This document is being distributed in India by Standard Chartered in its capacity as a distributor of mutual funds and referrer of any other third party financial products. Standard Chartered does not offer any ‘Investment Advice’ as defined in the Securities and Exchange Board of India (Investment Advisers) Regulations, 2013 or otherwise. Services/products related securities business offered by Standard Charted are not intended for any person, who is a resident of any jurisdiction, the laws of which imposes prohibition on soliciting the securities business in that jurisdiction without going through the registration requirements and/or prohibit the use of any information contained in this document. Indonesia: This document is being distributed in Indonesia by Standard Chartered Bank, Indonesia branch, which is a financial institution licensed, registered and supervised by Otoritas Jasa Keuangan (Financial Service Authority). Jersey: In Jersey, Standard Chartered Private Bank is the Registered Business Name of the Jersey Branch of Standard Chartered Bank. The Jersey Branch of Standard Chartered Bank is regulated by the Jersey Financial Services Commission. Copies of the latest audited accounts of Standard Chartered Bank are available from its principal place of business in Jersey: PO Box 80, 15 Castle Street, St Helier, Jersey JE4 8PT. Standard Chartered Bank is incorporated in England with limited liability by Royal Charter in 1853 Reference Number ZC 18. The Principal Office of the Company is situated in England at 1 Basinghall Avenue, London, EC2V 5DD. Standard Chartered Bank is authorised by the Prudential Regulation Authority and regulated by the Financial Conduct Authority and Prudential Regulation Authority. The Jersey Branch of Standard Chartered Bank is also an authorised financial services provider under license number 44946 issued by the Financial Sector Conduct Authority of the Republic of South Africa. Jersey is not part of the United Kingdom and all business transacted with Standard Chartered Bank, Jersey Branch and other SC Group Entity outside of the United Kingdom, are not subject to some or any of the investor protection and compensation schemes available under United Kingdom law. Kenya: This document is being distributed in Kenya by, and is attributable to Standard Chartered Bank Kenya Limited. Investment Products and Services are distributed by Standard Chartered Investment Services Limited, a wholly owned subsidiary of Standard Chartered Bank Kenya Limited that is licensed by the Capital Markets Authority as a Fund Manager. Standard Chartered Bank Kenya Limited is regulated by the Central Bank of Kenya. Malaysia: This document is being distributed in Malaysia by Standard Chartered Bank Malaysia Berhad. Recipients in Malaysia should contact Standard Chartered Bank Malaysia Berhad in relation to any matters arising from, or in connection with, this document. Nigeria: This document is being distributed in Nigeria by Standard Chartered Bank Nigeria Limited, a bank duly licensed and regulated by the Central Bank of Nigeria. Standard Chartered accepts no liability for any loss or damage arising directly or indirectly (including special, incidental or consequential loss or damage) from your use of these documents. You should seek advice from a financial adviser on the suitability of an investment for you, taking into account these factors before making a commitment to invest in an investment. To unsubscribe from receiving further updates, please send an email to clientcare.ng@sc.com requesting to be removed from our mailing list. Please do not reply to this email. Call our Priority Banking on 01-2772514 for any questions or service queries. Standard Chartered shall not be responsible for any loss or damage arising from your decision to send confidential and/or important information to Standard Chartered via e-mail, as Standard Chartered makes no representations or warranties as to the security or accuracy of any information transmitted via e-mail. Pakistan: This document is being distributed in Pakistan by, and attributable to Standard Chartered Bank (Pakistan) Limited having its registered office at PO Box 5556, I.I Chundrigar Road Karachi, which is a banking company registered with State Bank of Pakistan under Banking Companies Ordinance 1962 and is also having licensed issued by Securities & Exchange Commission of Pakistan for Security Advisors. Standard Chartered Bank (Pakistan) Limited acts as a distributor of mutual funds and referrer of other third-party financial products. Singapore: This document is being distributed in Singapore by, and is attributable to, Standard Chartered Bank (Singapore) Limited (Registration No. 201224747C/ GST Group Registration No. MR-8500053-0, “SCBSL”). Recipients in Singapore should contact SCBSL in relation to any matters arising from, or in connection with, this document. SCBSL is an indirect wholly owned subsidiary of Standard Chartered Bank and is licensed to conduct banking business in Singapore under the Singapore Banking Act, 1970. Standard Chartered Private Bank is the private banking division of SCBSL. IN RELATION TO ANY SECURITY OR SECURITIES-BASED DERIVATIVES CONTRACT REFERRED TO IN THIS DOCUMENT, THIS DOCUMENT, TOGETHER WITH THE ISSUER DOCUMENTATION, SHALL BE DEEMED AN INFORMATION MEMORANDUM (AS DEFINED IN SECTION 275 OF THE SECURITIES AND FUTURES ACT, 2001 (“SFA”)). THIS DOCUMENT IS INTENDED FOR DISTRIBUTION TO ACCREDITED INVESTORS, AS DEFINED IN SECTION 4A(1)(a) OF THE SFA, OR ON THE BASIS THAT THE SECURITY OR SECURITIES-BASED DERIVATIVES CONTRACT MAY ONLY BE ACQUIRED AT A CONSIDERATION OF NOT LESS THAN S$200,000 (OR ITS EQUIVALENT IN A FOREIGN CURRENCY) FOR EACH TRANSACTION. Further, in relation to any security or securities-based derivatives contract, neither this document nor the Issuer Documentation has been registered as a prospectus with the Monetary Authority of Singapore under the SFA. Accordingly, this document and any other document or material in connection with the offer or sale, or invitation for subscription or purchase, of the product may not be circulated or distributed, nor may the product be offered or sold, or be made the subject of an invitation for subscription or purchase, whether directly or indirectly, to persons other than a relevant person pursuant to section 275(1) of the SFA, or any person pursuant to section 275(1A) of the SFA, and in accordance with the conditions specified in section 275 of the SFA, or pursuant to, and in accordance with the conditions of, any other applicable provision of the SFA. In relation to any collective investment schemes referred to in this document, this document is for general information purposes only and is not an offering document or prospectus (as defined in the SFA). This document is not, nor is it intended to be (i) an offer or solicitation of an offer to buy or sell any capital markets product; or (ii) an advertisement of an offer or intended offer of any capital markets product. Deposit Insurance Scheme: Singapore dollar deposits of non-bank depositors are insured by the Singapore Deposit Insurance Corporation, for up to S$100,000 in aggregate per depositor per Scheme member by law. Foreign currency deposits, dual currency investments, structured deposits and other investment products are not insured. This advertisement has not been reviewed by the Monetary Authority of Singapore. Taiwan: SC Group Entity or Standard Chartered Bank (Taiwan) Limited (“SCB (Taiwan)”) may be involved in the financial instruments contained herein or other related financial instruments. The author of this document may have discussed the information contained herein with other employees or agents of SC or SCB (Taiwan). The author and the above-mentioned employees of SC or SCB (Taiwan) may have taken related actions in respect of the information involved (including communication with customers of SC or SCB (Taiwan) as to the information contained herein). The opinions contained in this document may change, or differ from the opinions of employees of SC or SCB (Taiwan). SC and SCB (Taiwan) will not provide any notice of any changes to or differences between the above-mentioned opinions. This document may cover companies with which SC or SCB (Taiwan) seeks to do business at times and issuers of financial instruments. Therefore, investors should understand that the information contained herein may serve as specific purposes as a result of conflict of interests of SC or SCB (Taiwan). SC, SCB (Taiwan), the employees (including those who have discussions with the author) or customers of SC or SCB (Taiwan) may have an interest in the products, related financial instruments or related derivative financial products contained herein; invest in those products at various prices and on different market conditions; have different or conflicting interests in those products. The potential impacts include market makers’ related activities, such as dealing, investment, acting as agents, or performing financial or consulting services in relation to any of the products referred to in this document. UAE: DIFC – Standard Chartered Bank is incorporated in England with limited liability by Royal Charter 1853 Reference Number ZC18.The Principal Office of the Company is situated in England at 1 Basinghall Avenue, London, EC2V 5DD. Standard Chartered Bank is authorised by the Prudential Regulation Authority and regulated by the Financial Conduct Authority and Prudential Regulation Authority. Standard Chartered Bank, Dubai International Financial Centre having its offices at Dubai International Financial Centre, Building 1, Gate Precinct, P.O. Box 999, Dubai, UAE is a branch of Standard Chartered Bank and is regulated by the Dubai Financial Services Authority (“DFSA”). This document is intended for use only by Professional Clients and is not directed at Retail Clients as defined by the DFSA Rulebook. In the DIFC we are authorised to provide financial services only to clients who qualify as Professional Clients and Market Counterparties and not to Retail Clients. As a Professional Client you will not be given the higher retail client protection and compensation rights and if you use your right to be classified as a Retail Client we will be unable to provide financial services and products to you as we do not hold the required license to undertake such activities. For Islamic transactions, we are acting under the supervision of our Shariah Supervisory Committee. Relevant information on our Shariah Supervisory Committee is currently available on the Standard Chartered Bank website in the Islamic banking section For residents of the UAE – Standard Chartered Bank UAE does not provide financial analysis or consultation services in or into the UAE within the meaning of UAE Securities and Commodities Authority Decision No. 48/r of 2008 concerning financial consultation and financial analysis. Uganda: Our Investment products and services are distributed by Standard Chartered Bank Uganda Limited, which is licensed by the Capital Markets Authority as an investment adviser. United Kingdom: In the UK, Standard Chartered Bank is authorised by the Prudential Regulation Authority and regulated by the Financial Conduct Authority and Prudential Regulation Authority. This communication has been approved by Standard Chartered Bank for the purposes of Section 21 (2) (b) of the United Kingdom’s Financial Services and Markets Act 2000 (“FSMA”) as amended in 2010 and 2012 only. Standard Chartered Bank (trading as Standard Chartered Private Bank) is an authorised financial services provider (license number 45747) in terms of the South African Financial Advisory and Intermediary Services Act, 2002. The Materials have not been prepared in accordance with UK legal requirements designed to promote the independence of investment research, and that it is not subject to any prohibition on dealing ahead of the dissemination of investment research. Vietnam: This document is being distributed in Vietnam by, and is attributable to, Standard Chartered Bank (Vietnam) Limited which is mainly regulated by State Bank of Vietnam (SBV). Recipients in Vietnam should contact Standard Chartered Bank (Vietnam) Limited for any queries regarding any content of this document. Zambia: This document is distributed by Standard Chartered Bank Zambia Plc, a company incorporated in Zambia and registered as a commercial bank and licensed by the Bank of Zambia under the Banking and Financial Services Act Chapter 387 of the Laws of Zambia.