

28 August 2026
Global Market Outlook
It’s all about the yield
US bond yields are expected to be increasingly capped. Inflation concerns have room to recede, with shorter-maturity bonds most likely to benefit.
The bond yield outlook and renewed momentum in the AI theme are supportive of our Overweight view on US and Asia ex-Japan equities. The global financial sector is supported by a steeper yield curve.
|
|
We reinstate our Overweight stance on gold as USD weakness resumes. Emerging Market central bank demand provides long-term support for gold, while expected USD weakness adds a tailwind.
Do both the direction and level of real yields matter?
Is the macro outlook still supportive of higher rates?
Are quantitative models still bullish on equities?
Strategy
Investment strategy and key themes
|
|
||||
|

12m Foundation Overweights:
- Global equities, gold^
- US, Asia ex-Japan equities
- Emerging Market USD bonds
Opportunistic ideas – Equities
- Global: High dividend, power & electrification
- US: Communication services
- Euro area (EA): Banks^
- Asia: Hang Seng Tech, Japan banks, MSCI Taiwan
Top Global Sectors:
- US: Technology, communication services, financials
- EA: Financials, industrials
- Asia: Japan financials
Opportunistic ideas – Bonds
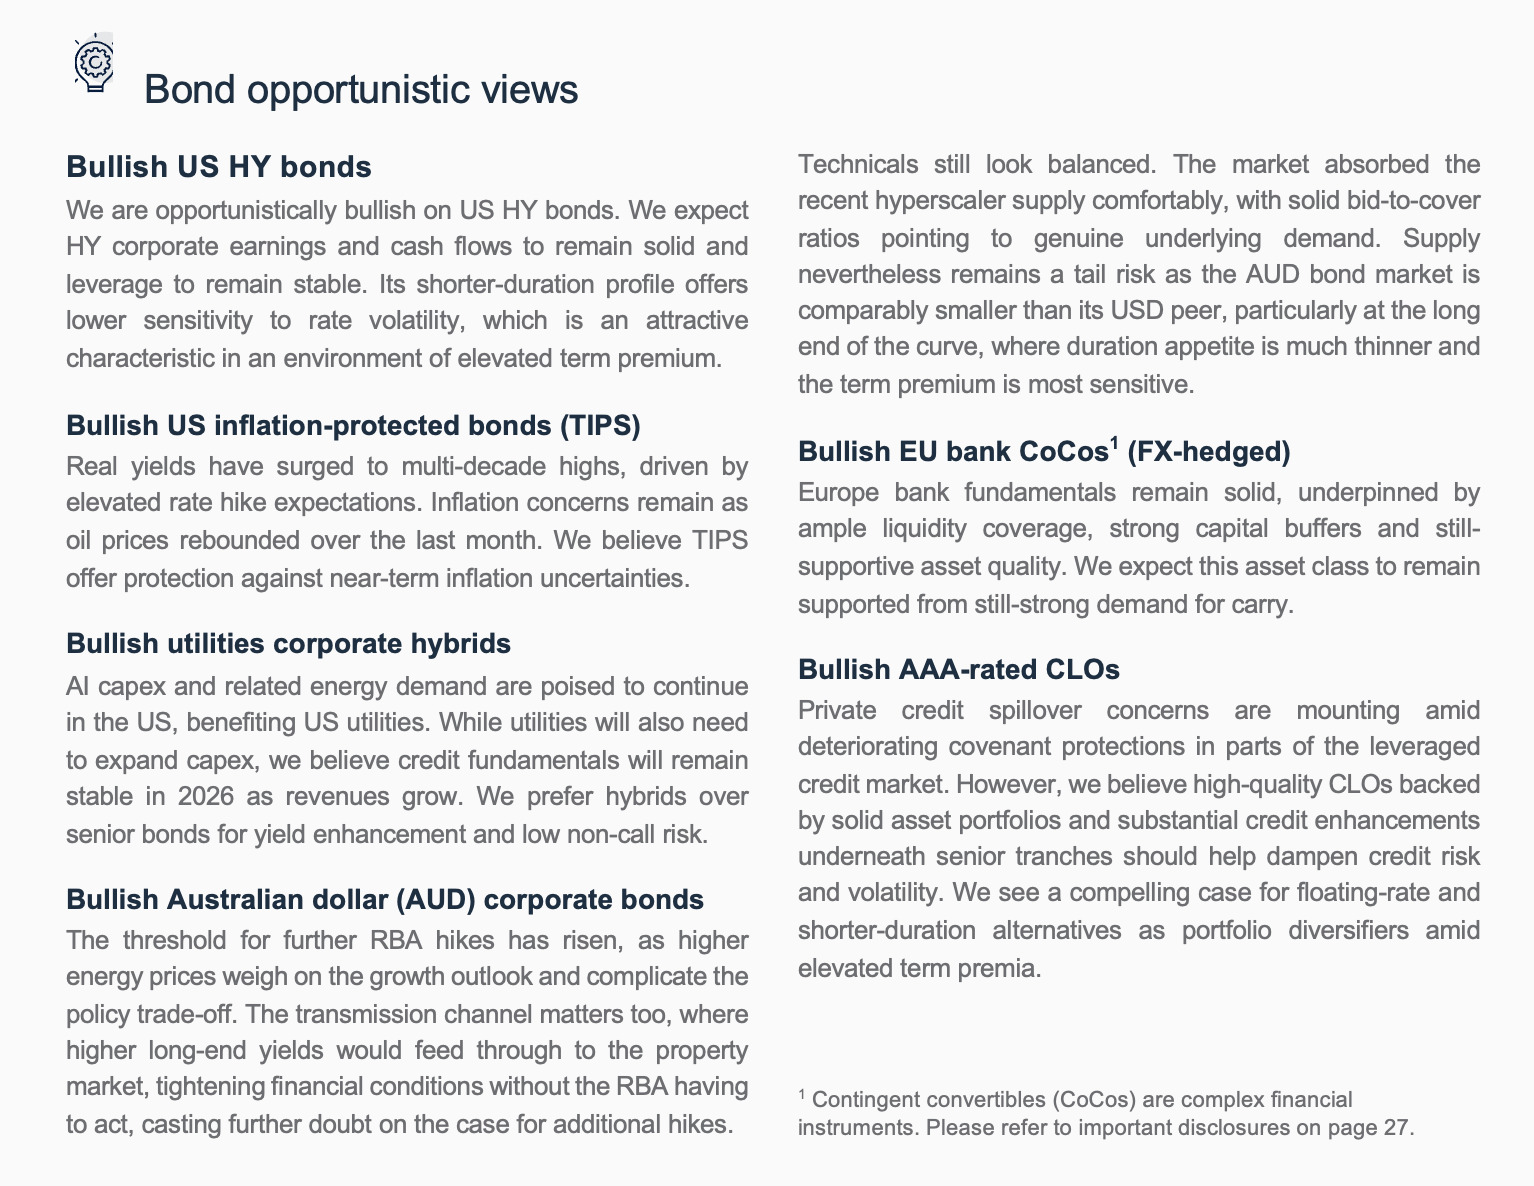
- US: Treasury Inflation-protected Securities (TIPS), AAA-rated collateralised loan obligations (CLOs), utilities sector hybrids, US High-yield (HY)
- EA: Bank AT1s FX-hedged
- Others: AUD corporates
^New
It’s all about the yield
- US bond yields are expected to be increasingly capped. Inflation concerns have room to recede, with shorter-maturity bonds most likely to benefit.
- The bond yield outlook and renewed momentum in the AI theme are supportive of our Overweight view on US and Asia ex-Japan (AxJ) equities. The global financial sector is supported by a steeper yield curve, while the AI theme’s momentum is resuming on positive monetisation signals.
- We reinstate our Overweight stance on gold as USD weakness resumes. Emerging Market (EM) central bank demand provides long-term support for gold, while expected USD weakness adds a further tailwind.
Inflation worries have room to recede
Risky assets have staged a rebound despite ongoing US bond yield worries. Global equities have risen, though gains were front-loaded in the very early part of August. The rise in longer-dated US yields paused, gold rebounded and the USD fell.
Inflation, debt levels and bond supply in the spotlight as long-term bond yields rise. The US 30-year government bond yield has risen by around 40-50bps this year, triggering a response from the US Treasury as it seeks to signal its desire to contain the rise. Inflation concerns remain commonly cited as a key driver behind the rise in yields. However, with the rise being disproportionately concentrated in longer-maturity yields, at least some of the concerns are likely to be related to the continued expansion of US national debt levels. Finally, several technical factors have also contributed to the rise – including the relative absence of some key sovereign buyers and significant hyperscaler bond issuance in the investment-grade (IG) corporate bond market.
We are less concerned about inflation and believe there is room for market worries to recede. The recent cooling in the US inflation data and a lacklustre job market point to less, rather than more, inflation risk ahead. Oil prices are a risk, of course, but we expect them to remain in a range around USD 90/bbl for now, provided there is no significant new escalation in the Middle East conflict. All of this suggests inflation – and thus bond yields – are more likely to move lower rather than higher from here, consistent with our expectation of a soft landing for the US economy.
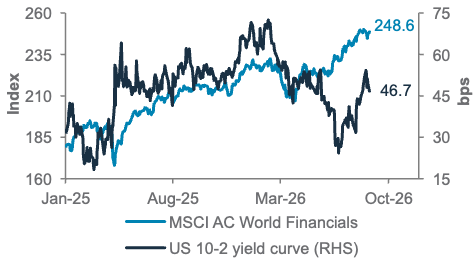
Fig. 1 A widening gap between long- and short-maturity bond yields supports financial sector equities
Global financial sector equities & US 10-2 yield curve
Keep bond duration contained
Favour 3-5-year bonds as yields soften and term premium widens. We expect the softening in bond yields to be most pronounced in relatively shorter-duration bonds, as the lack of renewed inflation fears helps ease concerns about Fed rate hikes. However, this impact is likely to be increasingly dampened on longer maturities (particularly beyond 10 years), as easing Fed rate hike concerns balance against concerns about US debt levels. We continue to see the 3-5-year duration as offering the most attractive risk/reward, though we would consider selectively adding to longer maturities should the 10-year yield spike (temporarily) above 4.75%.
Continue to favour corporate and EM bonds over G3 government bonds. While credit spread valuations remain elevated, we believe credit quality fundamentals continue to justify these levels. We remain Overweight EM USD government bonds due to fiscal fundamentals, but see most corporate and EM bonds as attractive sources of yield. US IG bonds, though, are expected to face excess supply pressures in the very short term from elevated hyperscaler debt supply.
Softening yield concerns positive for equities
A pricing out of Fed rate hike expectations would be supportive for equities; we stay Overweight. An easing of shorter-maturity US bond yields should prove supportive for equities if long-term yields remain capped. This would allow markets to continue focusing on what should continue to be strong earnings growth.
Financial sector an attractive route to broadening exposure. Financials remain a preferred sector across the US, Euro area and Japan markets. They are a direct beneficiary of a steeper yield curve (a widening gap between long- and short-maturity bonds) via expanding net interest margins (NIMs). We also like financials for the diversification they offer from an excessive concentration in the AI theme. This month, we have also opened a new opportunistic trade in Euro area financial sector equities.
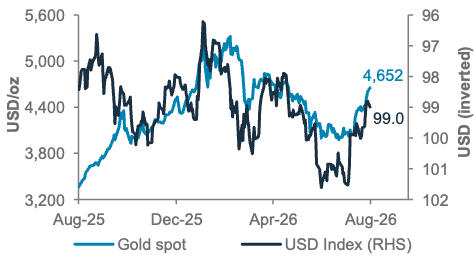
Fig. 2 Further USD weakness likely to support the next leg of gains in gold
Gold and USD Index (DXY)
Positive momentum in the AI theme to continue. Notwithstanding our preference for broadening exposure, positive momentum in the technology and AI sectors is expected to resume after around two months of underperformance relative to value-style sectors. While concerns over the magnitude of capex are likely to resurface from time to time, we believe improving AI monetisation indicators point towards continued sector outperformance.
Capped yields and earnings support our US and AxJ regional market Overweights. The combination of our bond yield and sector views supports our Overweight views on US and AxJ equities, as well as Core holding views on Japan and the Euro area. While the AI theme benefits US and AxJ equities, the financial sector should help drive performance across Japan and the Euro area, particularly if their central banks raise rates further, as we expect.
Trim India to a Core holding within AxJ. While we remain optimistic about the market’s potential to ultimately catch up with regional benchmarks, performance vs. the broader AxJ region remains challenged for now by continued flows towards AI-focused North Asian equity markets. Our Overweight view on China equities remains in place, given increasingly undemanding valuations.Reduce gold to a Core holding
Reinstating gold Overweight as USD weakens
We reinstate our Overweight stance on gold. The gold price outlook has notably improved alongside a sharp pullback in the USD and a technical break higher. We continue to see EM central bank demand as a long-term support for gold. In the near term, the still-high inverse correlation with the USD is proving to be a positive catalyst. Together, this argues for reinstating our Overweight gold view.
US policy intervention signals USD weakness ahead. Falling short-duration bond yields imply a gradual erosion of support for the USD. In addition, the signalling effect of the US Treasury’s limited intervention to help cap the rise in long bond yields is likely to result in an extension of USD weakness. Gold is expected to be one beneficiary of this, and most major currencies are expected to strengthen as a result.
Foundation asset allocation models
The Foundation and Foundation+ models are allocations that you can use as the starting point for building a diversified investment portfolio. The Foundation model showcases a set of allocations focusing on traditional asset classes that are accessible to most investors, while the Foundation+ model includes allocations to private assets that may be accessible to investors in some jurisdictions, but not others.
Fig. 3 Foundation asset allocation for a balanced risk profile
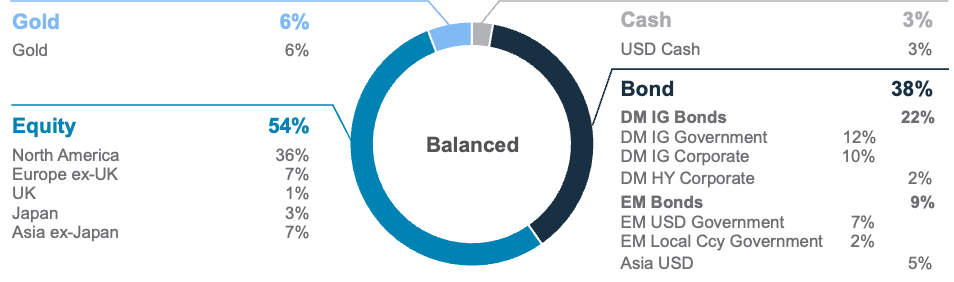
Fig. 4 Foundation+ asset allocation for a balanced risk profile
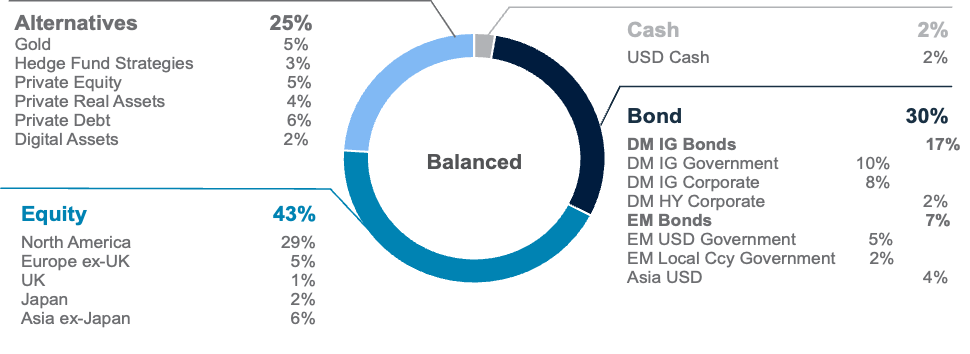
Fig. 5 Multi-asset income allocation for a moderate risk profile
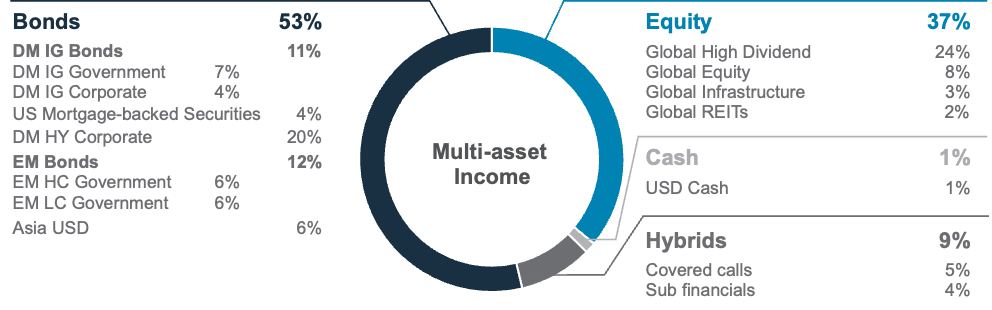
Source: Standard Chartered
Note: (i) Developed Market (DM) IG Bonds is an aggregate of DM IG Government and DM IG Corporate Bonds; (ii) EM Bonds is an aggregate of EM USD and EM Local Ccy Government Bonds
Foundation: Our tactical asset allocation views
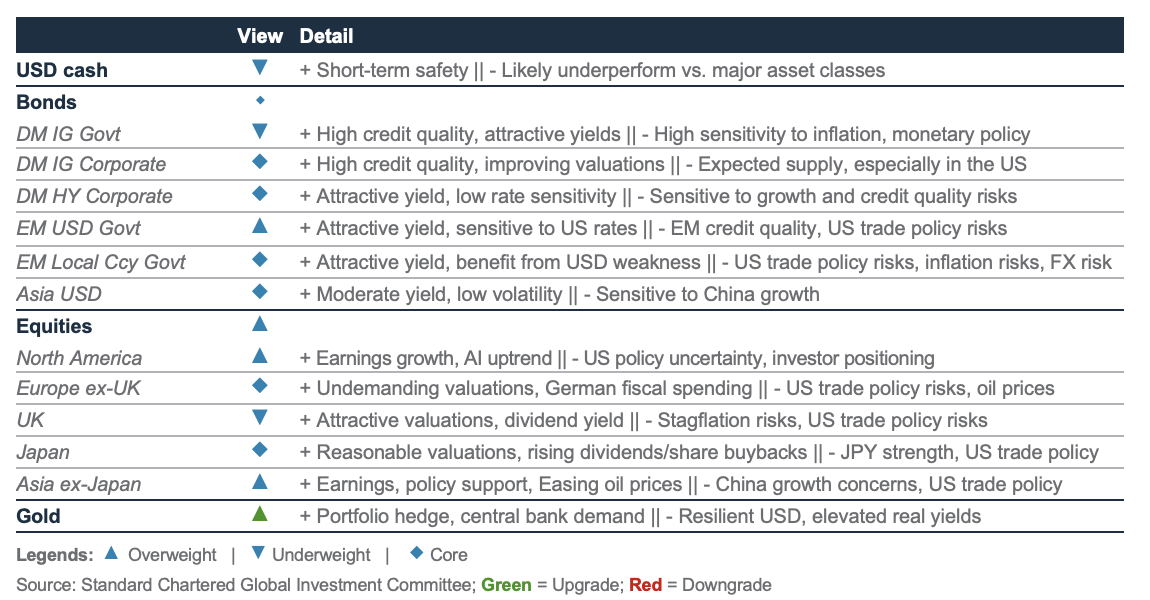
Fig. 6 Performance of our Foundation Allocations*

Source: Bloomberg, Standard Chartered; *12-month performance data from 26 August 2025 to 26 August 2026, Six-month performance from 26 February 2026 to 26 August 2026, Three-month performance from 26 May 2026 to 26 August 2026
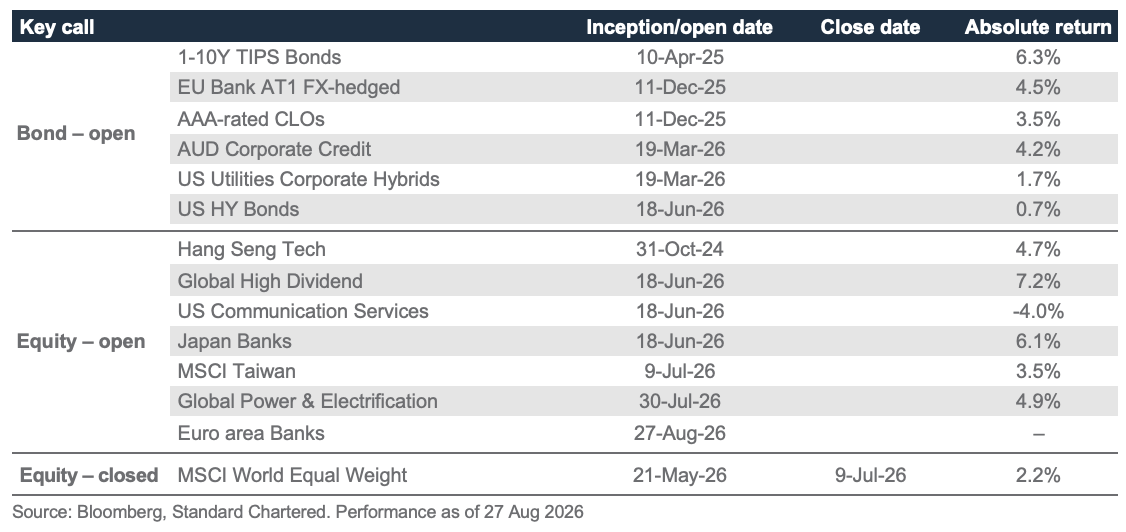
Fig. 7 Opportunistic ideas performance
Macro overview – at a glance
|
|
||||
Key themes
Core scenario (soft landing, 50% probability): We have slightly revised upward the probability of a soft landing from 45% by reducing the odds of a ‘no landing’. The global economy remains resilient despite this year’s oil shock. Business confidence picked up further in July. The US remains at the forefront of growth, driven by an acceleration in AI investment and wealth effect from a booming stock market. Fiscal easing in Germany and Japan is supporting growth. Meanwhile, inflation has likely peaked in the US in Q2, although it remains elevated in the Euro area and is likely to rise further in Japan. In this scenario, the Fed is likely to hold rates this year, the ECB is likely to deliver another ‘insurance’ hike in H2, while the BoJ should hike twice more this year. China, facing slowing growth, is likely to ease liquidity and accelerate fiscal spending in H2 to revive domestic demand.
Upside risk (no landing, 25% probability): We reduce the probability from 30% amid continued Middle East and Russia-Ukraine uncertainty ahead of the US mid-term elections. If oil prices ease, US tax cuts, an AI-fuelled stock market boom and fiscal easing in Germany and Japan could boost ‘animal spirits’. A global defence spending boom could also spur global growth.
Downside risk (25% probability): This tail risk scenario includes a 15% chance of recession, potentially caused by a prolonged blockade of the Hormuz strait, a stock market downturn negating the wealth effect or a bond sell-off due to inflation or debt concerns. We also assign a 10% chance to a stagflation scenario if the US-Iran conflict worsens and oil stays above USD 90/bbl.
Key chart
We expect the Fed to hold its policy rate for the rest of the year amid resilient growth and still elevated, but declining, inflation. The ECB is likely to deliver another insurance hike, while the BoJ is expected to hike twice more this year to counter rising inflation.
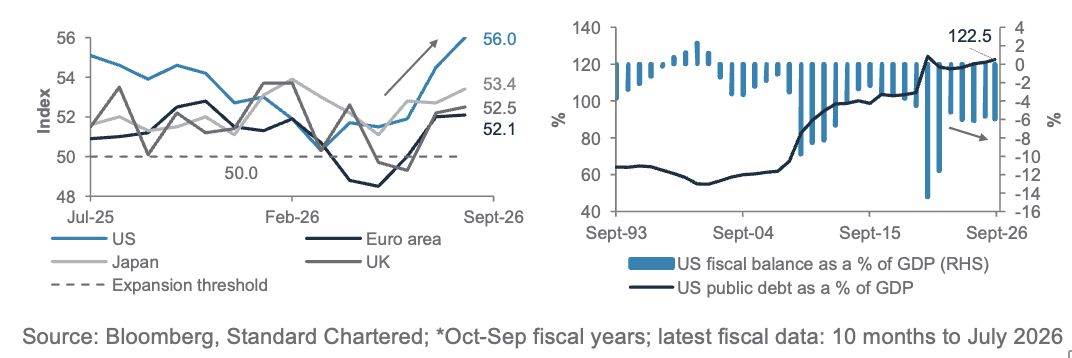
Fig. 8 Economic activity still resilient; rising US fiscal deficit is a medium-term risk
Composite Purchasing Managers’ Indices (PMIs); US total public debt, yearly fiscal balance*
Policy rates watch
Fed to keep rates on hold this year: The US economy is expanding at a healthy pace, driven by steady consumption and a continued AI-led investment boom, despite the oil shock caused by the Middle East conflict. Growth momentum is set to firm from Q2’s brief slowdown to 1.5% annualised growth, with Q3 consensus growth estimates at 2.4% and full-year 2026 growth around the economy’s 2% trend growth. The soft spot is the labour market – non-farm payrolls contracted 23,000 in July and the three-month trend has slipped to roughly 20,000 – leaving consumer spending increasingly dependent on wealth effects and a savings rate of just 3%.
Disinflation remains intact, with core CPI inflation easing for the second straight month to 2.5%. Unit labour costs at 1.4% confirm wages are contained. Statistical revisions to the way some professional services and computer software inflation is measured, due end-September, should retroactively lower the
Fed’s preferred core PCE inflation for the past five years, reinforcing the path towards 2% by 2027. Energy prices and further tariff pass-through remain the key upside risks.
Economic resilience without overheating vindicates the Fed’s July rates hold and argues for continued patience. A September hike now looks unlikely, unless Fed Chair Warsh succumbs to recent bond market pressure (his Jackson Hole speech will be closely watched). The Fed debate has shifted from ‘cut vs. hold’ to ‘hike vs. hold’, with three dissenters favouring tightening, citing prolonged above-target inflation.
The clearest risk sits in the bond market. The US 30-year bond yield touched 5.34%, its highest since 2007, driven by a USD 1.8trn fiscal deficit, national debt above USD 40trn, heavy AI-related bond issuance and a Fed refusing forward guidance. The Treasury’s doubled buyback programme is a drop in the bucket, which is unlikely to lower yields significantly until the structural issues are tackled.
ECB to deliver one more ‘insurance’ hike. The Euro area continues to defy bearish estimates. Q2 GDP expanded an above-trend 0.4% q/q, confirming that the bloc has weathered a Middle East energy shock better than feared. Growth was broad-based – Germany, France and Italy each grew 0.2-0.3%, Spain a robust 0.7% – and supported by domestic demand. Momentum has carried into Q3: the August composite PMI rose to 52.1 and private-sector lending is growing 3.9% y/y. 2026 forecasts nonetheless remain modest at 0.8%, amid softening employment in Germany and France.
Disinflation has stalled. July inflation remained elevated at 2.9% y/y and core at 2.5%. Headline inflation is likely to accelerate above 3% and peak in Q4, driven by oil around USD 90/bbl, gas above EUR 60/MWh and depleted energy storage. Pipeline pressures are building, with producer price pass-through incomplete. Yet, negotiated wages slowed in Q2 to 2.4%, consumer inflation expectations fell for the third month in July and second-round effects remain absent.
The ECB thus faces a near-term inflationary supply shock with rates near neutral. With ECB President Lagarde keeping a September rate hike on the table and officials arguing for pre-emptive action, we expect one more 25bps ‘insurance’ hike to 2.5% this year, then a pause as energy price pressures fade and inflation eases towards the ECB’s 2% target in 2027.
China to accelerate fiscal spending as growth slows. China’s economy remains bifurcated. Exports are booming – up 24% y/y in July, with computers and integrated circuits surging 67% and 117%, respectively, on AI-related demand – while domestic demand grinds lower. However, July data confirmed the softness in the economy the domestic economy first visible in Q2: manufacturing PMI fell to a five-month low of 49.2, services PMI hit a three-and-half-year low of 49.0 and local government special bond issuance slowed sharply. The property developer sentiment index fell to a six-year low. Investment is likely to contract further in H2. 2026 growth forecasts are near 4.6%, contingent on faster fiscal execution.
Price pressures remain subdued and imported rather than home-grown. Headline inflation eased to 0.5% y/y in July from 1.0%, core to 0.9% and PPI to 3.5% from 4.1% as oil prices
fell. Recent inflation has been driven by global commodity prices, with pass-through concentrated upstream. Overcapacity industries such as solar, EVs and cement remain in distress. A persistent supply-demand imbalance, aggravated by rapid AI adoption outpacing labour-market adjustment, should keep inflation structurally low.
China’s July Politburo signalled fine-tuning, not a pivot. Local governments lack revenue, and there is little appetite for a mega stimulus. Instead, we expect Beijing to deploy the CNY 2trn of already-authorised impulse, accelerate bond issuance and ease liquidity via a 25bps bank reserve ratio cut in H2.
BoJ to hike another 50bps to 1.5% by December: Japan’s expansion remains lopsided, but the risk of a sharp slowdown has faded. Q2 GDP grew 1.1% annualised, well below the 2.0% consensus and Q1’s 1.9%, with private consumption broadly flat, business investment down 1.2% and net exports contributing 0.5ppt largely on a temporary drop in energy imports. The external and corporate side, however, is strong. August manufacturing PMI rose to 55.1, while exports in July jumped 23% y/y, machine tool orders surged 50% and the Tankan pointed to a 11.5% rise in FY26 capex plans, all underpinned by AI-related demand. Consumption remains a weak link, though nominal wage growth at 3.4% and real wage growth at 1.6% keep income conditions supportive.
Underlying price pressures are building. Core inflation (ex-fresh food) accelerated to 1.8% y/y in July and ‘core core’ inflation (ex-fresh food and energy) to 1.9%. Government energy subsidies are flattering the headline, but firms are likely to pass higher wages, energy costs and yen weakness to consumers in the coming months. The BoJ itself projects FY26 ‘core core’ inflation at 2.5%, with risks skewed upward.
Hence, BoJ communication has turned decisively hawkish. Governor Ueda warned that FX now influences prices more than in the past and that delaying normalisation would force sharper action later. With USD/JPY near 160 despite the first joint US intervention since 1998, and Prime Minister Takaichi seemingly accepting the BoJ is behind the curve, we are raising our outlook to two hikes this year, from one, amid intensifying domestic inflation exacerbated by yen weakness.
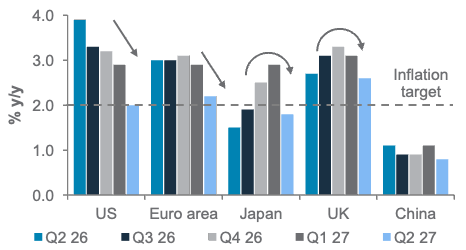
Fig. 9 Inflation expected to return to 2% target by 2027
Consensus inflation estimates across major economies
Source: Bloomberg, Standard Chartered; ^based on money markets, inflation-linked bonds and swaps
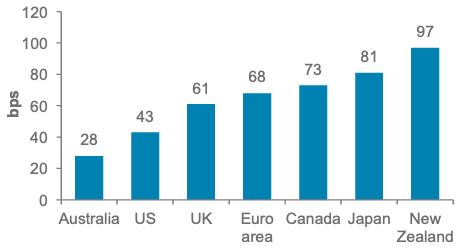
Fig. 10 Markets are overly hawkish on US policy rates
Expected change in policy rates over the next 12 months^
Asset classes
Fixed Income – at a glance
|
|
||||
|
|
||||
Our view
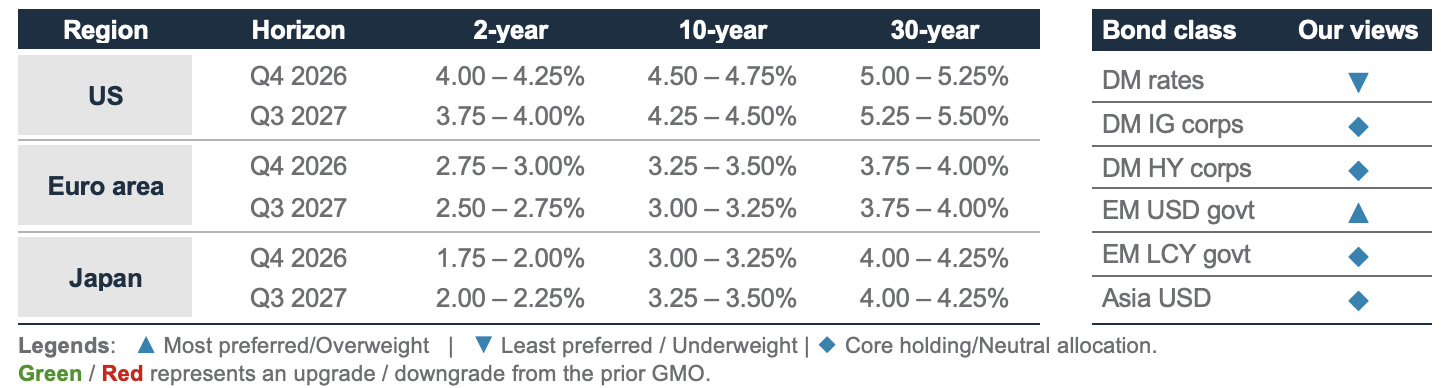
Foundation: Fixed income remains a Core holding (Neutral) in our portfolios. Within the asset class, we maintain an Overweight stance on EM USD government bonds and an Underweight stance on DM government bonds.
Our base case is US inflation likely peaked in Q2, allowing the Fed to keep rates on hold for the rest of 2026. We expect volatility to stay high as investors try to decipher Fed messages in the absence of forward guidance and as the Fed declines to take potential rate hikes off the table. The expanded US Treasury bond buyback programme has added to the uncertainty around the US fiscal policy outlook. Against this backdrop, we expect bond yields to remain elevated, with upside risk concentrated in the long end of the curve (10+ years) as investors demand a higher term premium. We, therefore, favour the 3-5-year part of the curve and credit over duration. Solid corporate fundamentals and supportive technicals should keep spreads tight, even if the scope for further compression is limited. In EM, we continue to favour EM USD over LCY government bonds.
Opportunistic ideas: We are bullish on European bank additional tier-1 (AT1) bonds (contingent convertibles [CoCos1]; FX-hedged), US TIPS, AAA-rated CLOs, US utilities corporate hybrids, broad US HY and AUD corporate bonds.
Key charts
Fig. 11 Rate forecasts and our view of bond classes
DM rates – Underweight
We are Underweight DM government bonds. In the US, the term premium – the compensation demanded for holding long duration bonds – has risen over the past month. The move builds on two pressures: a deteriorating US fiscal policy outlook and Fed policy uncertainty in the absence of clear forward guidance.
This month adds the so-called ‘Bessent put’ to the mix. The US Treasury has signalled its intention to dampen volatility at the long end by expanding purchases of long-dated bonds while skewing new issuance towards shorter maturities – an echo of the Fed’s ‘Operation Twist’ in 2011. We believe the initiative is an attempt by the US to limit bond yield increases at the long end of the curve, but it does not address fundamental drivers – namely, the fiscal burden and the shift away from forward guidance from the Fed. To see a more lasting move down in long-end yields, we would likely need to see a meaningful slowdown in US economic growth.
In the Euro area, growth and activity data have held up better than expected, but inflation remains sticky. Domestic bond yields have repriced to multi-year highs, driven by a global reassessment of the interest rate outlook. European natural gas prices continued to move higher over the past month as natural gas shipping through the Hormuz strait remains disrupted. The ECB left rates unchanged in July but now faces near-term pressure to deliver a second hike this year. We now expect one further hike to 2.5% by year-end, revised from our previous call of no additional tightening.
In Japan, the BoJ held rates in July, but left the door open to a near-term hike. Firming wage growth and broadening inflation both argue for tightening. Government bond yields have surged on rising rate hike expectations, amplified by the global escalation in term premia, with the long end bearing the brunt. With much now priced in, we expect yields to consolidate around current levels, though we have revised our policy rate forecast up from one to two hikes for the rest of the year.
DM corporates – Core holding
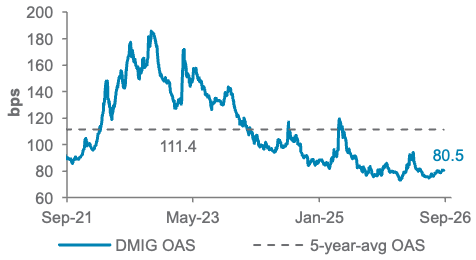
We maintain a Neutral allocation to both DM IG and DM HY corporate bonds, with an opportunistic bullish view on DM HY bonds to ride on the still-strong US growth dynamic. Credit spreads remain close to historical tights, supported by solid fundamentals across both IG and HY. Corporate balance sheets remain resilient, underpinned by healthy profitability, stable credit metrics and a still-positive credit ratings outlook. Given stretched valuations, however, we see limited room for spreads to compress, making buy-and-hold carry our preferred way to own the asset class, with returns increasingly driven by coupons, given still-elevated all-in yields.
Fig. 12 AI issuance challenges IG technical backdrop
AI issuance, US IG gross issuance
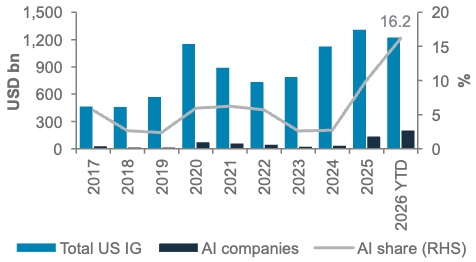
In the IG space, we continue to expect spreads to diverge across sectors, as heavy AI hyperscaler issuance challenges the technical backdrop. In the US, AI-related supply is nearing the USD 220bn mark and represents a growing share of US IG gross issuance. Supply risk appears to be crowding out the long end of the curve, where we would be selective rather than seeking broad exposure, as AI capex continues to weigh on technicals. We prefer to use issuance-driven concessions as an entry point rather than to extend duration indiscriminately.
Fig. 13 DM IG spreads hover near historical tight
Bloomberg Global Aggregate Corp Index, option-adjusted spread (OAS)
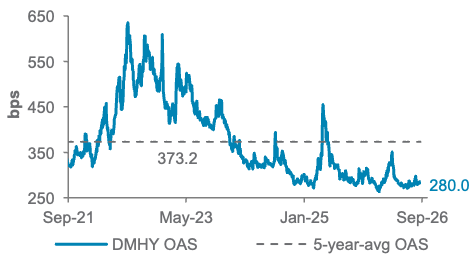
As an income proposition, HY remains well supported, with all-in yields of around 7% and default expectations broadly benign. Its shorter duration profile offers lower sensitivity to rate volatility, which is an attractive characteristic in an environment of elevated term premium. Primary market underlines the strength of demand. US HY issuance continues to be driven by refinancing rather than new leverage, effectively pushing the maturity wall firmly into 2028-29 and relieving near-term refinancing pressure. We would opportunistically stay invested in this asset class for income, while remaining selective on the lower-rated cohort where covenants are weakening and idiosyncratic risks are building.
Fig. 14 DM HY spreads are near historical tights as well
Bloomberg Global HY Aggregate Corporate Index, OAS
EM government bonds – Overweight USD/Core holding for LCY
We remain Overweight EM USD government bonds and retain EM LCY government bonds as a Core holding. The case for EM USD sovereign debt remains supportive. Periodic bouts of widening have been shallow and short-lived, with attractive all-in yields drawing buyers on weakness while global growth remains resilient.
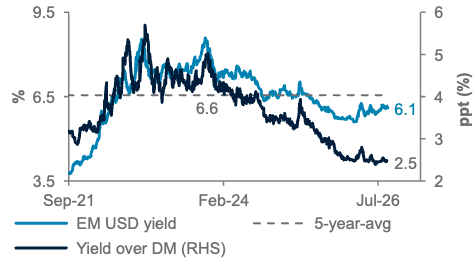
The asset class offers an average yield of 6.1%, slightly above its 10-year average of 6%. Resilient external balance fundamentals and supportive technicals reinforce the case: issuance has been heavily front-loaded, while relatively light investor positioning should limit the risk of a crowded unwind and help contain the market impact of moderate outflows.
EM USD sovereigns also have a more oil-resilient index composition, with non-oil importers accounting for 67% of exposure, compared with 46% for EM LCY debt. Although spreads are historically tight and leave little room for error, the 2006-07 experience shows that such valuations can persist when real rates are high and growth remains stable. We, therefore, expect returns to be driven primarily by carry rather than further spread compression. Long-dated EM IG sovereigns have underperformed as heavy issuance by US AI hyperscalers has competed for demand and eroded their scarcity premium. Their relative performance should improve if AI-related issuance stabilises.
Fig. 15 EM government bonds offer a pick-up of 2.5% in yields over DM peers
Bloomberg EM USD Government Bond Index, yield to worst
In EM LCY debt, headwinds extend beyond FX, as elevated US real yields and term premium have reduced the asset class’s relative appeal to foreign flows. Nevertheless, EM LCY debt appears relatively attractive on real-yield and historical valuation measures, while monetary policy remains restrictive in many markets. We therefore
retain it as a Core holding while maintaining a Neutral stance on broad-duration beta and seeking alpha through country selection. Key risks include a Middle East conflict escalation and an associated rise in oil prices, a more hawkish Fed along with a stronger USD, and El Niño delaying disinflation.
Asia USD bonds – Core holding
We retain a Neutral allocation to Asia USD bonds, an asset class that continues to reward investors with attractive nominal yields, favourable supply-demand technicals and robust credit fundamentals. Healthy corporate cash flows, low leverage and a high share of sovereign-linked issuers lend the segment a defensive quality relative to broader credit.
The resilience has been evident year to date (YTD). Asia USD bonds have delivered positive total returns, achieved modest spread tightening and outperformed US IG bonds. We expect this relative strength to persist. The combination of carry, credit quality and low FX sensitivity anchors our conviction in the asset class even as we maintain a Neutral stance.
Equity – at a glance
|
|
||||
|
Our view
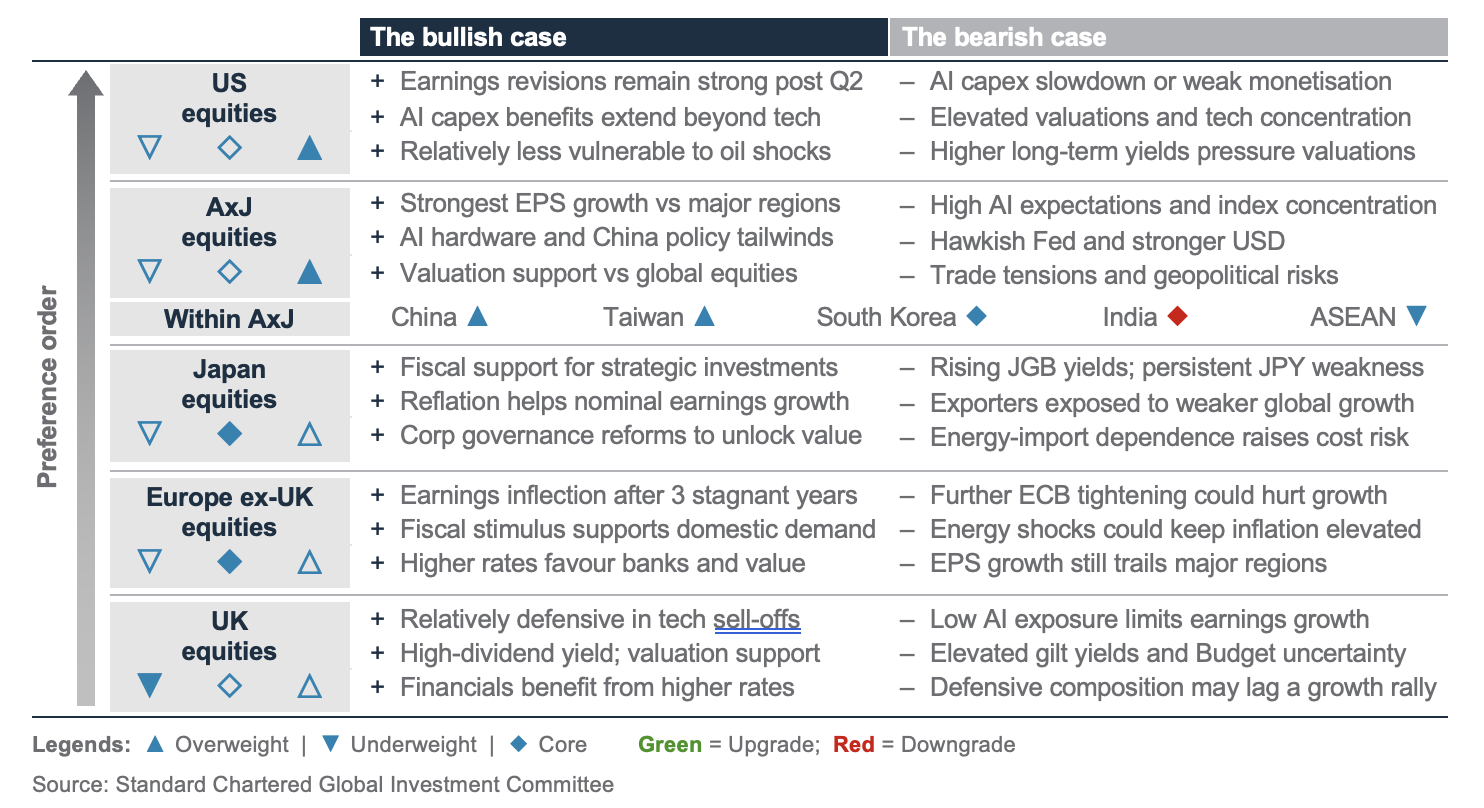
We remain Overweight global equities, with our view underpinned by robust earnings growth. The US Q2 earnings season has delivered a strong beat to consensus expectations, resulting in 2026 and 2027 earnings estimates being revised higher. We acknowledge headwinds from high bond yields, which weigh on equity valuations, but we see enough cushion from earnings growth. We are Overweight US equities, with fundamental earnings strength and reasonable valuations. We remain Overweight AxJ equities – a key beneficiary of AI capex, which shows no signs of slowing down.
Within AxJ, we continue to remain Overweight Taiwan, with good visibility on AI-driven growth, and Overweight China for its valuation re-rating potential. We lower India to a Core holding, given stretched valuations and rangebound oil prices.
We maintain Japan as a Core allocation, as fiscal stimulus and a reflating economy offset energy import vulnerability. We remain Underweight UK equities, given their relatively muted earnings growth and headwinds from rising bond yields.
Key chart
US Q2 earnings season has been excellent.
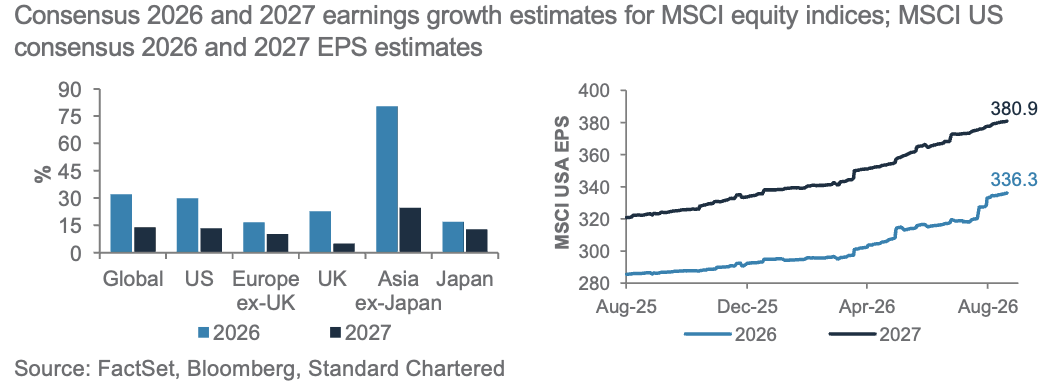
Fig. 16 Overweight views on AxJ and US equities are supported by robust earnings growth. US equities’ 2026 and 2027 earnings estimates are being revised higher
Earnings cushion holds
The Q2 US earnings season has been excellent, supporting solid earnings growth for global equities in 2026 (32%) and 2027 (14%). This provides enough cushion, in our view, to absorb the impact of high bond yields on equity valuations. We estimate that every 25bps rise in the discount rate can weigh on global equities by around 3-4%. To illustrate simply, US 10-year yields have risen by about 50bps this year (a potential 6-8% headwind), while global equities have returned c.14%. 2026’s projected earnings growth of over 30% more than covers the yield headwinds, leaving room for equities to rise further beyond YTD gains. If bond yields move lower as we expect, this would provide a boost for equities.
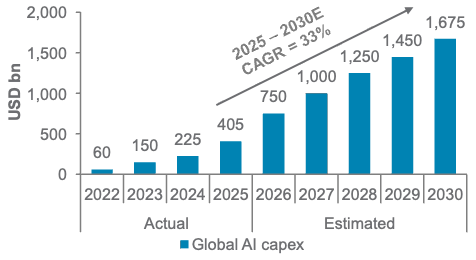
The technology sector continues to lead in terms of earnings growth, driven by AI investments. The AI capex cycle is not fading, as we estimate 33% annual growth in 2025-30, with strong demand from rising AI adoption. Robust cloud growth seen in major hyperscalers points to strong returns on capex. While some concerns about circular financing remain, we recognise the capital-intensive nature of the AI-startup ecosystem. Crucially, AI companies are not building idle capacity but are racing to meet booming demand, which should translate into strong cash flows in the future.
Fig. 17 AI capex continues to rise, supported by strong demand from rising AI adoption
Global AI capex
US equities – Overweight
US earnings estimates have been moving higher following an excellent Q2 reporting season. Compared to the start of the Q2 season, 2026 EPS estimates have moved 6% higher, while 2027 EPS estimates have moved 2% higher. In growth terms, US earnings are expected to grow by 30% in 2026 and 13% in 2027. This gives us the confidence to be Overweight US equities. However, in the run-up to the November US mid-term elections, we would not be surprised to see higher volatility, consistent with historical experience.
AxJ equities – Overweight
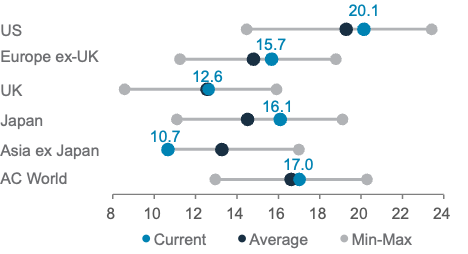
AxJ enjoys the strongest earnings growth among major markets, as its technology sector remains a key beneficiary of AI capex. At the same time, AxJ also has the lowest P/E valuation amongst major markets, as its earnings
AxJ enjoys the strongest earnings growth among major markets, as its technology sector remains a key beneficiary of AI capex. At the same time, AxJ also has the lowest P/E valuation amongst major markets, as its earnings surge has not yet been reflected in the market. Within AxJ, we are Overweight Taiwan and China equities. Taiwan benefits from clear visibility on AI-driven growth and dominance in manufacturing advanced AI chips. China offers valuation re-rating potential driven by technological innovation, policy support and AI-localisation tailwinds.
South Korea equities remain a Core holding. We are positive on the long-term agreements driving the memory chip industry, giving greater visibility to future earnings growth. However, the market continues to be extremely volatile with leveraged investor positioning. We lower India to a Core holding, given stretched valuations relative to its peers, while rangebound and elevated oil prices continue to create uncertainty. India still offers diversification from the AI trade, positive earnings revisions and strong domestic liquidity, which warrants a Neutral allocation. Along with India’s downgrade, we are also less Underweight ASEAN, as we recognise the defensive growth in Singapore and Thailand. However, the region’s relatively lacklustre earnings growth leaves us Underweight.
Fig. 18 US equity valuations are high but not at extreme levels, while AxJ valuations are attractive
12-month forward P/E ratio of regional MSCI indices
Japan equities – Core holding
An expansionary fiscal stance continues to buoy a reflating economy, with solid broad-based earnings revisions. Japan remains vulnerable to energy shocks, and rising local interest rates could lead to a stronger currency over the next 12 months, a headwind for exporters.
Europe ex-UK equities – Core holding
Europe ex-UK is seeing an earnings inflection after three stagnant years. 2026 earnings estimates are rising, alongside a strong Q2 earnings season. Fiscal expansion is lifting domestic demand and benefiting the industrial sector, while higher-for-longer rates favour the banking sector. However, earnings growth in the region still lags that of the US and AxJ.
UK equities – Underweight
The UK has the highest long-end bond yields in the developed world, and renewed policy uncertainty ahead of the Autumn Budget is likely to reignite volatility. Earnings growth is also expected to be relatively muted, particularly in 2027.
Equity opportunistic views
|
|
||||
|
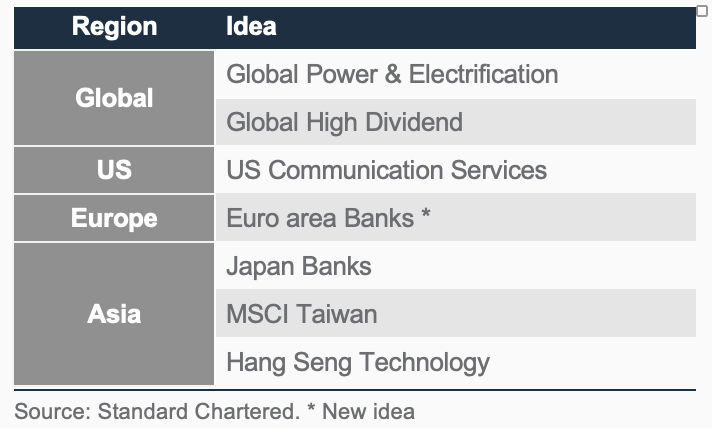
Add Euro area banks
We initiate an Opportunistic idea on Euro area banks. A ‘higher-for-longer’ rate backdrop should extend the current earnings upcycle, with markets expecting further ECB tightening, while we expect one more hike this year. The latest ECB lending survey points to a modest corporate loan demand recovery, while earnings growth is broadening beyond net interest income. Strong capital generation supports higher dividends and continued share buybacks.
Fig. 19 Opportunistic ideas
Ongoing ideas
Global Power & Electrification: Rising AI and data centre power demand should drive a multi-year grid and electrification investment cycle. Power availability and grid capacity are emerging as bottlenecks to the AI infra buildout. Addressing these constraints requires capex and time, which supports strong earnings visibility for grid equipment makers.
Japan Banks: BoJ policy normalisation drives NIM upside, while Japan’s reflation cycle should support nominal loan demand, corporate capex and wealth activity. Governance reform is a rate-cycle-independent re-rating driver, including recycling legacy holdings towards growth, buybacks and dividends. Japan’s plans to ease large-scale exposure limits for projects such as M&A and AI data centres should broaden financing opportunities for the megabanks.
MSCI Taiwan: Taiwan’s foundry leadership makes it a critical supplier to global technology and semiconductor companies, especially for advanced nodes. Taiwan’s AI hardware suppliers are also posting strong revenue growth across servers, advanced packaging and other key components.
Global High Dividend: Provides a higher-income equity allocation with historically lower volatility than the MSCI ACWI and modest downside cushioning on balance.
US Communication Services: We remain constructive and expect further upward earnings revisions, driven by improving digital-ad spending and AI monetisation.
Hang Seng Technology: Tech innovation remains a priority under China’s 15th Five-year Plan, while a strong AI-related IPO pipeline and reasonable valuations support sentiment.
Sector views: Continue to broaden & diversify
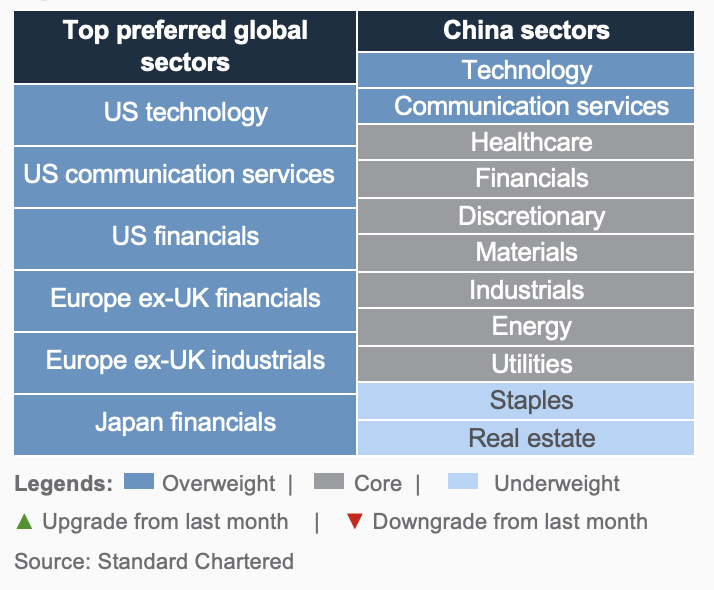
We are Overweight US technology and communication services, which are expected to be the primary drivers of US earnings growth, supported by structural AI tailwinds and broadening AI monetisation. Beyond tech, we retain a broad Overweight in financials across the US, Europe ex-UK and Japan, whose stable earnings growth profiles underpin our view amid buoyant markets, elevated rates and reasonable valuations. US financials are supported by a capital markets and M&A recovery and resilient net NIMs. Europe ex-UK financials benefit from robust balance sheets and sustained shareholder returns, while Japan financials gain from BoJ policy normalisation. In addition, we remain Overweight Europe ex-UK industrials, given EU fiscal stimulus, bolstered by Germany’s new infrastructure acceleration legislation.
In China, we retain a pro-risk stance, being Overweight technology and communication services on AI infrastructure investment. The July Politburo Meeting directed authorities to accelerate the deployment of remaining fiscal resources, prioritising high-tech infrastructure and the ‘Six Networks’ initiative, providing a near-term catalyst. We remain Underweight real estate and consumer staples amid weak sentiment and low visibility on the housing recovery.Fig. 20 Our sector views
Fig. 20 Our sector views
Gold, crude oil – at a glance
|
Our view
- We reinstate our Overweight on gold and raise our 3 – and 12-month price targets to USD 4,750/oz and 5,000/oz, respectively.
- We maintain our 3-month West Texas Intermediate (WTI) oil forecast at USD 90/bbl and our 12-month target at USD 70/bbl.
Key chart
Fig. 21 Gold has strengthened alongside a steeper US yield curve
Gold price vs. US 10-2 yield curve
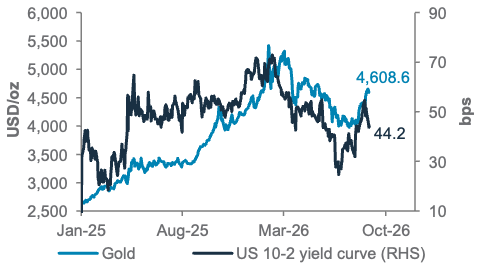
Fig. 23 Refined products, not crude, have absorbed the supply shock
US refining margin, 2025-26 YTD
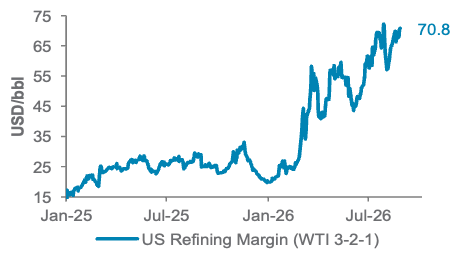
Fig. 22 Gold ETF demand has revived
Monthly changes in global gold ETF holdings, 2025-26
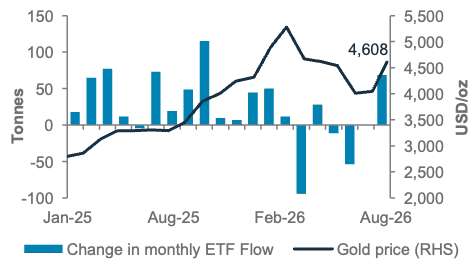
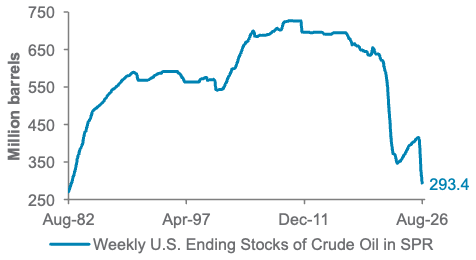
Fig. 24 Emergency reserves have drained back to 1983 levels
US Strategic Petroleum Reserve, million barrels
Gold outlook: Gold has rebounded faster than expected, as a weaker USD and reduced expectations of further Fed tightening have revived ETF demand. Stronger central bank buying, led by China and Poland, provides structural support, while gold’s resilience suggests fiscal concerns are outweighing the relative appeal of elevated yields. We remain constructive over the longer term, although scope for further short-covering and sensitivity to US inflation data and Fed communications point to a more volatile path higher.
Oil outlook: Middle East tensions remain unresolved, sustaining a sizeable risk premium in oil prices and leaving the market prone to outsized moves. Refining constraints have pushed much of the strain into fuel prices rather than crude, while emergency reserves sit at their lowest levels in decades. We expect WTI to remain near USD 90/bbl over the next three months, before easing towards USD 70/bbl over 12 months as transit conditions normalise, with the IEA and EIA both flagging returning Gulf barrels and a sizeable surplus in 2027.
FX – at a glance
|
|
||||
USD view
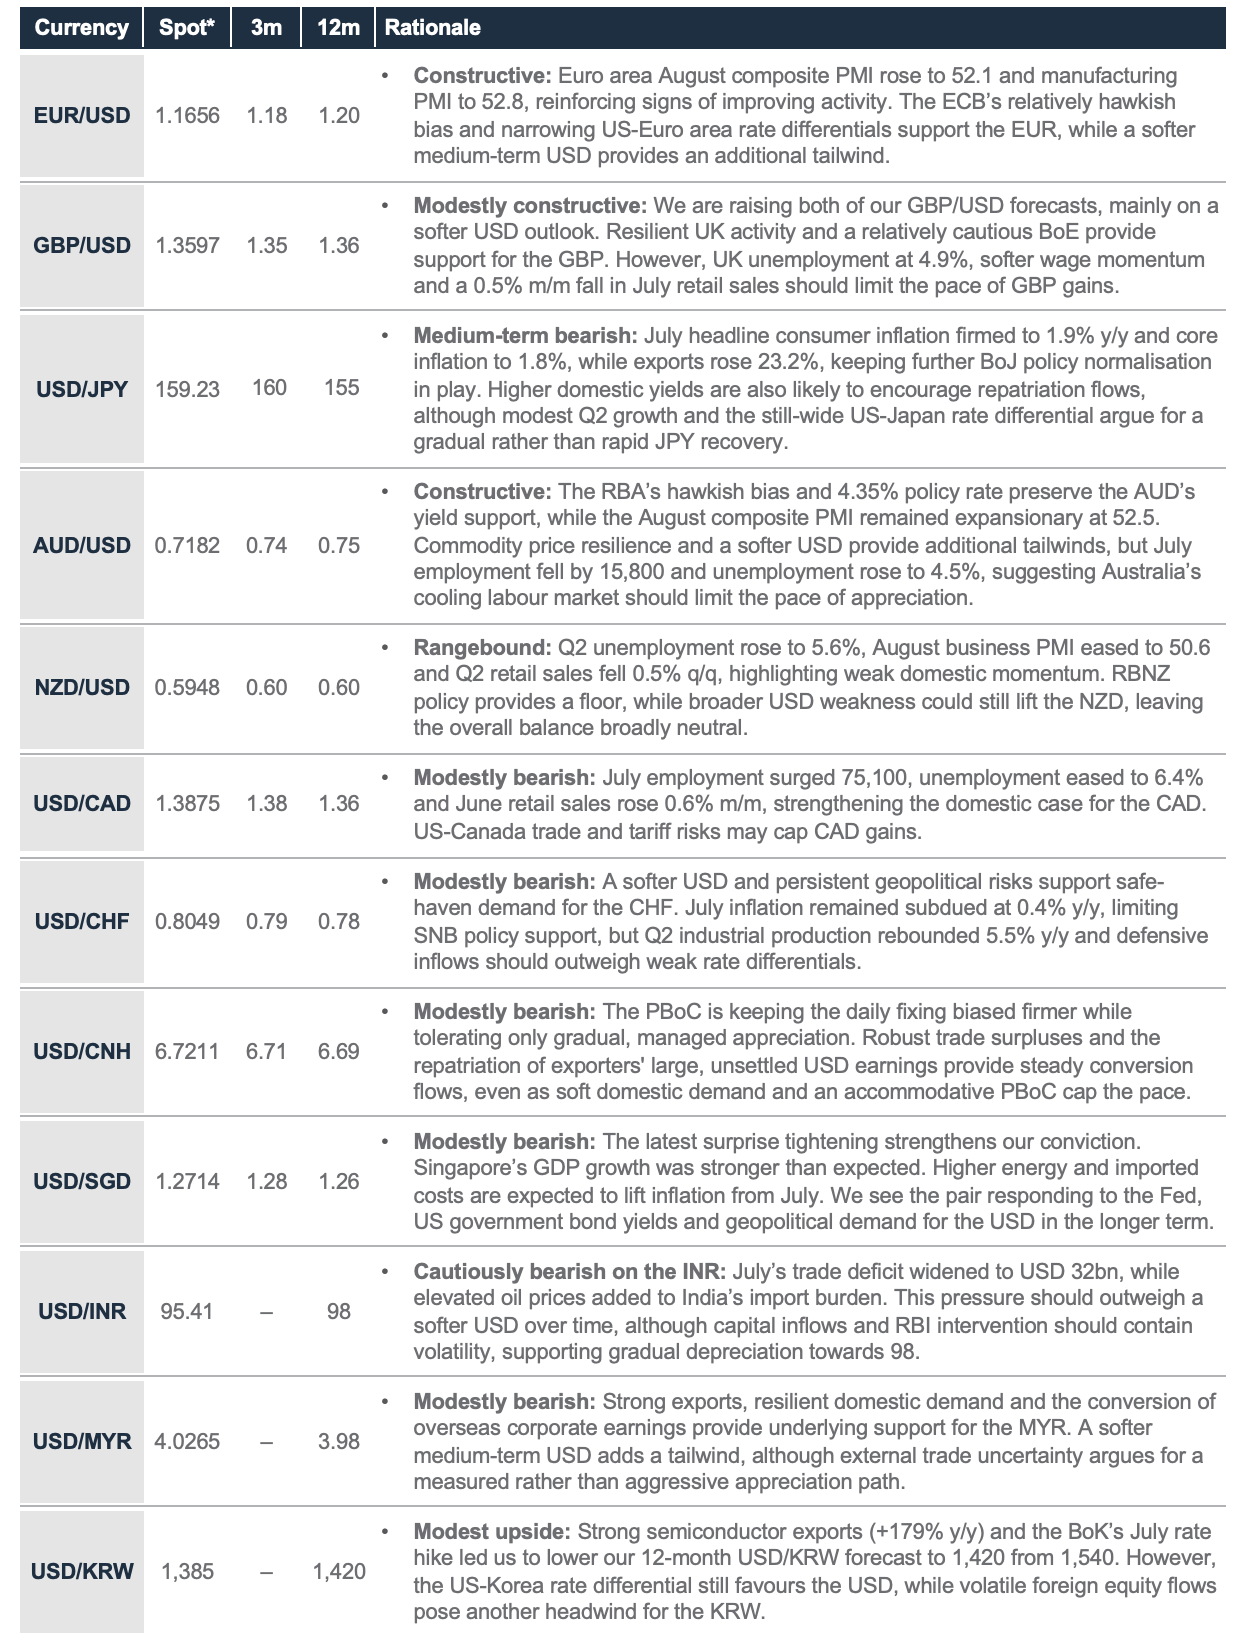
We are lowering our three-month DXY forecast to 98 from 101.5. This reflects a new near-term USD headwind after the US Treasury’s surprise decision to “at least double” liquidity-support buybacks of 10-30-year government debt from USD 2bn to USD 4bn per operation through 4 November. The initial declines in long-end yields and the USD suggest that higher US bond yields provide less reliable USD support when driven by fiscal concerns and the term premium rather than stronger growth or core real yields. July US non-farm payrolls falling by 23,000, wage growth slowing to 3.2% y/y and headline consumer inflation easing to 3.4% y/y all point to a less one-sided US growth story. However, August business activity remains resilient. We see bond buybacks, softer labour and consumption data as near-term USD headwinds rather than signs of an abrupt US downturn.
We expect the USD to decline gradually towards 96 over the next 12 months. Narrowing global rate divergence and persistent US fiscal and external imbalances weigh on the medium-term USD outlook. Softer US labour and inflation momentum support our view that the Fed can remain on hold, while further BoJ normalisation and relatively hawkish RBA and ECB policy biases should reduce the USD’s relative rate advantage. Fiscal and external imbalances leave the currency more dependent on sustained foreign capital inflows. Resilient US activity, AI-related capex and associated equity inflows remain significant offsets
Key charts
Fig. 25 USD interest rate differentials have stalled around the five-year average; 12m downside risk ahead
DXY, weighted interest rate differentials & five-year average
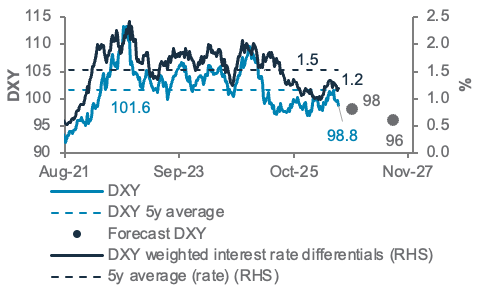
Fig. 27 CHF and AUD benefit most from USD decline
USD vs. major currencies’ performance in the latest downtrend
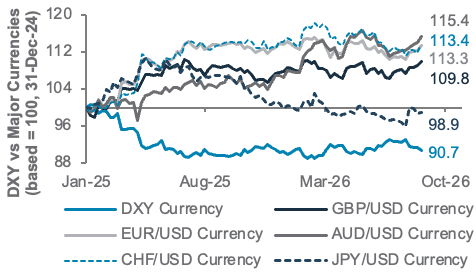
Fig. 26 Rising term premium driven by US fiscal concerns and credit risk; downside risk to the USD
DXY and US 10-year government bond term premium
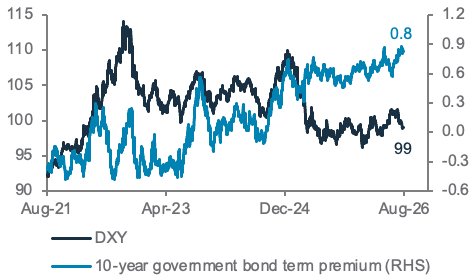
Fig. 28 USD/JPY diverges from yield spread; expect correction if oil prices reprice gradually
USD/JPY and yield spread
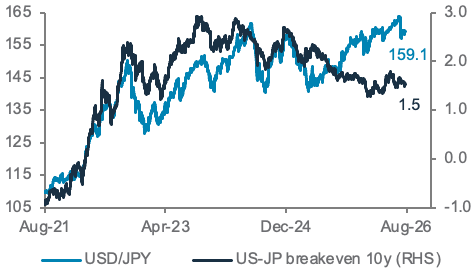
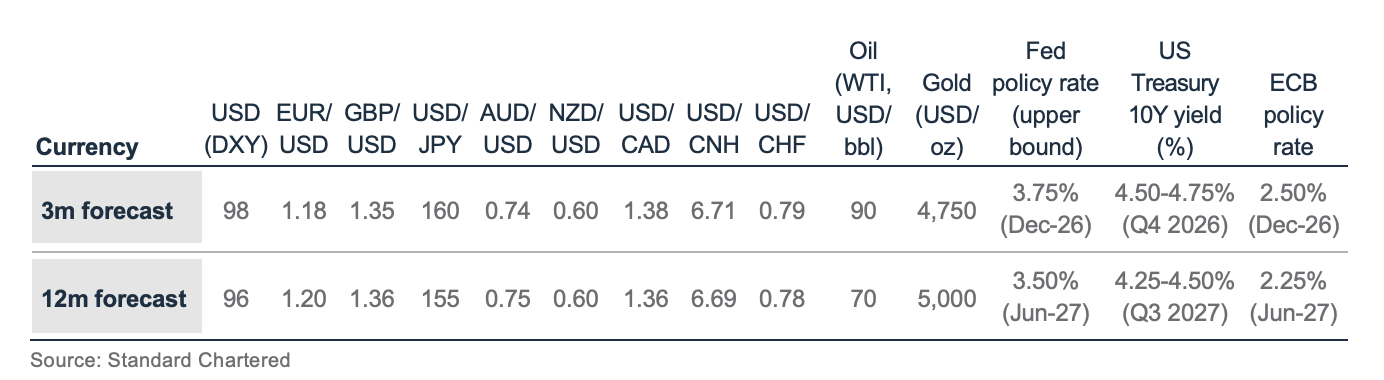
Fig. 29 Summary of currency forecasts and drivers
Additional perspectives
Quant perspective: Raising equity Overweight as positioning improves
|
|
||||
Summary
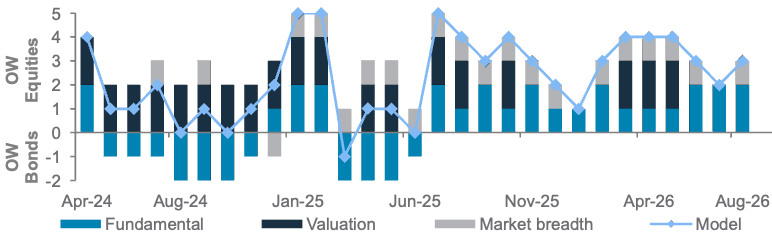
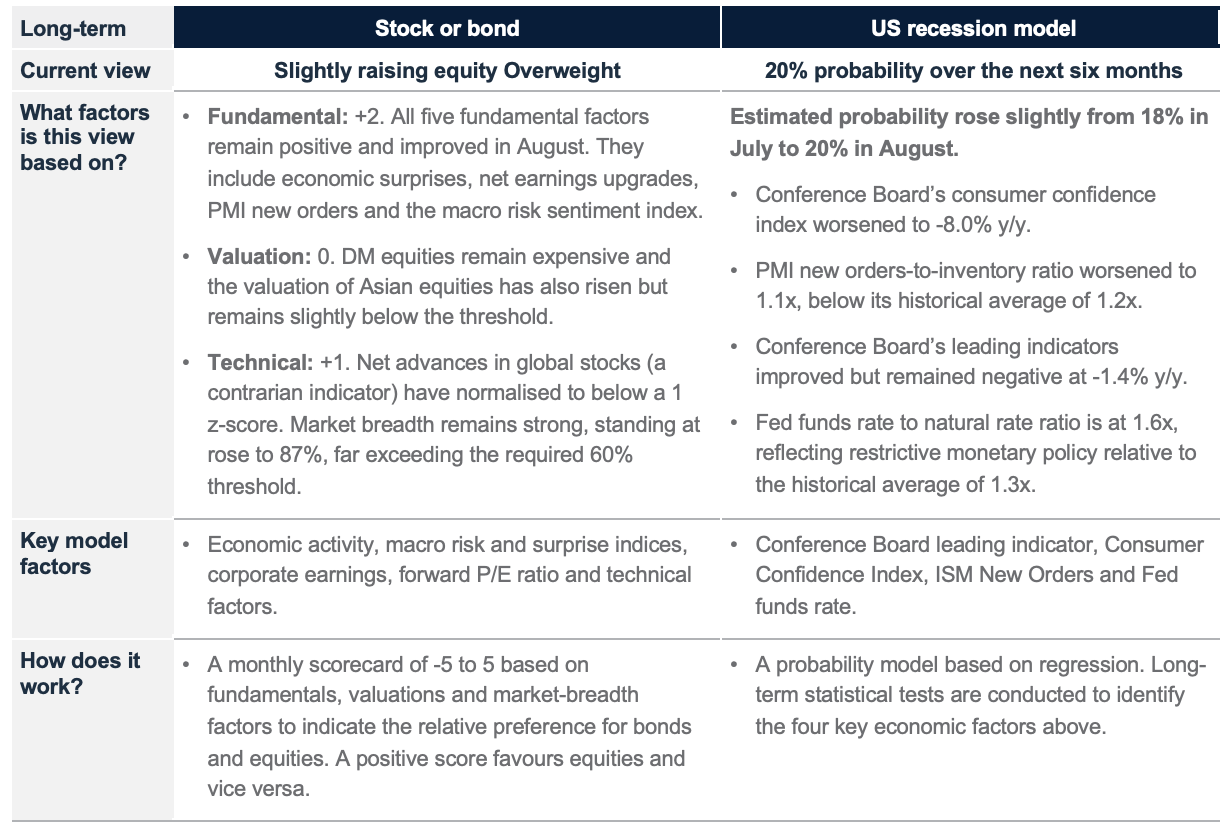
Our stock-bond model (3-6 months) increased its Overweight allocation to global equities to +3 from +2 (maximum +5) in August. The move reflected a normalisation in global stock net advances. This follows July’s reduction in the equity Overweight when net advances rose to more than 1 std deviation above their historical average. Fundamentals remain supportive of equities, with improvements across economic surprises, earnings upgrades, PMI new orders and the macro risk index. Valuations remain a concern, with DM equities still expensive and Asian equities nearing the model’s threshold. A further rise in Asian equity valuations would reduce the overall valuation score from 0 to -2, lowering the overall model score from +3 to +1. YTD the model has returned 13.8%, outperforming the 60/40 equity-bond benchmark by 4.2%.
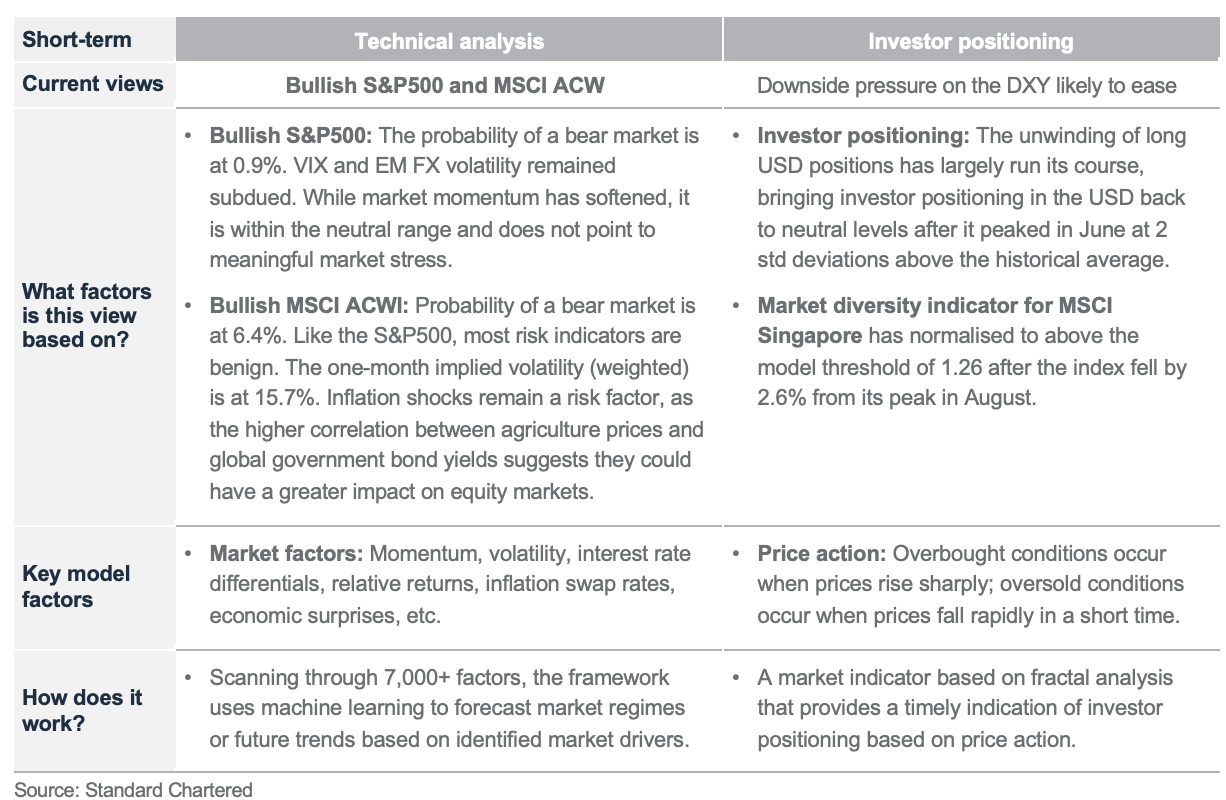
Our equity market regime models (1-3 months) continued to point to low bear-market risks for both the S&P500 and MSCI ACW indices. Estimated bear market probabilities stand at just 0.9% and 6.4%, respectively. The primary driver is the Volatility Index (VIX), which remains benign at 15.8%, comfortably below the model threshold of 20%. Other market-risk indicators, including EM FX volatility, also remain supportive. While momentum factors have softened, they remain within the neutral range and do not point to meaningful market stress.
Our indicators suggest downside pressure on the DXY is likely to ease, as investor positioning in the USD has normalised following the unwinding of previously crowded long USD positions. Investor positioning in the USD peaked in June at 2 std deviations above the historical average and currently sits at 0.2 std deviation.
Key chart
Our stock-bond model increased its Overweight equity position as net advances in global stocks (a contrarian signal) normalised.
Fig. 30 Breakdown of our stock-bond rotation model’s scores
Our model increased equity Overweight to 24% from 16% as the model score rose to +3
VIX has risen slightly, but remains comfortably below the model threshold of 20%. Market momentum has softened, but is within the neutral range.
|
|
Fig. 31 Our technical model remains bullish on the S&P500 Index
S&P500 Index; model’s bearish signal; technical support and resistance levels
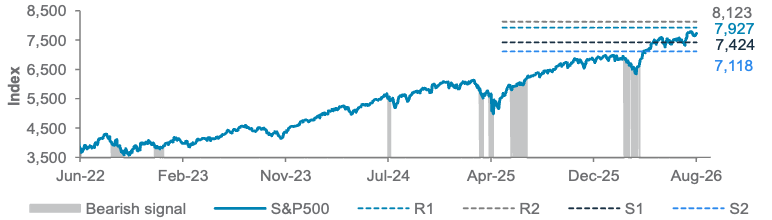
Fig. 32 Long- and short-term quantitative models remain bullish on risk assets
Long-term models below have a typical time horizon of 3-6 months, while short-term models have a 1-3-month horizon
Performance review
Foundation: Asset allocation summary
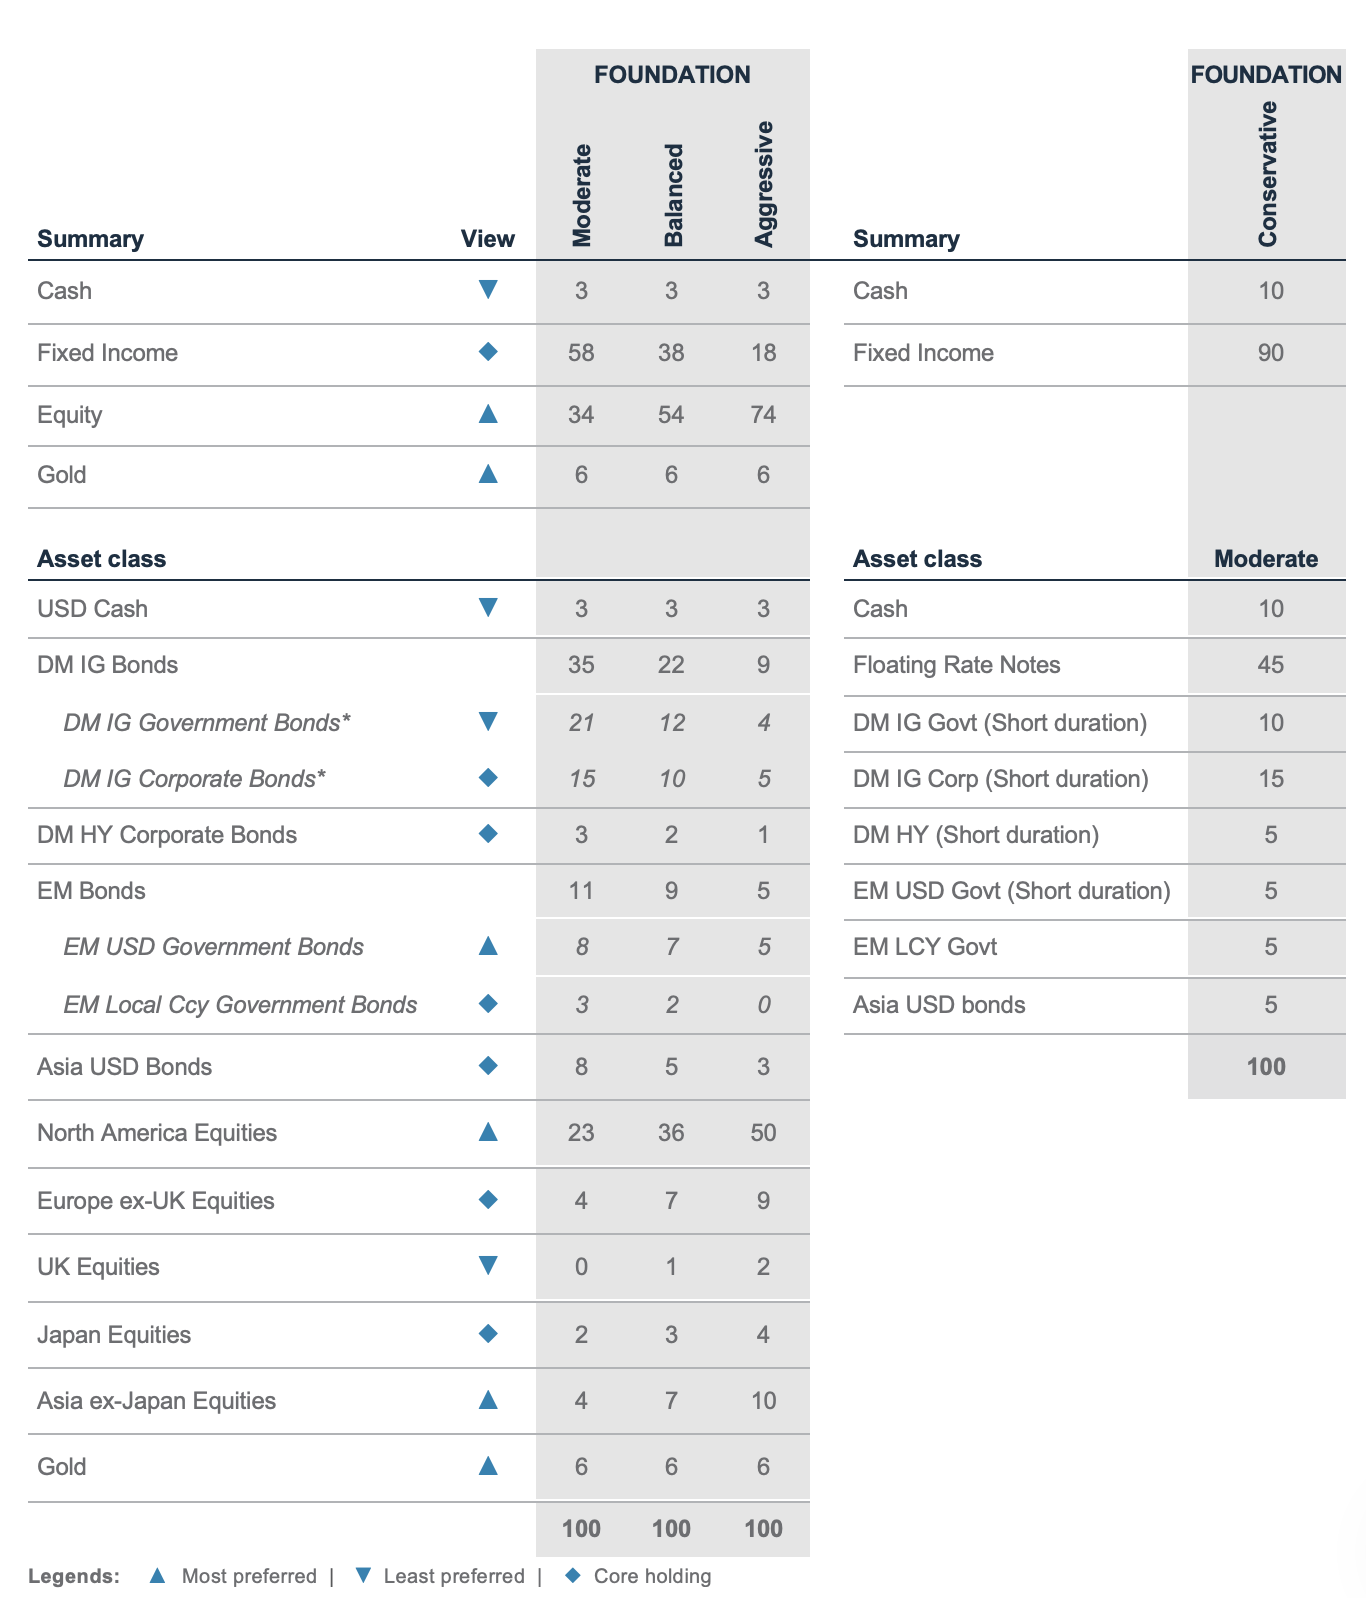
Note: All figures in %; (i) For small allocation we recommend investors to implement through global equity/global bond product; (ii) Allocation figures may not add up to 100 due to rounding. *FX-hedged; (iii) DM IG Bonds is an aggregate of DM IG Government and DM IG Corporate Bonds; (iv) EM Bonds is an aggregate of EM USD and EM Local Ccy Government Bonds
Foundation+: Asset allocation summary
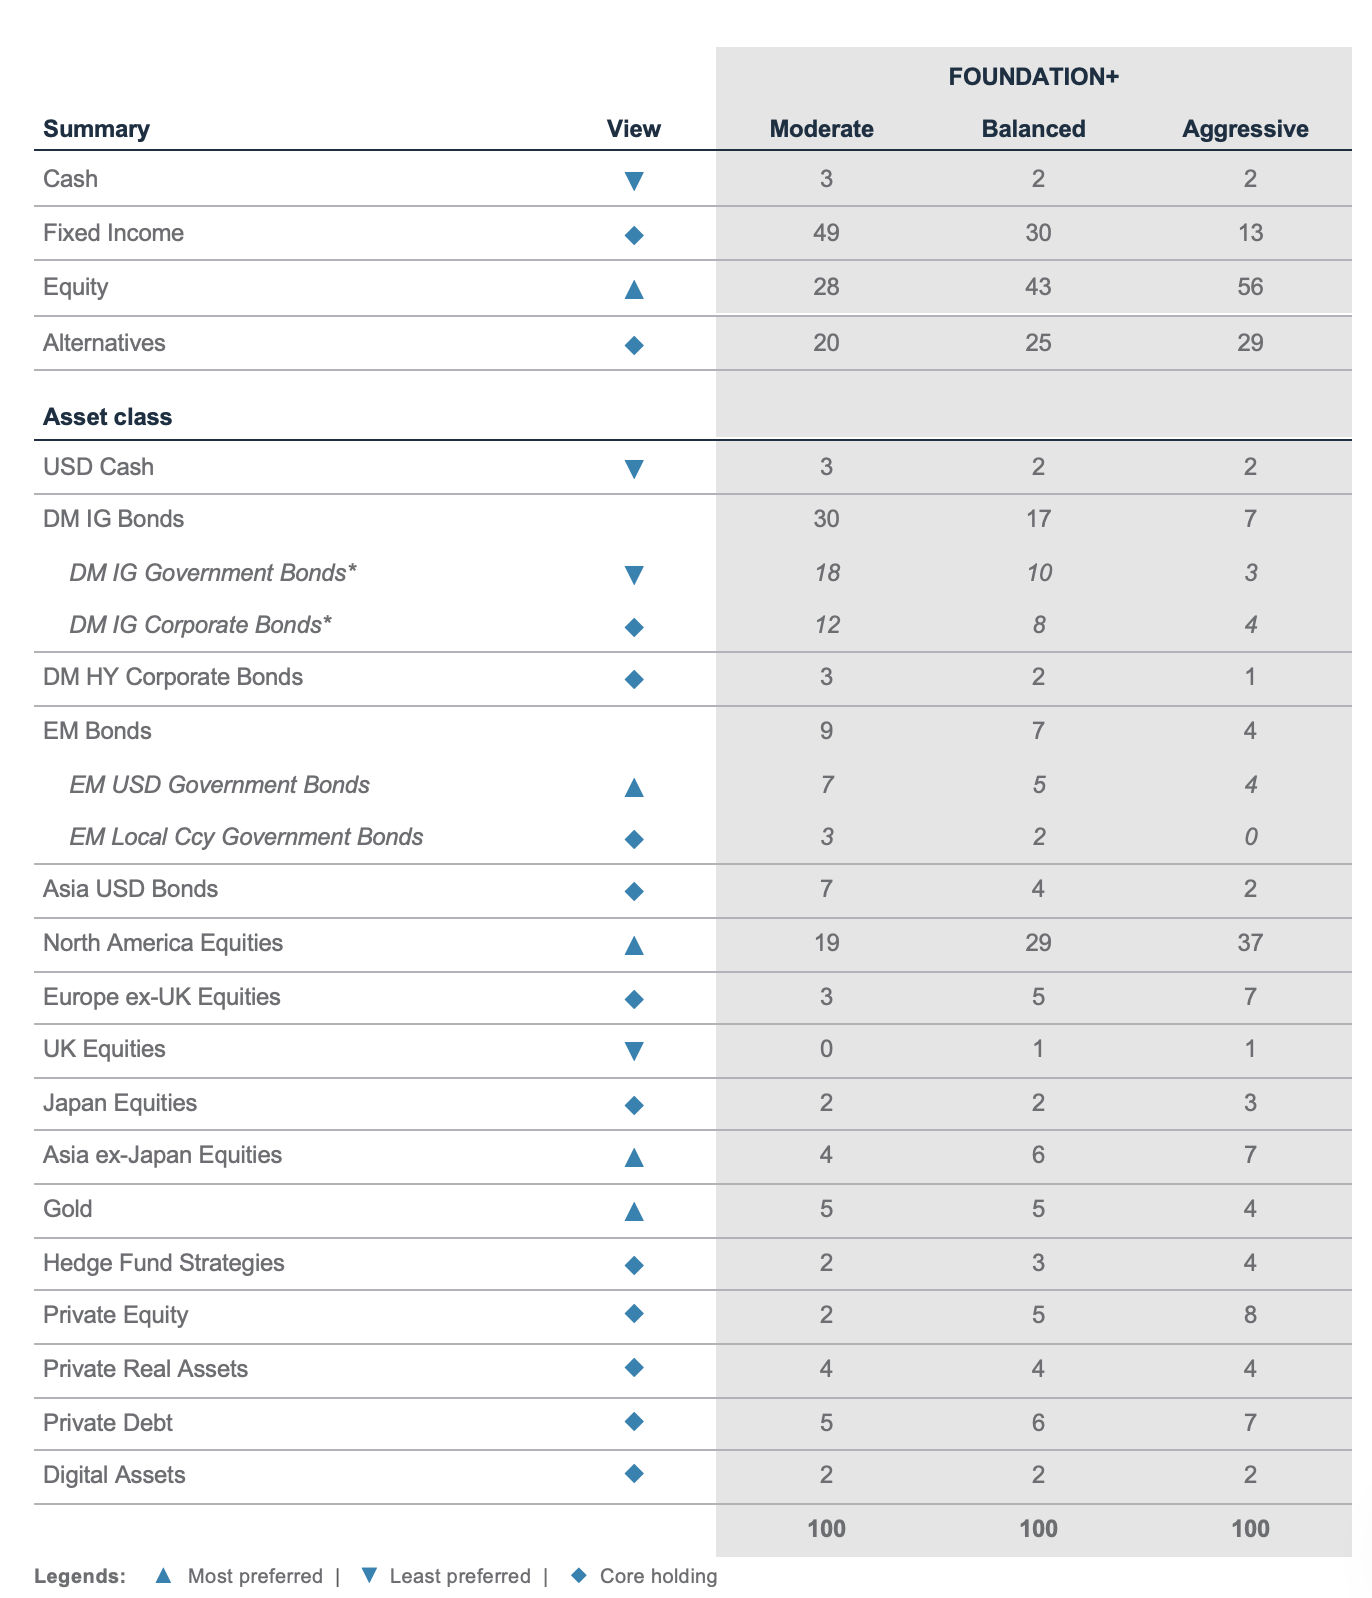
Note: All figures in %; (i) For small allocation we recommend investors to implement through global equity/global bond product; (ii) Allocation figures may not add up to 100 due to rounding. *FX-hedged; (iii) DM IG Bonds is an aggregate of DM IG Government and DM IG Corporate Bonds; (iv) EM Bonds is an aggregate of EM USD and EM Local Ccy Government Bonds
Market performance summary
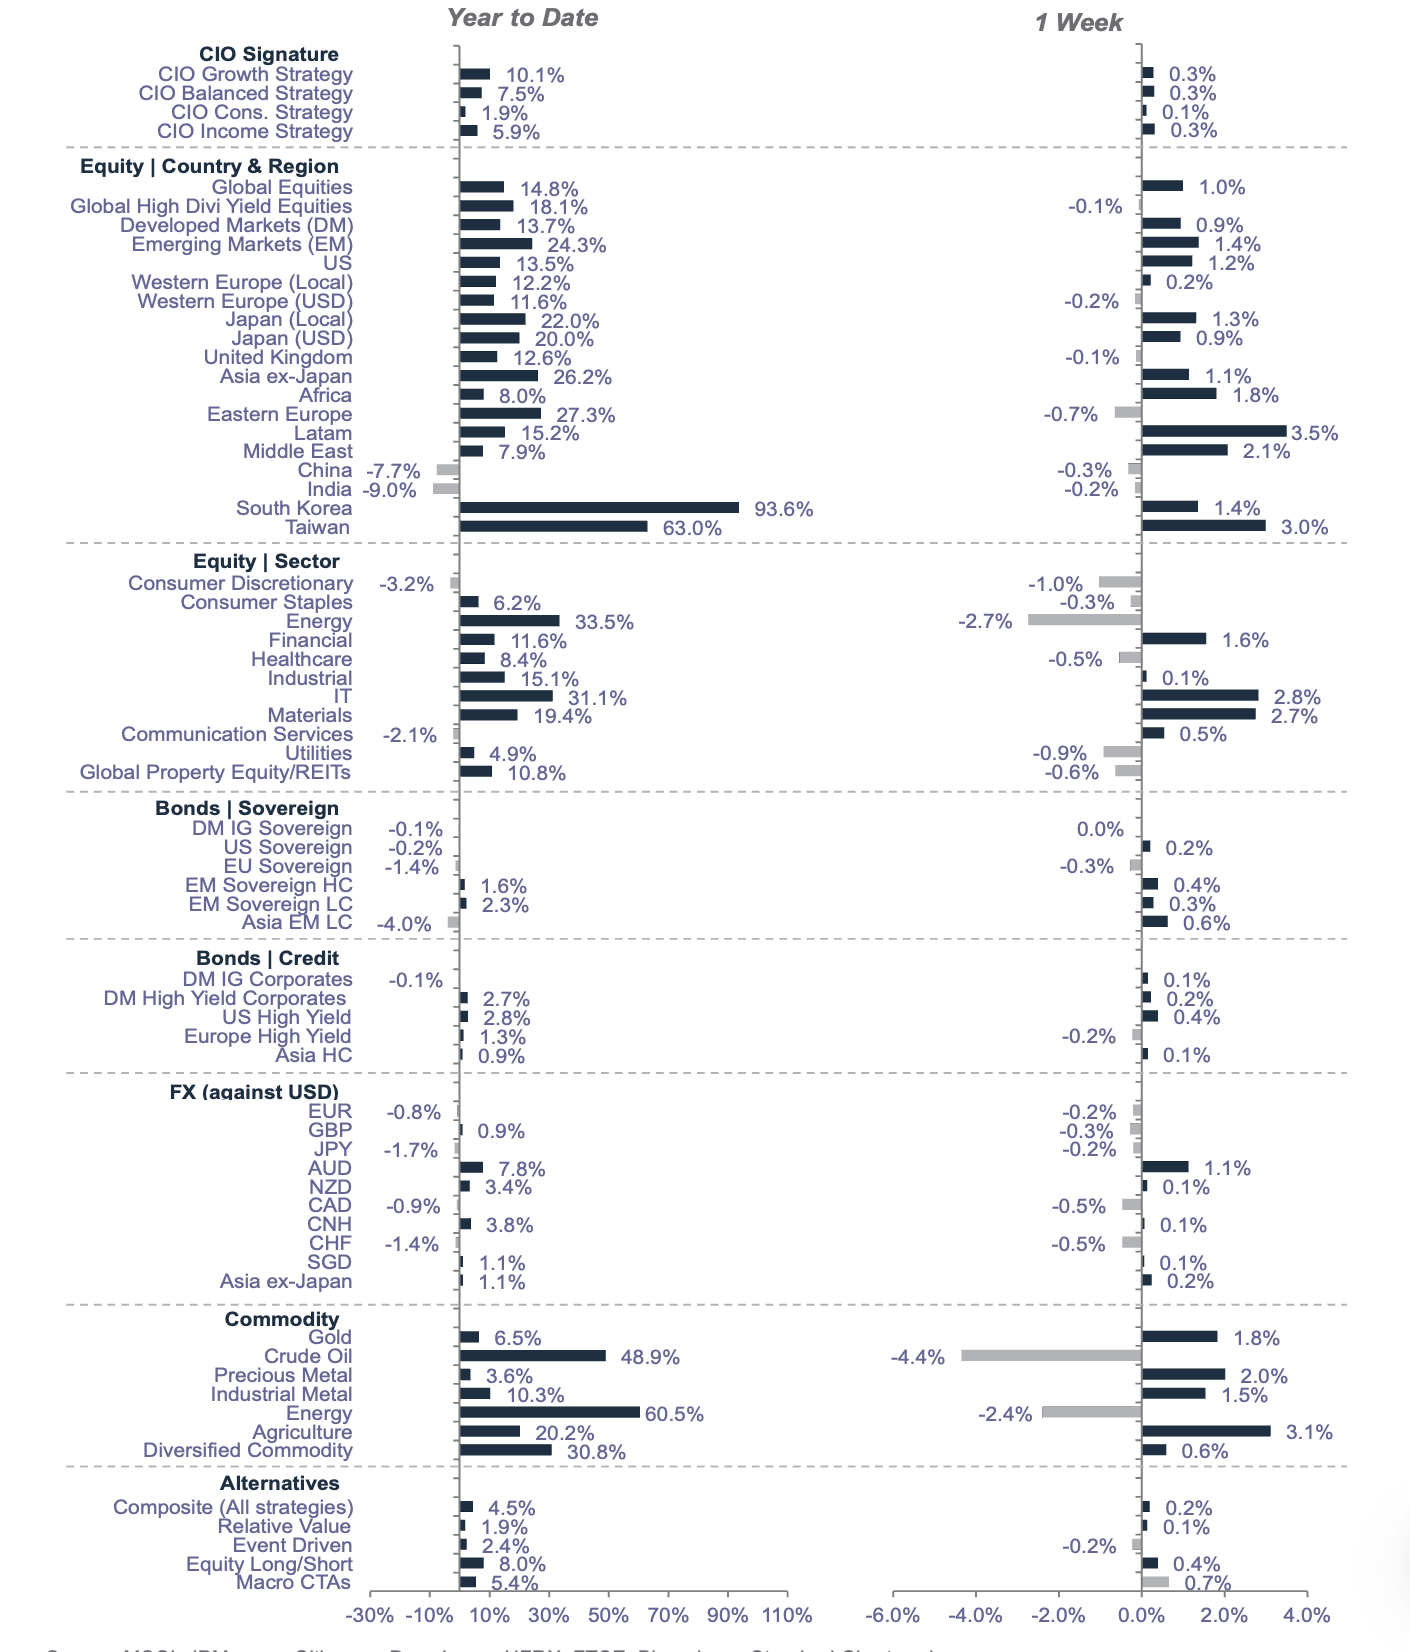
*All performance shown in USD terms, unless otherwise stated
*YTD performance data from 31 December 2025 to 27 August 2026; 1-week performance from 20 August 2026 to 27 August 2026
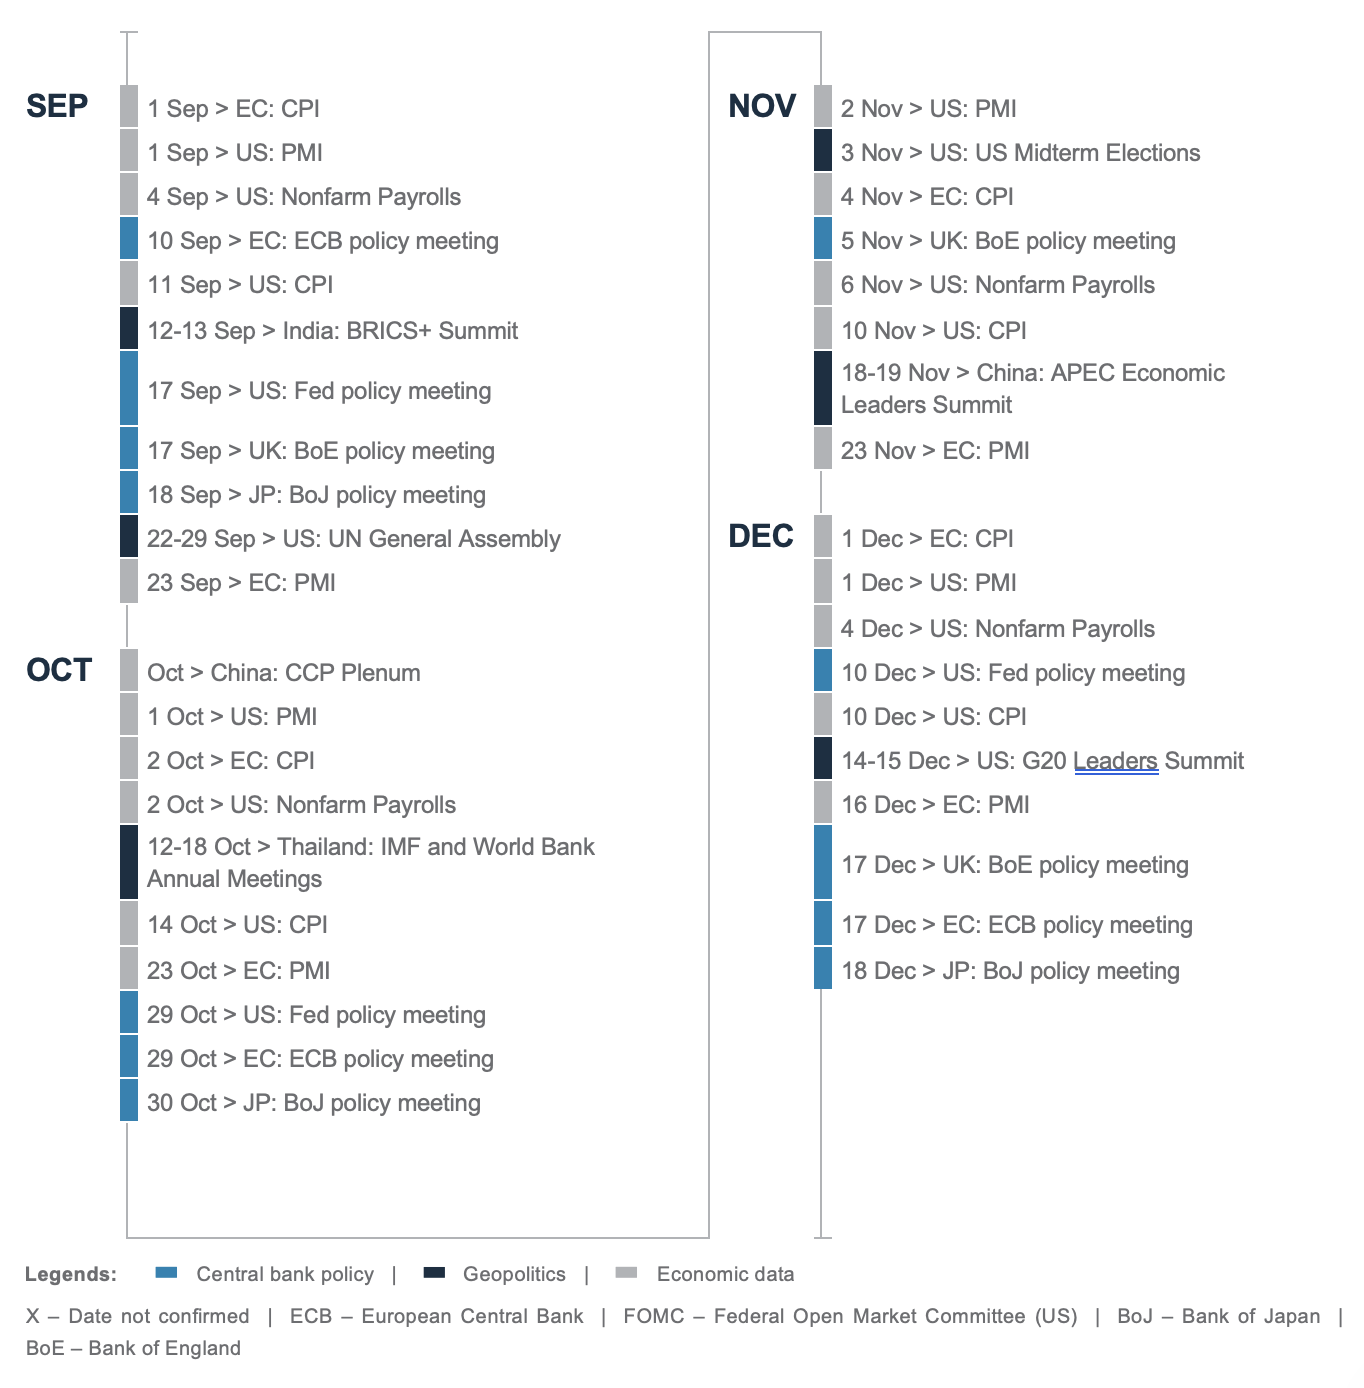
Our key forecasts and calendar events
SC Wealth Select

Explanatory notes
- The figures on page 5 show allocations for a moderately aggressive risk profile only – different risk profiles may produce significantly different asset allocation results. Page 5 is only an example, provided for general information only and they do not constitute investment advice, an offer, recommendation or solicitation. They do not take into account the specific investment objectives, needs or risk tolerances of a particular person or class of persons and they have not been prepared for any particular person or class of persons.
- Contingent Convertibles are complex financial instruments and are not a suitable or appropriate investment for all investors. This document is not an offer to sell or an invitation to buy any securities or any beneficial interests therein. Contingent convertible securities are not intended to be sold and should not be sold to retail clients in the European Economic Area (EEA) (each as defined in the Policy Statement on the Restrictions on the Retail Distribution of Regulatory Capital Instruments (Feedback to CP14/23 and Final Rules) (“Policy Statement”), read together with the Product Intervention (Contingent Convertible Instruments and Mutual Society Shares) Instrument 2015 (“Instrument”, and together with the Policy Statement, the “Permanent Marketing Restrictions”), which were published by the United Kingdom’s Financial Conduct Authority in June 2015), other than in circumstances that do not give rise to a contravention of the Permanent Marketing Restrictions.
Disclosure
This document is confidential and may also be privileged. If you are not the intended recipient, please destroy all copies and notify the sender immediately. This document is being distributed for general information only and is subject to the relevant disclaimers available at our Standard Chartered website under Regulatory disclosures. It is not and does not constitute research material, independent research, an offer, recommendation or solicitation to enter into any transaction or adopt any hedging, trading or investment strategy, in relation to any securities or other financial instruments. This document is for general evaluation only. It does not take into account the specific investment objectives, financial situation or particular needs of any particular person or class of persons and it has not been prepared for any particular person or class of persons. You should not rely on any contents of this document in making any investment decisions. Before making any investment, you should carefully read the relevant offering documents and seek independent legal, tax and regulatory advice. In particular, we recommend you to seek advice regarding the suitability of the investment product, taking into account your specific investment objectives, financial situation or particular needs, before you make a commitment to purchase the investment product. Opinions, projections and estimates are solely those of SC at the date of this document and subject to change without notice. Past performance is not indicative of future results and no representation or warranty is made regarding future performance. The value of investments, and the income from them, can go down as well as up, and you may not recover the amount of your original investment. You are not certain to make a profit and may lose money. Any forecast contained herein as to likely future movements in rates or prices or likely future events or occurrences constitutes an opinion only and is not indicative of actual future movements in rates or prices or actual future events or occurrences (as the case may be). This document must not be forwarded or otherwise made available to any other person without the express written consent of the Standard Chartered Group (as defined below). Standard Chartered Bank is incorporated in England with limited liability by Royal Charter 1853 Reference Number ZC18. The Principal Office of the Company is situated in England at 1 Basinghall Avenue, London, EC2V 5DD. Standard Chartered Bank is authorised by the Prudential Regulation Authority and regulated by the Financial Conduct Authority and Prudential Regulation Authority. Standard Chartered PLC, the ultimate parent company of Standard Chartered Bank, together with its subsidiaries and affiliates (including each branch or representative office), form the Standard Chartered Group. Standard Chartered Global Private Bank is the private banking division of Standard Chartered. Private banking activities may be carried out internationally by different legal entities and affiliates within the Standard Chartered Group (each an “SC Group Entity”) according to local regulatory requirements. Not all products and services are provided by all branches, subsidiaries and affiliates within the Standard Chartered Group. Some of the SC Group Entities only act as representatives of Standard Chartered Global Private Bank and may not be able to offer products and services or offer advice to clients.
Copyright © 2026, Accounting Research & Analytics, LLC d/b/a CFRA (and its affiliates, as applicable). Reproduction of content provided by CFRA in any form is prohibited except with the prior written permission of CFRA. CFRA content is not investment advice and a reference to or observation concerning a security or investment provided in the CFRA SERVICES is not a recommendation to buy, sell or hold such investment or security or make any other investment decisions. The CFRA content contains opinions of CFRA based upon publicly-available information that CFRA believes to be reliable and the opinions are subject to change without notice. This analysis has not been submitted to, nor received approval from, the United States Securities and Exchange Commission or any other regulatory body. While CFRA exercised due care in compiling this analysis, CFRA, ITS THIRD-PARTY SUPPLIERS, AND ALL RELATED ENTITIES SPECIFICALLY DISCLAIM ALL WARRANTIES, EXPRESS OR IMPLIED, INCLUDING, BUT NOT LIMITED TO, ANY WARRANTIES OF MERCHANTABILITY OR FITNESS FOR A PARTICULAR PURPOSE OR USE, to the full extent permitted by law, regarding the accuracy, completeness, or usefulness of this information and assumes no liability with respect to the consequences of relying on this information for investment or other purposes. No content provided by CFRA (including ratings, credit-related analyses and data, valuations, model, software or other application or output therefrom) or any part thereof may be modified, reverse engineered, reproduced or distributed in any form by any means, or stored in a database or retrieval system, without the prior written permission of CFRA, and such content shall not be used for any unlawful or unauthorized purposes. CFRA and any third-party providers, as well as their directors, officers, shareholders, employees or agents do not guarantee the accuracy, completeness, timeliness or availability of such content. In no event shall CFRA, its affiliates, or their third-party suppliers be liable for any direct, indirect, special, or consequential damages, costs, expenses, legal fees, or losses (including lost income or lost profit and opportunity costs) in connection with a subscriber’s, subscriber’s customer’s, or other’s use of CFRA’s content.
Market Abuse Regulation (MAR) Disclaimer
Banking activities may be carried out internationally by different branches, subsidiaries and affiliates within the Standard Chartered Group according to local regulatory requirements. Opinions may contain outright “buy”, “sell”, “hold” or other opinions. The time horizon of this opinion is dependent on prevailing market conditions and there is no planned frequency for updates to the opinion. This opinion is not independent of Standard Chartered Group’s trading strategies or positions. Standard Chartered Group and/or its affiliates or its respective officers, directors, employee benefit programmes or employees, including persons involved in the preparation or issuance of this document may at any time, to the extent permitted by applicable law and/or regulation, be long or short any securities or financial instruments referred to in this document or have material interest in any such securities or related investments. Therefore, it is possible, and you should assume, that Standard Chartered Group has a material interest in one or more of the financial instruments mentioned herein. Please refer to our Standard Chartered website under Regulatory disclosures for more detailed disclosures, including past opinions/ recommendations in the last 12 months and conflict of interests, as well as disclaimers. A covering strategist may have a financial interest in the debt or equity securities of this company/issuer. All covering strategist are licensed to provide investment recommendations under Monetary Authority of Singapore or Hong Kong Monetary Authority. This document must not be forwarded or otherwise made available to any other person without the express written consent of Standard Chartered Group.
Sustainable Investments
Any ESG data used or referred to has been provided by Morningstar, Sustainalytics, MSCI or Bloomberg. Refer to 1) Morningstar website under Sustainable Investing, 2) Sustainalytics website under ESG Risk Ratings, 3) MCSI website under ESG Business Involvement Screening Research and 4) Bloomberg green, social & sustainability bonds guide for more information. The ESG data is as at the date of publication based on data provided, is for informational purpose only and is not warranted to be complete, timely, accurate or suitable for a particular purpose, and it may be subject to change. The ESG data providers may not provide data coverage of all companies or securities in our Sustainable Investment Universe or Fund Select funds. As a result, a small subset of companies or securities will not be in scope for exclusionary screening. Sustainable Investments (SI): This refers to funds that have been classified as ‘ESG Intentional Investments – Overall’ by Morningstar. SI funds have explicitly stated in their prospectus and regulatory filings that they either incorporate ESG factors into the investment process or have a thematic focus on the environment, gender diversity, low carbon, renewable energy, water or community development. For equity, it refers to shares/stocks issued by companies with Sustainalytics ESG Risk Rating of Low/Negligible. For bonds, it refers to debt instruments issued by issuers with Sustainalytics ESG Risk Rating of Low/Negligible, and/or those being certified green, social, sustainable bonds by Bloomberg. For structured products, it refers to products that are issued by any issuer who has a Sustainable Finance framework that aligns with Standard Chartered’s Green and Sustainable Product Framework, with underlying assets that are part of the Sustainable Investment universe or separately approved by Standard Chartered’s Sustainable Finance Governance Committee. Sustainalytics ESG risk ratings shown are factual and are not an indicator that the product is classified or marketed as “green”, “sustainable” or similar under any particular classification system or framework.
Shariah (“Shariah Compliant or Shariah Compliance”)
For any reason to enter only into transactions which comply or are consistent with the principles of the Shariah, the client certifies that he/she/it has made his /her/its own investigation into and satisfied itself as to the Shariah compliance of the Islamic security and all necessary action to confirm that the Islamic security is Shariah compliant has been taken (including the obtaining of a fatwa, where required) and the Client will not claim any dispute on the grounds of any lack of Shariah compliance of these investments. The Client has not relied on Standard Chartered Group or any written declaration, fatwa, opinion or other documents prepared by, on behalf or at the request of Standard Chartered Group for the purposes of a determination or confirmation that these instruments are Shariah compliant.
Country/Market Specific Disclosures
Bahrain: This document is being distributed in Bahrain by Standard Chartered Bank, Bahrain Branch, having its address at P.O. 29, Manama, Kingdom of Bahrain, is a branch of Standard Chartered Bank and is licensed by the Central Bank of Bahrain as a conventional retail bank. Botswana: This document is being distributed in Botswana by, and is attributable to, Standard Chartered Bank Botswana Limited which is a financial institution licensed under the Section 6 of the Banking Act CAP 46.04 and is listed in the Botswana Stock Exchange. Brunei Darussalam: This document is being distributed in Brunei Darussalam by, and is attributable to, Standard Chartered Bank (Brunei Branch) | Registration Number RFC/61 and Standard Chartered Securities (B) Sdn Bhd | Registration Number RC20001003. Standard Chartered Bank is incorporated in England with limited liability by Royal Charter 1853 Reference Number ZC18. Standard Chartered Securities (B) Sdn Bhd is a limited liability company registered with the Registry of Companies with Registration Number RC20001003 and licensed by Brunei Darussalam Central Bank as a Capital Markets Service License Holder with License Number BDCB/R/CMU/S3-CL and it is authorised to conduct Islamic investment business through an Islamic window. China Mainland: This document is being distributed in China by, and is attributable to, Standard Chartered Bank (China) Limited which is mainly regulated by National Financial Regulatory Administration (NFRA), State Administration of Foreign Exchange (SAFE), and People’s Bank of China (PBOC). Hong Kong: In Hong Kong, this document, except for any portion advising on or facilitating any decision on futures contracts trading, is distributed by Standard Chartered Bank (Hong Kong) Limited (“SCBHK”), a subsidiary of Standard Chartered PLC. SCBHK has its registered address at 32/F, Standard Chartered Bank Building, 4-4A Des Voeux Road Central, Hong Kong and is regulated by the Hong Kong Monetary Authority and registered with the Securities and Futures Commission (“SFC”) to carry on Type 1 (dealing in securities), Type 4 (advising on securities), Type 6 (advising on corporate finance) and Type 9 (asset management) regulated activity under the Securities and Futures Ordinance (Cap. 571) (“SFO”) (CE No. AJI614). The contents of this document have not been reviewed by any regulatory authority in Hong Kong and you are advised to exercise caution in relation to any offer set out herein. If you are in doubt about any of the contents of this document, you should obtain independent professional advice. Any product named herein may not be offered or sold in Hong Kong by means of any document at any time other than to “professional investors” as defined in the SFO and any rules made under that ordinance. In addition, this document may not be issued or possessed for the purposes of issue, whether in Hong Kong or elsewhere, and any interests may not be disposed of, to any person unless such person is outside Hong Kong or is a “professional investor” as defined in the SFO and any rules made under that ordinance, or as otherwise may be permitted by that ordinance. In Hong Kong, Standard Chartered Global Private Bank is the private banking division of SCBHK, a subsidiary of Standard Chartered PLC. Ghana: Standard Chartered Bank Ghana Limited accepts no liability and will not be liable for any loss or damage arising directly or indirectly (including special, incidental or consequential loss or damage) from your use of these documents. Past performance is not indicative of future results and no representation or warranty is made regarding future performance. You should seek advice from a financial adviser on the suitability of an investment for you, taking into account these factors before making a commitment to invest in an investment. To unsubscribe from receiving further updates, please send an email to feedback.ghana@sc.com. Please do not reply to this email. Call our Priority Banking on 0302610750 for any questions or service queries. You are advised not to send any confidential and/or important information to Standard Chartered via e-mail, as Standard Chartered makes no representations or warranties as to the security or accuracy of any information transmitted via e-mail. Standard Chartered shall not be responsible for any loss or damage suffered by you arising from your decision to use e-mail to communicate with the Bank. India: This document is being distributed in India by Standard Chartered in its capacity as a distributor of mutual funds and referrer of any other third party financial products. Standard Chartered does not offer any ‘Investment Advice’ as defined in the Securities and Exchange Board of India (Investment Advisers) Regulations, 2013 or otherwise. Services/products related securities business offered by Standard Charted are not intended for any person, who is a resident of any jurisdiction, the laws of which imposes prohibition on soliciting the securities business in that jurisdiction without going through the registration requirements and/or prohibit the use of any information contained in this document. Indonesia: This document is being distributed in Indonesia by Standard Chartered Bank, Indonesia branch, which is a financial institution licensed and supervised by Otoritas Jasa Keuangan (Financial Service Authority) and Bank Indonesia. Jersey: In Jersey, Standard Chartered Global Private Bank is the Registered Business Name of the Jersey Branch of Standard Chartered Bank. The Jersey Branch of Standard Chartered Bank is regulated by the Jersey Financial Services Commission. Copies of the latest audited accounts of Standard Chartered Bank are available from its principal place of business in Jersey: PO Box 80, 15 Castle Street, St Helier, Jersey JE4 8PT. Standard Chartered Bank is incorporated in England with limited liability by Royal Charter in 1853 Reference Number ZC 18. The Principal Office of the Company is situated in England at 1 Basinghall Avenue, London, EC2V 5DD. Standard Chartered Bank is authorised by the Prudential Regulation Authority and regulated by the Financial Conduct Authority and Prudential Regulation Authority. The Jersey Branch of Standard Chartered Bank is also an authorised financial services provider under license number 44946 issued by the Financial Sector Conduct Authority of the Republic of South Africa. Jersey is not part of the United Kingdom and all business transacted with Standard Chartered Bank, Jersey Branch and other SC Group Entity outside of the United Kingdom, are not subject to some or any of the investor protection and compensation schemes available under United Kingdom law. Kenya: This document is being distributed in Kenya by and is attributable to Standard Chartered Bank Kenya Limited. Investment Products and Services are distributed by Standard Chartered Investment Services Limited, a wholly owned subsidiary of Standard Chartered Bank Kenya Limited that is licensed by the Capital Markets Authority in Kenya, as a Fund Manager. Standard Chartered Bank Kenya Limited is regulated by the Central Bank of Kenya. Malaysia: This document is being distributed in Malaysia by Standard Chartered Bank Malaysia Berhad (“SCBMB”). Recipients in Malaysia should contact SCBMB in relation to any matters arising from, or in connection with, this document. This document has not been reviewed by the Securities Commission Malaysia. The product lodgement, registration, submission or approval by the Securities Commission of Malaysia does not amount to nor indicate recommendation or endorsement of the product, service or promotional activity. Investment products are not deposits and are not obligations of, not guaranteed by, and not protected by SCBMB or any of the affiliates or subsidiaries, or by Perbadanan Insurans Deposit Malaysia, any government or insurance agency. Investment products are subject to investment risks, including the possible loss of the principal amount invested. SCBMB expressly disclaim any liability and responsibility for any loss arising directly or indirectly (including special, incidental or consequential loss or damage) arising from the financial losses of the Investment Products due to market condition. Nigeria: This document is being distributed in Nigeria by Standard Chartered Bank Nigeria Limited (SCB Nigeria), a bank duly licensed and regulated by the Central Bank of Nigeria. SCB Nigeria accepts no liability for any loss or damage arising directly or indirectly (including special, incidental or consequential loss or damage) from your use of these documents. You should seek advice from a financial adviser on the suitability of an investment for you, taking into account these factors before making a commitment to invest in an investment. To unsubscribe from receiving further updates, please send an email to clientcare.ng@sc.com requesting to be removed from our mailing list. Please do not reply to this email. Call our Priority Banking on 02 012772514 for any questions or service queries. SCB Nigeria shall not be responsible for any loss or damage arising from your decision to send confidential and/or important information to Standard Chartered via e-mail. SCB Nigeria makes no representations or warranties as to the security or accuracy of any information transmitted via e-mail. Pakistan: This document is being distributed in Pakistan by, and attributable to Standard Chartered Bank (Pakistan) Limited having its registered office at PO Box 5556, I.I Chundrigar Road Karachi, which is a banking company registered with State Bank of Pakistan under Banking Companies Ordinance 1962 and is also having licensed issued by Securities & Exchange Commission of Pakistan for Security Advisors. Standard Chartered Bank (Pakistan) Limited acts as a distributor of mutual funds and referrer of other third-party financial products. Singapore: This document is being distributed in Singapore by, and is attributable to, Standard Chartered Bank (Singapore) Limited (Registration No. 201224747C/ GST Group Registration No. MR-8500053-0, “SCBSL”). Recipients in Singapore should contact SCBSL in relation to any matters arising from, or in connection with, this document. SCBSL is an indirect wholly owned subsidiary of Standard Chartered Bank and is licensed to conduct banking business in Singapore under the Singapore Banking Act, 1970. Standard Chartered Global Private Bank is the private banking division of SCBSL. IN RELATION TO ANY SECURITY OR SECURITIES-BASED DERIVATIVES CONTRACT REFERRED TO IN THIS DOCUMENT, THIS DOCUMENT, TOGETHER WITH THE ISSUER DOCUMENTATION, SHALL BE DEEMED AN INFORMATION MEMORANDUM (AS DEFINED IN SECTION 275 OF THE SECURITIES AND FUTURES ACT, 2001 (“SFA”)). THIS DOCUMENT IS INTENDED FOR DISTRIBUTION TO ACCREDITED INVESTORS, AS DEFINED IN SECTION 4A(1)(a) OF THE SFA, OR ON THE BASIS THAT THE SECURITY OR SECURITIES-BASED DERIVATIVES CONTRACT MAY ONLY BE ACQUIRED AT A CONSIDERATION OF NOT LESS THAN S$200,000 (OR ITS EQUIVALENT IN A FOREIGN CURRENCY) FOR EACH TRANSACTION. Further, in relation to any security or securities-based derivatives contract, neither this document nor the Issuer Documentation has been registered as a prospectus with the Monetary Authority of Singapore under the SFA. Accordingly, this document and any other document or material in connection with the offer or sale, or invitation for subscription or purchase, of the product may not be circulated or distributed, nor may the product be offered or sold, or be made the subject of an invitation for subscription or purchase, whether directly or indirectly, to persons other than a relevant person pursuant to section 275(1) of the SFA, or any person pursuant to section 275(1A) of the SFA, and in accordance with the conditions specified in section 275 of the SFA, or pursuant to, and in accordance with the conditions of, any other applicable provision of the SFA. In relation to any collective investment schemes referred to in this document, this document is for general information purposes only and is not an offering document or prospectus (as defined in the SFA). This document is not, nor is it intended to be (i) an offer or solicitation of an offer to buy or sell any capital markets product; or (ii) an advertisement of an offer or intended offer of any capital markets product. Deposit Insurance Scheme: Singapore dollar deposits of non-bank depositors are insured by the Singapore Deposit Insurance Corporation, for up to S$100,000 in aggregate per depositor per Scheme member by law. Foreign currency deposits, dual currency investments, structured deposits and other investment products are not insured. This advertisement has not been reviewed by the Monetary Authority of Singapore. Taiwan: SC Group Entity or Standard Chartered Bank (Taiwan) Limited (“SCB (Taiwan)”) may be involved in the financial instruments contained herein or other related financial instruments. The author of this document may have discussed the information contained herein with other employees or agents of SC or SCB (Taiwan). The author and the above-mentioned employees of SC or SCB (Taiwan) may have taken related actions in respect of the information involved (including communication with customers of SC or SCB (Taiwan) as to the information contained herein). The opinions contained in this document may change, or differ from the opinions of employees of SC or SCB (Taiwan). SC and SCB (Taiwan) will not provide any notice of any changes to or differences between the above-mentioned opinions. This document may cover companies with which SC or SCB (Taiwan) seeks to do business at times and issuers of financial instruments. Therefore, investors should understand that the information contained herein may serve as specific purposes as a result of conflict of interests of SC or SCB (Taiwan). SC, SCB (Taiwan), the employees (including those who have discussions with the author) or customers of SC or SCB (Taiwan) may have an interest in the products, related financial instruments or related derivative financial products contained herein; invest in those products at various prices and on different market conditions; have different or conflicting interests in those products. The potential impacts include market makers’ related activities, such as dealing, investment, acting as agents, or performing financial or consulting services in relation to any of the products referred to in this document. UAE: DIFC – Standard Chartered Bank is incorporated in England with limited liability by Royal Charter 1853 Reference Number ZC18.The Principal Office of the Company is situated in England at 1 Basinghall Avenue, London, EC2V 5DD. Standard Chartered Bank is authorised by the Prudential Regulation Authority and regulated by the Financial Conduct Authority and Prudential Regulation Authority. Standard Chartered Bank, Dubai International Financial Centre having its offices at Dubai International Financial Centre, Building 1, Gate Precinct, P.O. Box 999, Dubai, UAE is a branch of Standard Chartered Bank and is regulated by the Dubai Financial Services Authority (“DFSA”). This document is intended for use only by Professional Clients and is not directed at Retail Clients as defined by the DFSA Rulebook. In the DIFC we are authorised to provide financial services only to clients who qualify as Professional Clients and Market Counterparties and not to Retail Clients. As a Professional Client you will not be given the higher retail client protection and compensation rights and if you use your right to be classified as a Retail Client we will be unable to provide financial services and products to you as we do not hold the required license to undertake such activities. For Islamic transactions, we are acting under the supervision of our Shariah Supervisory Committee. Relevant information on our Shariah Supervisory Committee is currently available on the Standard Chartered Bank website in the Islamic banking section. For residents of the UAE – Standard Chartered UAE (“SC UAE”) is licensed by the Central Bank of the U.A.E. SC UAE is licensed by Securities and Commodities Authority to practice Promotion Activity. SC UAE does not provide financial analysis or consultation services in or into the UAE within the meaning of UAE Securities and Commodities Authority Decision No. 48/r of 2008 concerning financial consultation and financial analysis. Uganda: Our Investment products and services are distributed by Standard Chartered Bank Uganda Limited, which is licensed by the Capital Markets Authority as an investment adviser. United Kingdom: In the UK, Standard Chartered Bank is authorised by the Prudential Regulation Authority and regulated by the Financial Conduct Authority and Prudential Regulation Authority. This communication has been approved by Standard Chartered Bank for the purposes of Section 21 (2) (b) of the United Kingdom’s Financial Services and Markets Act 2000 (“FSMA”) as amended in 2010 and 2012 only. Standard Chartered Bank (trading as Standard Chartered Global Private Bank) is also an authorised financial services provider (license number 45747) in terms of the South African Financial Advisory and Intermediary Services Act, 2002. The Materials have not been prepared in accordance with UK legal requirements designed to promote the independence of investment research, and that it is not subject to any prohibition on dealing ahead of the dissemination of investment research. Vietnam: This document is being distributed in Vietnam by, and is attributable to, Standard Chartered Bank (Vietnam) Limited which is mainly regulated by State Bank of Vietnam (SBV). Recipients in Vietnam should contact Standard Chartered Bank (Vietnam) Limited for any queries regarding any content of this document. Zambia: This document is distributed by Standard Chartered Bank Zambia Plc, a company incorporated in Zambia and registered as a commercial bank and licensed by the Bank of Zambia under the Banking and Financial Services Act Chapter 387 of the Laws of Zambia.