

25 September 2026
Global Market Outlook
Earnings above all
Higher oil prices are in a tussle with stronger growth. We expect strong growth to help the global economy weather inflation risks, allowing equities to focus on the strength of earnings growth. Oil prices remain the key riskto monitor.
Maintain a preference for equities over bonds and cash. Strong earnings growth is why we would use the recent pause to add exposure to our preferred markets and themes. The US and Asia ex-Japan remain preferred regions.
Take advantage of higher bond yields via credit risk but cap duration. The risk of higher bond yields looks most pressing in ultra-long maturities, but credit quality remains strong. We are Overweight EM USD bonds.
Where are the tactical opportunities?
Do you expect more central bank rate hikes?
Are quantitative models still bullish on equities?
Strategy
Investment strategy and key themes
|
|
||||
|

12m Foundation Overweights:
- Global equities, gold
- US, Asia ex-Japan equities
- Emerging Market USD bonds
Opportunistic ideas – Equities
- Global: Semiconductors^, High dividend, power & electrification
- US: Communication services
- Euro area (EA): Banks
- Asia: Japan banks, MSCI Taiwan
Top Global Sectors:
- US: Technology, communication services, financials, materials^
- EA: Financials, industrials
- Asia: Japan financials
Opportunistic ideas – Bonds
- US: Treasury Inflation-protected Securities (TIPS), AAA-rated collateralised loan obligations (CLOs), utilities sector hybrids, US High-yield (HY)
- EA: Bank AT1s FX-hedged
- Others: AUD corporates
^New
Earnings above all
- Higher oil prices are in a tussle with stronger growth. We expect strong growth to help the global economy weather inflation risks, allowing equities to focus on the strength of earnings growth. Oil prices remain the key risk to monitor
- Maintain a preference for equities over bonds and cash. Strong earnings growth means we would use the recent pause to add exposure to our preferred markets and themes. The US and Asia ex-Japan remain our preferred regions
- Take advantage of higher bond yields via credit risk but cap duration. The risk of higher bond yields looks most pressing in ultra-long maturities, but credit quality remains strong. We are Overweight EM USD bonds
Hits from the 1990s
Rising bond yields have been a key market theme. Since mid-year, 10-year government bond yields have risen approximately 40-80bps across the US, Japan and Euro area. Against this backdrop, gold has delivered high single-digit returns, while global equities have delivered low single-digit returns.
Higher oil prices are in a tussle with robust growth data. The lack of progress towards a negotiated settlement in the US-Iran conflict and rising fears of shipping restrictions extending to the Bab al-Mandab Strait have meant that oil prices are once again testing the USD 100/bbl level. These worries have been exacerbated by increasing worries about refined product (eg. diesel, jet fuel, etc) supply. Despite these concerns, US growth data has held up remarkably well, as illustrated by the latest PMI and retail sales data. This is underpinned by AI investment growth.
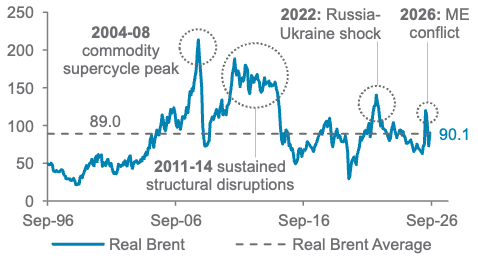
Real, rather than nominal, energy prices are key. A chart of inflation-adjusted energy prices, though, illustrates why the global economy has managed to hold up despite these risks. Oil prices in real (inflation-adjusted) terms are closer to long term averages rather than at true ‘oil shock’ levels. This, together with the global economy’s lower oil intensity relative to history, is why we expect growth and inflation to avoid worst-case scenarios as long as nominal oil prices avoid an excursion into the USD 120-150/bbl range.
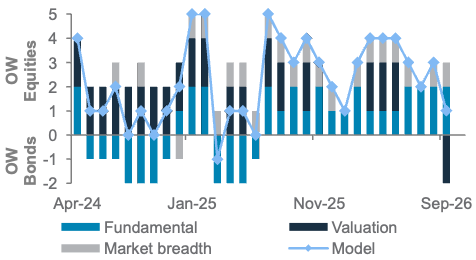
Fig. 1 Our quant model score for equities has softened, but fundamentals remain a key positive
Our quantitative stock-bond model
The Fed is likely to hike twice more by mid-2027. The acceleration in AI-driven investment growth means we believe the chances of a shift from our core soft-landing to no-landing economic scenario have gone up. This, combined with still-high inflation readings mean we now expect the Fed to hike rates twice more by mid-2027. In contrast, the BoJ and ECB are expected to hike thrice and once more respectively.
Buy-the-dip in equities
1990s rate hikes a better parallel then 2022. There is understandably some concern about whether rising central bank policy rates, and rising bond yields across maturities, will present a challenge to equity markets. However, we believe rate hikes in the 1990s are a better historical parallel, when central banks were hiking rates into strong economic and earnings growth, resulting in equity markets maintaining their pace of gains. The 2022 hiking cycle, in contrast, represented an inflation surprise, which we believe is not the case today.
Strong earnings growth overwhelms other factors today. Still-strong economic and earnings growth means that we remain constructive on the outlook for equities and other risky assets going into year-end and beyond. The pause over the last couple of months was likely driven by a combination or rising bond yields, September seasonality and excessive investor optimism around mid-year.
However, earnings expectations for global equities remain very strong (especially in our preferred US and Asia ex-Japan regional markets). We believe these earnings remain sufficiently robust to outweigh the drag from higher bond yields. Therefore, we remain Overweight equities relative to bonds and cash, though we believe it is prudent to ensure the size of the equities Overweight is not excessive. Within Asia, we also trim China equities to a core holding, leaving Taiwan as our only regional Overweight, given the ongoing focus on AI investment-driven markets for now.Bumps remain part of the journey. As we laid out in our mid-year outlook, the second half of this year is expected to be characterised by positive, but bumpy returns as a result of the factors laid out in the previous section, but also US mid-term
Fig. 2 After accounting for inflation, oil prices are high but not at ‘oil price shock’ levels
Brent oil price adjusted for inflation*
election risks. The second half has thus far played out as expected given sufficient bumps, but still robust earnings growth. We would not be surprised by some volatility around US mid-term elections, but any further pullbacks or pauses would be opportunities to raise exposure given strong earnings growth is expected to ultimately dominate.
Prefer credit over duration
Corporate credit quality remains strong. Aggregate indicators of credit quality suggest credit quality remains strong across both Investment Grade and High Yield bonds across most regions. US IG bond yields face some upward pressure from significant hyperscaler supply, but supply-driven spread widening tends to be relatively short-lived in nature and should not signal significant credit quality worries.
Longer-maturity bonds remain at risk of further volatility. In contrast, we continue to be concerned that the volatility in very long maturity bonds could extend. Continued inflation and debt worries mean it is possible investors continue to demand a greater ‘term premium’ (ie. a premium for holding bonds with very long maturities). We continue to believe limiting bond duration to 3-7 years remains appropriate.
We continue to prefer corporate and EM over government bonds. This implies earning a higher yield by taking on more credit risk (via corporate or EM bonds) rather than adding more duration risk. Within bonds, we remain Overweight EM USD bonds and view IG and HY bonds as core holdings.
Modest USD weakness; gold to grind higher
USD bounce led by pricing of Fed hikes. However, we believe Fed hikes are now excessively priced. At the same time, we see room for non-US rates to rise further, especially in Japan where the undervalued JPY is likely to strengthen. This is why modest USD weakness is likely to resume.
Gold to continue grinding higher. While the move higher is likely to be characterised by two-steps-forward-one-step-back, we believe an ultimately softer USD and continued EM central bank demand should result in continued gains in the precious metal over both the next 3- and 12-month periods.
Foundation asset allocation models
The Foundation and Foundation+ models are allocations that you can use as the starting point for building a diversified investment portfolio. The Foundation model showcases a set of allocations focusing on traditional asset classes that are accessible to most investors, while the Foundation+ model includes allocations to private assets that may be accessible to investors in some jurisdictions, but not others.
Fig. 3 Foundation asset allocation for a balanced risk profile
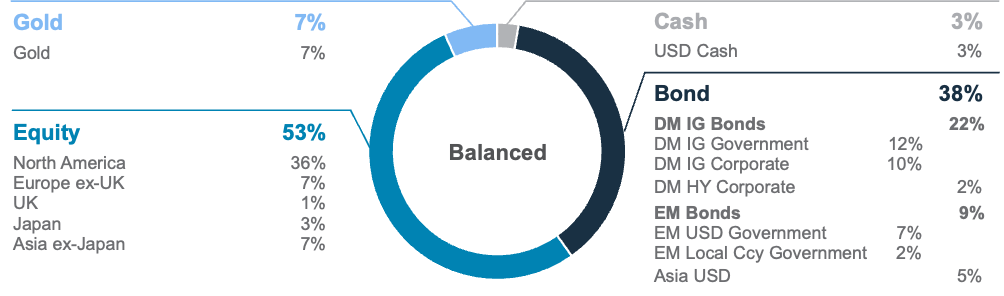
Fig. 4 Foundation+ asset allocation for a balanced risk profile
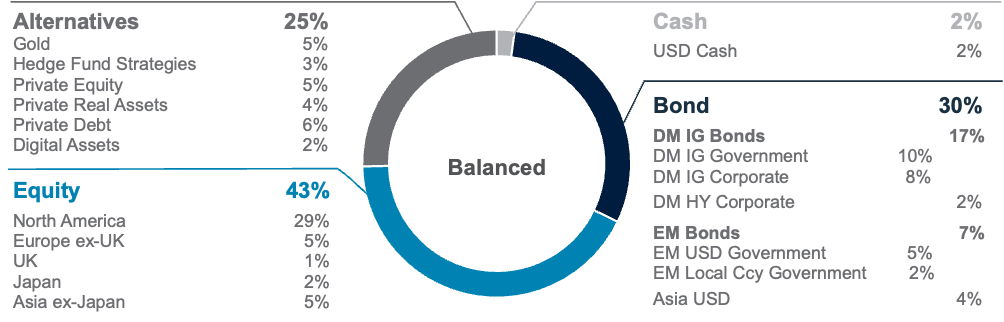
Fig. 5 Multi-asset income allocation for a moderate risk profile
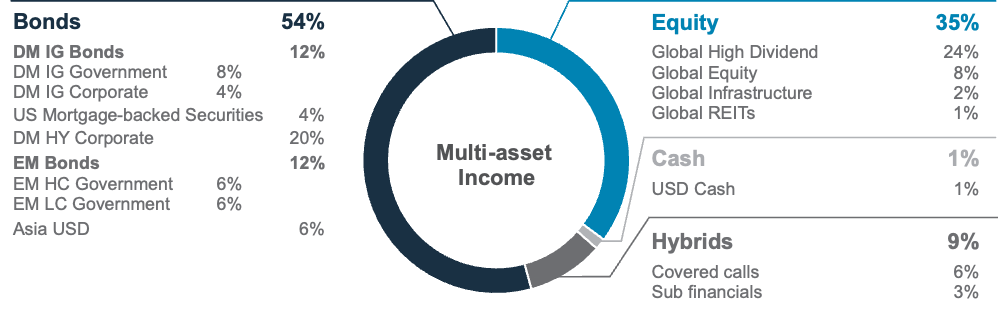
Source: Standard Chartered
Notes: (i) Developed Market (DM) IG Bonds is an aggregate of DM IG Government and DM IG Corporate Bonds; (ii) EM Bonds is an aggregate of EM USD and EM Local Ccy Government Bonds
Foundation: Our tactical asset allocation views
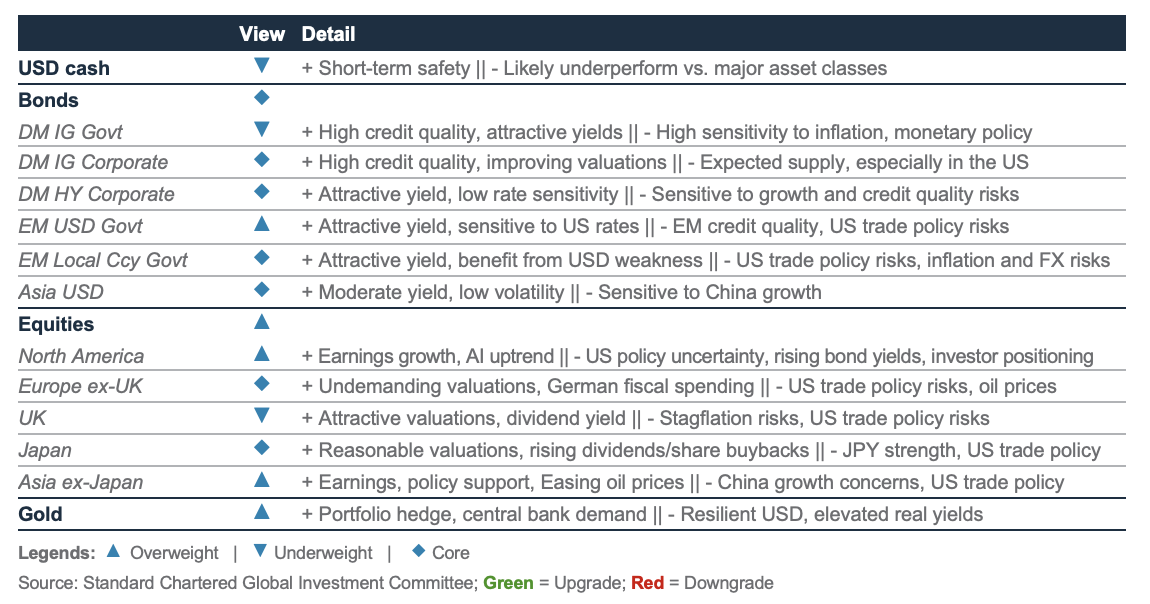
Fig. 6 Performance of our Foundation Allocations*

Source: Bloomberg, Standard Chartered; *12-month performance data from 23 September 2025 to 23 September 2026, Six-month performance from 23 March 2026 to 23 September 2026, Three-month performance from 22 June 2026 to 23 September 2026
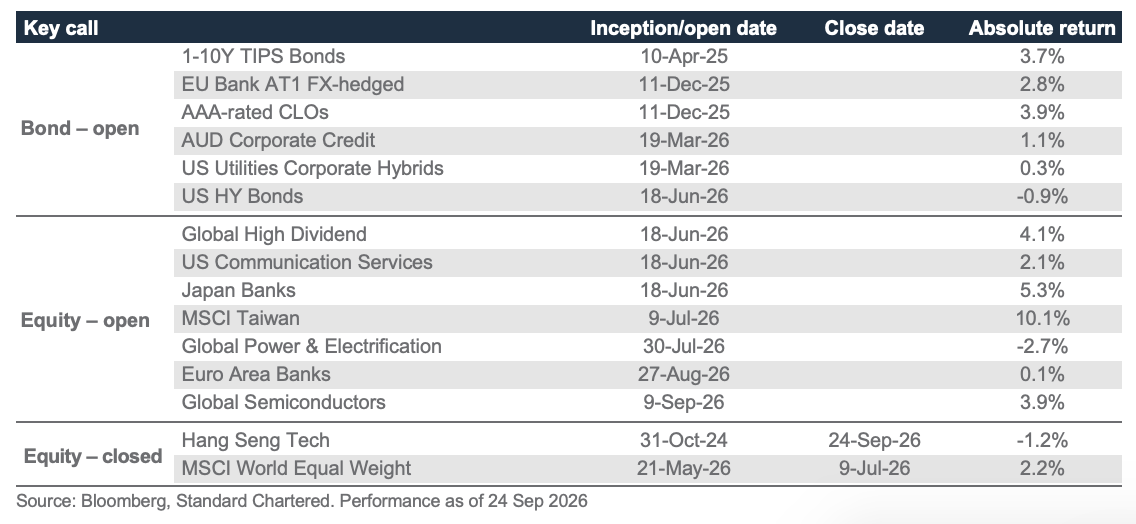
Fig. 7 Opportunistic ideas performance
Macro overview – at a glance
|
Key themes
Core scenario (soft landing, 45% probability): We have slightly reduced the probability of a soft landing from 50% by raising the odds of a ‘no-landing’. The global economy has picked up steam this summer, powered by AI investments in the US and Asia. This is reflected in robust upgrades to corporate earnings estimates and PMIs. Fiscal easing in Germany and Japan is supporting growth. Meanwhile, inflation has picked up amid higher energy prices due to a resurgent Middle East conflict. As a result, the Fed turned hawkish, hiking rates for the first time since 2023. It was joined by the ECB and BoJ – the first time all three major central banks hiked rates in the same month. We expect the Fed to hike twice more, the ECB once more and the BoJ thrice more by June 2027. Nevertheless, disinflation should return by next year as energy and tariff effects fade, enabling the Fed and the ECB to cut rates by Q3 2027. Meanwhile, China is likely to accelerate fiscal spending to revive domestic growth.
Upside risk (no landing, 30% probability): We raised the probability from 25% amid an acceleration in the AI-driven investment growth. If oil prices ease, US tax cuts, an AI-fuelled stock market boom and fiscal easing in Germany and Japan could boost “animal spirits” further. A global defence spending boom, led by the US and Europe, could also spur global growth.
Downside risk (25% probability): This tail risk scenario includes 15% chance of a stagflation unfolding if geopolitical conflicts worsen and oil stays above USD 120/bbl. We also assign a 10% chance to a recession, potentially caused by a more rapid pace of rate hikes to quell inflation, a stock market downturn negating the wealth effect, or a bond selloff due to fiscal concerns.
Key chart
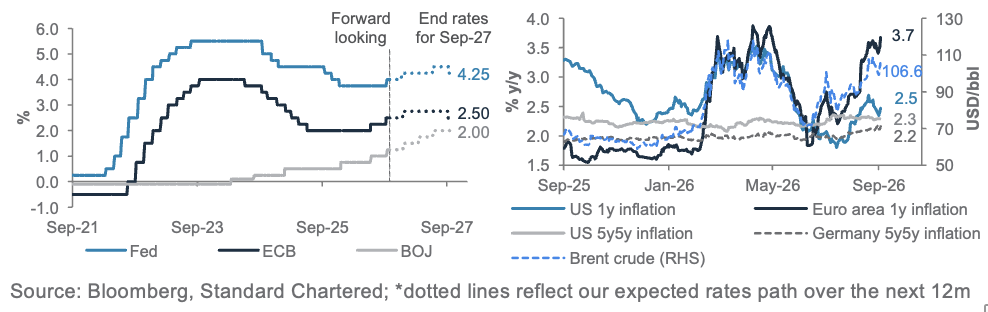
We expect the Fed to hike rates twice more, the ECB to deliver another insurance hike, and the BoJ to hike once a quarter until June 2027 to counter near-term inflation pressures.
Fig. 8 More rate hikes until June 2027, before cuts in H2 2027 as inflation pressures fade
Our policy rate outlook*; oil price and US, Euro area, German near-term, long-term inflation
Policy rates watch
Fed turns hawkish to build credibility as oil reignites inflation; likely to hike twice more by June 2027. The US economy appears resilient, with consensus estimates for 2026 GDP clustering around 2.1% for both 2026 and 2027. The main engine is the AI investment boom and hyperscaler datacentre buildout, reinforced by easy financial conditions and healthy private-sector balance sheets. The robust outlook was reflected in August’s PMI data, with both manufacturing and service sector confidence beating expectations.
The labour market has picked up this year, with average monthly payrolls of 80,000 vs. 10,000 in 2025. The unemployment rate at 4.1% suggests full employment, and the workweek lengthened in August. Offsetting vulnerabilities include a low savings rate, fading fiscal support, soft real personal spending and oil prices close to USD 100/bbl.
Inflation remains a challenge. Core PCE inflation has run above 3% every month since March, and the hawkish case rests on supercore inflation remaining around 3%, raising concerns about energy cost pass-through. Nevertheless, August’s firm inflation print came from airfares, hotels and a record jump in wireless plans (which is idiosyncratic), while shelter cooled and core goods rose just 0.7% y/y. Core consumer inflation at 2.4% y/y is the lowest since 2021, and BEA methodology changes in end-September should mechanically shave 0.2-0.3pp off historical core PCE inflation.
Following the unanimous Fed vote to hike in September, and still elevated inflation, we pencil in one more rate hike this year, followed by another 25bps hike to 4.5% by June 2027. This pace is slower than market pricing of another c. 90bps of hikes in the next 12 months. However, we expect disinflation to resume next year as the impact of oil prices and tariffs fade. This should create space for the Fed to cut rates by Q3 2027.
ECB to hike once more: Euro area activity has proved more resilient than expected. The consensus 2026 growth estimate has been revised up to 0.9%, from 0.5% as recently as July, with ECB staff projections upgraded to 1.4% for 2027 and 1.5% for 2028. Manufacturing PMIs have improved to 52.7 regionally and services PMI to 53.0, helped by German fiscal delivery and falling household savings rates. A softer Q3 looks weather-driven, due to heatwaves and low Rhine water levels, though higher energy prices and real yields still cap demand.
Headline inflation hit a near three-year high of 3.3% y/y in August and may peak around 3.4-3.6% in Q4 2026 before easing through 2027. Underlying pressures look calmer: core inflation drifted down to 2.4%, services eased, and negotiated wage growth slowed to 2.4% y/y in Q2, down from a peak of 5.6% in 2024. Long-term inflation expectations remain anchored with no evidence of second-round effects. Inflation risks are two-sided – oil above USD 100/bbl and gas above EUR 70/MWh are fuelling near-term inflation, which in turn should hurt demand, driving inflation below 2% by H2 2027.
The ECB raised its deposit rate to 2.50% in September, the top of neutral estimates. We see scope for one more rate hike to 2.75% by year-end before a pause in H1 2027. As such pricing of 95bps more tightening toward an above-3% terminal rate appears too hawkish. We expect easing of energy-driven price pressures to allow for ECB rate cuts by Q3 2027.
China to boost fiscal spending to support growth. China is entering a stabilisation phase in which production is firming, but the recovery remains narrow. The official manufacturing PMI rose to 49.8 in August from 49.2, with new orders, export orders and production back in expansionary territory, while export growth accelerated to 25.0% y/y. Momentum, however, is concentrated in high-tech and export manufacturing: retail sales, fixed-asset investment and credit growth remain soft, and the property downturn has yet to bottom. Full-year 2026 growth should land near 4.5–4.6%, broadly in line with the official 4.5–5% target, as domestic demand stays weak.
Reflation is under way, but shallow and cost-driven rather than demand-led. Headline consumer inflation edged up to 0.8% y/y in August and producer inflation to 3.8%, lifted by higher commodity and energy prices and by official efforts to curb excessive price-cutting. Full-year inflation is expected around 0.8–1.0%, against roughly zero in 2025, with producer inflation swinging from −2.6% to about +2.5%. The persistent supply-demand imbalance should cap the reflation impulse.
0.8–1.0%, against roughly zero in 2025, with producer inflation swinging from −2.6% to about +2.5%. The persistent supply-demand imbalance should cap the reflation impulse.
Policy settings remain supportive, but with no rush to stimulate. Fiscal policy takes the primary role via faster spending and utilisation of bond proceeds, with broad fiscal spending potentially accelerating in H2 versus a sharp contraction in H1, and the augmented fiscal deficit widening modestly. Monetary policy plays a complementary role: a 25bps cut in bank reserve requirements is likely, while the policy rate should stay unchanged. Slow public financing raises the likelihood of further policy fine-tuning this autumn.
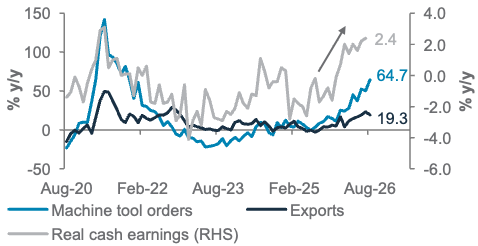
BoJ to hike once a quarter until Q2 2027. Japan’s economy is proving more resilient than expected. The consensus 2026 growth estimate has been revised up over the past month to 0.8% from 0.6%. Exports rose 19% y/y in August, a twelfth consecutive y/y growth, while core machinery and machine tool orders indicate higher borrowing costs have yet to dent corporate investment appetite. Real wages climbed 2.4% y/y in July, the strongest since May 2021. The weak link is the household sector: spending continued to contract y/y, leaving an unusual two-speed economy in which external and corporate demand carry growth while domestic demand lags.
Underlying inflation sits close to the 2% target, with pressure building upstream rather than from demand. Energy and commodity prices have risen sharply and earlier yen weakness has amplified import costs, with producer inflation running well ahead of CPI. The 10-year breakeven inflation has risen close to May’s record high of 2.3% amid growing risk of pass-through from producer to consumer prices.
Bank of Japan Governor Ueda, after raising rates by 25bps to 1.25% in September, alluded to rising inflation pressures, stating the policy environment has shifted to a “new phase”. He added that the BoJ must now act to prevent inflation from overshooting, rather than simply trying to reach the 2% target. September’s BoJ decision came in a 7-2 split vote, with two members nominated by Prime Minister Takaichi calling for a hold. However, Ueda’s post-decision comments lead us to believe that the BoJ board will be comfortable with a 25bps rate hike every quarter until Q2 2027, taking the rate to 2%.
Fig. 9 China exports boom, domestic demand weak
China’s exports, retail sales, industrial output, fixed investment
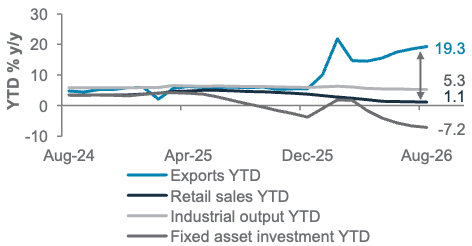
Fig. 10 Japan’s wages accelerating, while exports surge
Japan’s real cash earnings, machine tool orders, exports
Asset classes
Fixed Income – at a glance
|
|
||||
|
|
||||
Our view
Foundation: Fixed income assets are a core holding (Neutral) in our portfolios. Within the asset class, we maintain an Overweight stance on EM USD government bonds and an Underweight stance on DM government bonds.
The Fed’s decision to hike rates in the past week confirms our expectations of a central bank willing to establish its independence against political pressure. The Fed’s moderately hawkish pivot is helping restore its inflation-fighting credentials. We expect Fed to hike twice, one by year-end and another hike in H1 2027 to bring the Fed funds rate to 4.5%. The price reaction in the US government bond yield curve leads us to believe the short-to-middle part of the curve has factored in most of the rate expectations. We now prefer to add positions in the 3-7-year bond maturity bucket. As oil price moderates in H2 2027, we see room for the Fed to contemplate rate cuts. That would also enable 10-year yields to come down, alongside the front end of the curve. Meanwhile, solid corporate fundamentals and supportive technicals should keep yield premiums tight, even if the scope for further compression is limited. In EM, we continue to favour EM USD over local currency (LCY) government bonds.
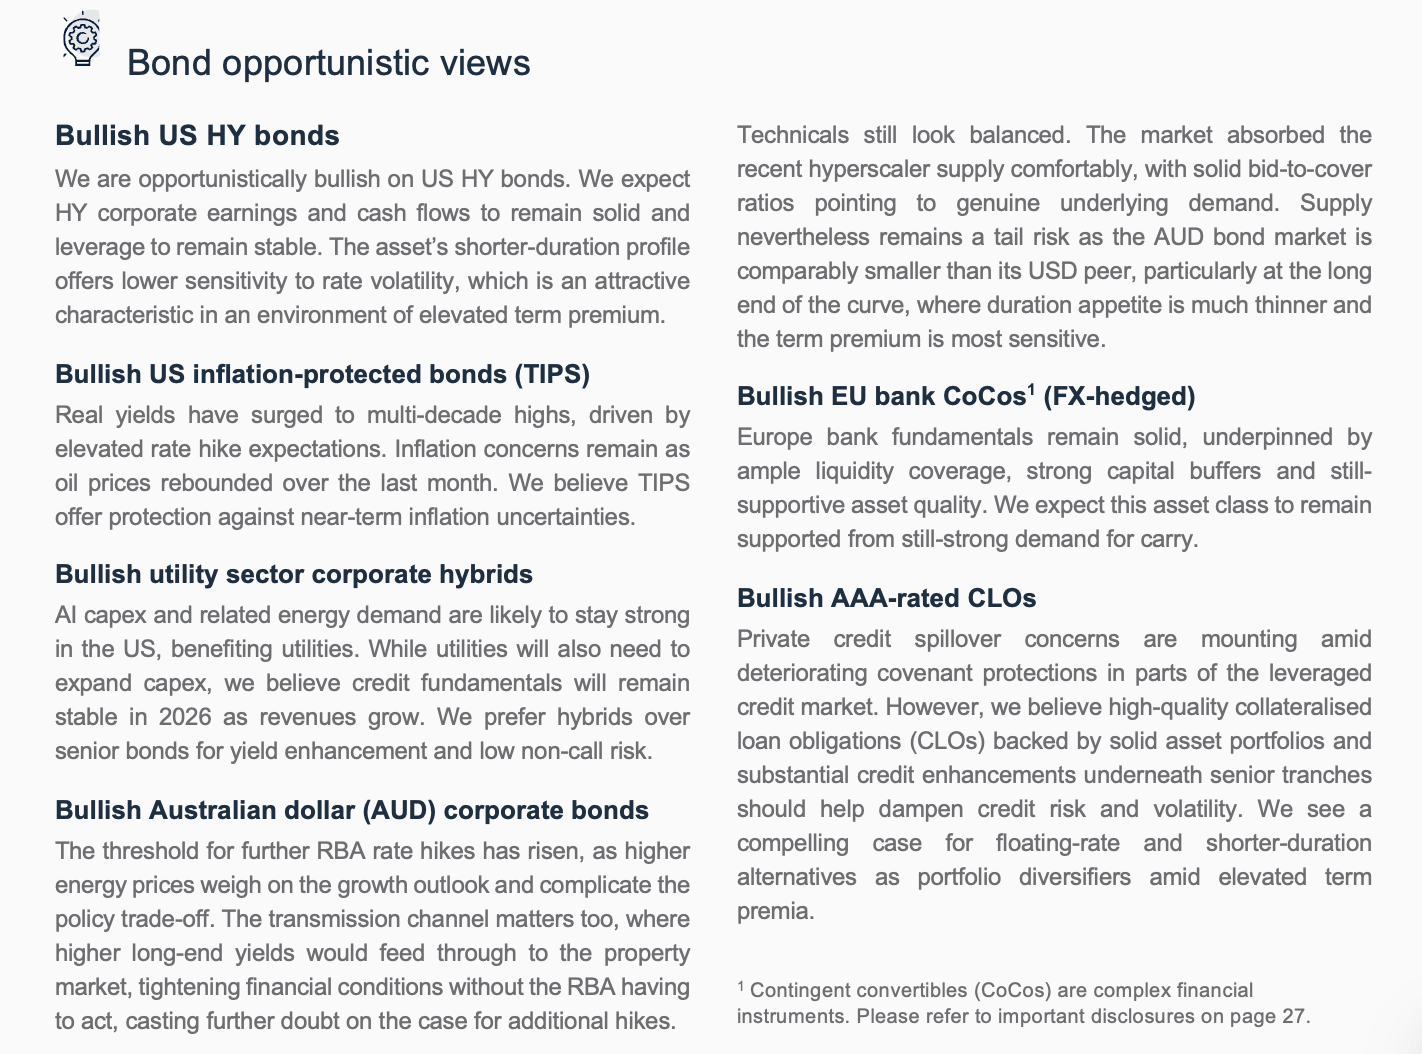
Opportunistic ideas: We are bullish on European bank additional tier-1 (AT1) bonds (contingent convertibles [CoCos1]; FX-hedged), US TIPS, AAA-rated CLOs, US utilities corporate hybrids, broad US HY and AUD corporate bonds.
Key charts
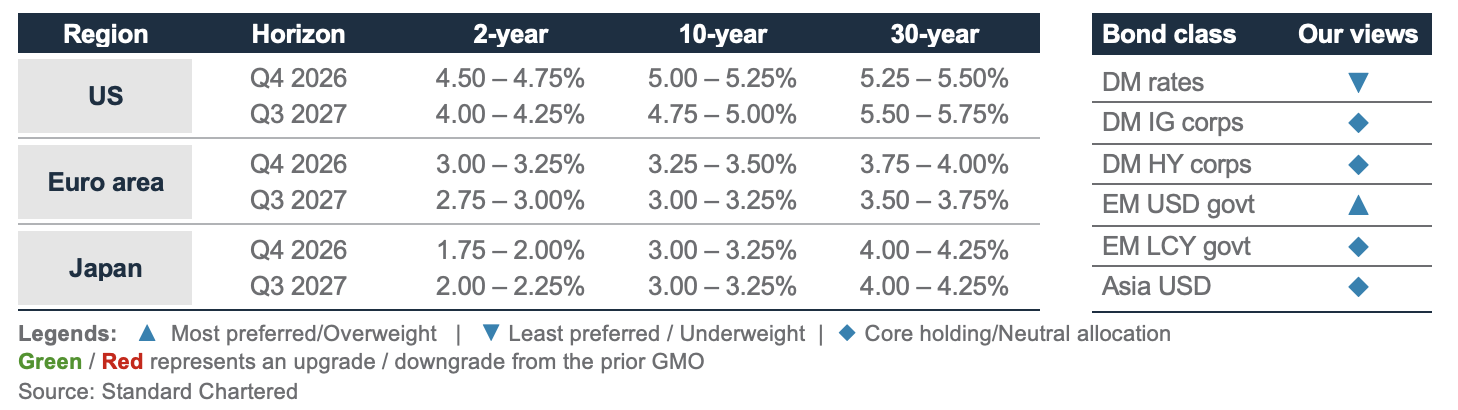
Fig. 11 Rate forecasts and our view of bond classes
DM rates – Underweight
We are Underweight DM government bonds. In the US, the Fed’s policy pivot this month followed Chair Warsh’s hawkish Jackson Hole speech and recent economic data prints, including a pick-up in job creation and inflation over the summer and a sharp rebound in oil prices due to the re-escalation of the Middle East conflict. Given the unanimous Fed decision to hike rates this week, we expect two more hikes by June 2027 on the back of robust growth amid strong AI investments and a balanced labour market, keeping inflation elevated.
Over the next few months, we expect the 2-, 10- and 30-year US government bond yields to remain rangebound, with the 10-year yield trading in the 5.00-5.25% range. The reasons for this include: 1) oil prices staying elevated and potentially rising further due to the fluid geopolitical situation in the Middle East; 2) AI capex plans showing no signs of slowing down, which continues to drive above-trend growth in the economy and AI-related heavy bond issuance. While short-covering trades could move bond yields lower temporarily as net-short
positions in US government bond futures have reached extreme levels, we think such downshifts would be short-lived. By H2 2027, we expect oil prices to moderate and the inflationary effects from tariffs to fade, allowing the Fed to contemplate rate cuts. US 30-year yields, on the other hand, are expected to remain elevated as the US fiscal deficit remains substantial next year. In addition, we do not think the so-called ‘Bessent put’ – expanding purchases of long-dated bonds, while skewing new issuance towards shorter maturities – will be effective as this does not address the fundamental issues of rising debt levels. These factors are likely to keep the ‘term premium’ elevated.
In the Euro area and Japan, the ECB and BoJ also hiked rates this month. It is the first time on record all three – Fed, ECB and BoJ – have hiked in the same month, as they respond primarily to a resurgence in energy-driven inflation amid tight job markets. BoJ is expected to continue hiking once every quarter till mid-2027 as we believe the bank is behind the curve and will need to speed up the pace of rate hikes.
DM corporates – Core holding
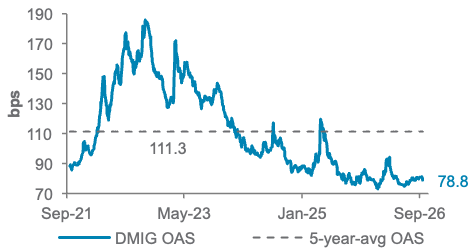
We maintain a Neutral allocation to both DM IG and DM HY corporate bonds, with a tactical bias to add exposure on episodic weakness, as carry continues to dominate total returns across developed market credit. Yield premiums have bounced but remain close to historical lows, while yields are still attractive, reinforcing a carry-led stance. This tight spread regime is anchored by robust issuer fundamentals, strong profitability, and resilient balance sheets, despite a visible moderation in rating upgrades over the past quarter.
Fig. 12 AI issuance challenges IG technical backdrop
AI issuance (total & share of total), US IG gross issuance
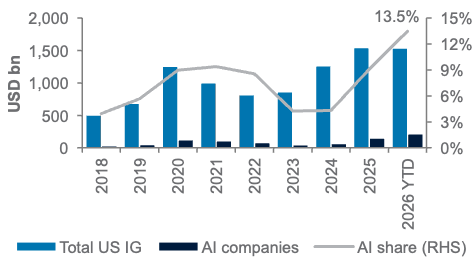
Technical supply dynamics are reshaping sector dispersion, particularly in the IG space, where heavy issuance related to AI continues to weigh on the long end of the curve. AI-driven supply is approaching USD 220bn for 2026 in US IG and accounting for an increasingly significant share of gross issuance and crowding out other long-dated maturity bonds. We maintain a preference for selectivity at the long end, favouring the front to belly of the curve (3-7 years maturity) where risk-adjusted carry remains most durable. Issuance-driven concessions in sectors with strong capital expenditure cycles (notably technology, capital goods, and basic industries) present opportunities for investors who can stomach near term volatility, especially when fund flows have remained robust: so far this year, high grade funds have seen cumulative inflows of ~8% of AUM.
Fig. 13 DM IG spreads have bounced lately, but remain near historical lows
Bloomberg Global Aggregate Corp Index, option-adjusted spread (OAS)
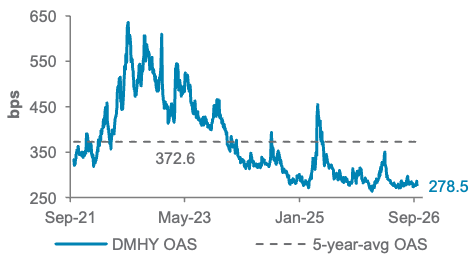
As an income proposition, DM HY continues to be well supported, with all-in yields in the mid-7% range and default rate still below trend for US HY in 2026. The shorter duration profile of HY, combined with its lower sensitivity to term premium and rate volatility, makes it an attractive sleeve in the current phase of the cycle. Despite experiencing net outflow YTD, HY demand has recovered from a net outflow position in the past 1-2 months, underscoring broad investor appetite for carry strategies even as spreads remain tight. We remain attentive to evolving rating migration trends and sector-specific supply pressures, particularly as upgrades slow and new issuance clusters around key themes. However, we continue to see HY bonds as core holding allocations driven by healthy issuer fundamentals and stable credit metrics.
Fig. 14 DM HY spreads are near historical lows as well
Bloomberg Global HY Aggregate Corporate Index, OAS
EM government bonds – Overweight USD, core holding for local currency (LCY) bonds
We retain an Overweight position in EM USD government bonds and retain EM LCY government bonds as a Core holding, reflecting a balanced perspective across both regional performance and currency dynamics. In EM USD sovereign debt, periods of spread widening have been brief and shallow, with attractive carry drawing sustained demand amid resilient global growth and stable external conditions. Issuance patterns remain front-loaded across many regions, reinforcing supportive technicals; relatively light investor positioning contributes to contained risk of unwinding and limits market impact during episodes of moderate outflow.
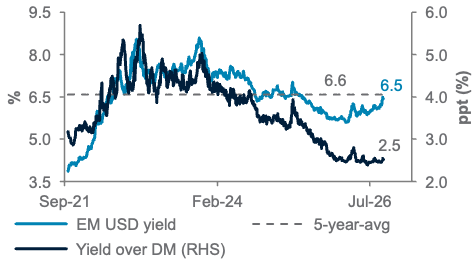
Regional nuances are increasingly notable. Latin America’s sovereign debt has tended to outperform, supported by more proactive monetary policy responses and firmer external balances. In Asia, higher-rated issuers offer valuable buffer during bouts of global rate volatility, while select frontier exposures within Africa and EMEA remain more sensitive to liquidity shifts and changes in risk appetite. Index composition also shapes resilience: the EM USD benchmark is less exposed to oil price shocks as non-oil importers represent a large share of exposure compared to the LCY universe. These features are particularly important as spreads across EM USD sovereigns hover near historically tight levels, leaving limited room for error. We expect returns to be primarily driven by carry rather than further spread compression.
Fig. 15 EM government bonds offer a pick-up of 2.5% in yields over DM peers
Bloomberg EM USD Government Bond Index, yield to worst
EM LCY debt faces additional headwinds, especially as elevated US real yields and an appreciating USD dampen demand from foreign investors and reduce the comparative attractiveness of broad-duration strategies. However, real yields remain comparatively supportive in several markets, and current valuations signal ongoing selective opportunities, especially given the restrictive monetary policy stances prevalent across many EM economies. Accordingly, EM LCY bonds retain their Core holding status, with portfolio emphasis
placed on country selection and measured duration exposure, reflecting the differentiated currency dynamics at play.
Key risks to both USD and LCY segments include the potential for Middle East conflict escalation and higher oil prices. Renewed hawkishness from the US Fed supporting further USD strength and weather-related disruptions – such as the effects of El Niño – could prolong inflation pressures and disrupt disinflation progress in vulnerable EM regions.
Asia USD bonds – Core holding
We retain a Neutral allocation to Asia USD bonds, an asset class that continues to reward investors with attractive nominal yields, favourable supply-demand technicals and robust credit fundamentals. Healthy corporate cash flows, low leverage and a high share of sovereign-linked issuers lend the segment a defensive quality relative to broader credit.
The resilience has been evident year to date. Asia USD bonds have outperformed, from a total return angle, both DM government and DM IG corporate bonds. We expect this relative strength to persist. The combination of carry and credit quality (more than 60% are sovereign and sovereign-related issues) anchors our conviction in the asset class even as we maintain a Neutral stance.
Equity – at a glance
|
|
||||
|
Our view
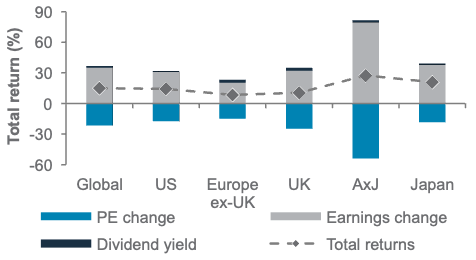
We are Overweight global equities as we expect solid earnings growth to drive the market higher. The wave of central bank rate hikes in September represent a near-term headwind to equity valuations, but these have been largely priced into markets by the rise in bond yields year-to-date. We expect earnings growth to offset valuation headwinds. We are Overweight US and AxJ equities, where AI adoption continues to drive growth in the technology and adjacent sectors.
Within AxJ, we remain Overweight Taiwan, with good visibility on AI-driven growth. We lower China to a Core holding, as the valuation re-rating potential appears delayed. Within AxJ, we maintain core allocations to South Korea and India, and we are Underweight on ASEAN equities.
We maintain a Core allocation to Japan, as nominal growth supports broad earnings revision, and a Core allocation to Europe ex-UK, which is enjoying an earnings inflexion. We remain Underweight UK equities, which lacks exposure to growth sectors.
Key chart
Earnings growth is driving gains in equities.
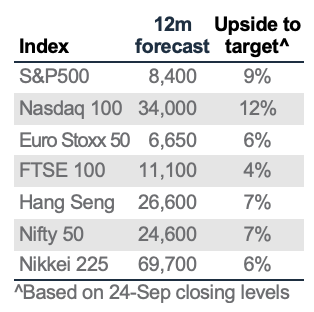
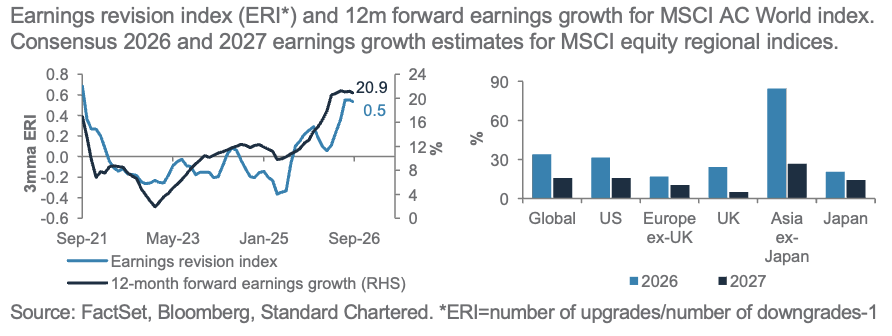
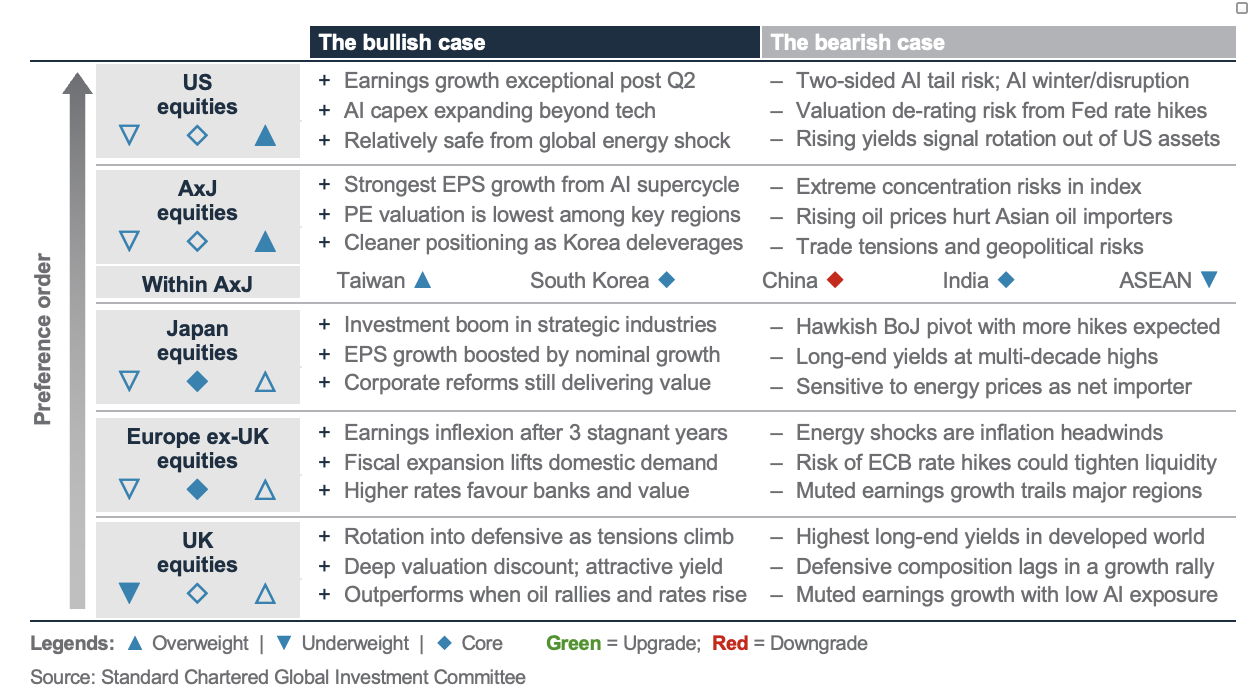
Fig. 16 Broad-based earnings strength is supporting global equities. Our Overweight views on AxJ and US equities are supported by robust earnings growth.
Expansion at a solid pace
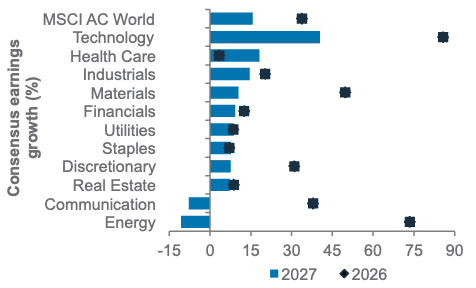
With economic activity expanding at a solid pace, we expect earnings growth to fundamentally drive global equities higher. Heading into 2027, rising AI adoption continues to drive strong growth in the technology sector. Recent debates about regulating the pace of model developments could influence the mix of AI spending, with differing impacts on various parts of the AI value chain. However, rising adoption and growth in AI use cases should support massive growth in capex, benefitting the semiconductor industry, cloud service providers and internet platforms. The capex benefits also spillover to other industries providing the power infrastructure, materials and financing of the investments. The risks are a slowdown in AI capex or net job losses from AI disruption, but we do not see these having a significant impact yet.
Rate hikes from central banks represent a headwind for equity valuations, although this has been largely priced in by bond markets, given the rise in yields we have seen this year. Further rate hikes are being priced by the market. However, we expect these headwinds to be offset by solid earnings growth in global equities: at 34% in 2026 and 16% in 2027.
Fig. 17 Global equities continue to be supported by strong earnings growth, led by the technology sector
Earnings growth by sectors for MSCI AC World index
US equities – Overweight
US equity valuations have softened this year as strong earnings growth have outpaced the rise in the market.The 12m forward P/E of around 20x remains at a premium to other markets but justified, in our view, by the high returns on equity, differences in sector composition and superior growth outlook. In the run-up to US mid-term elections in November, we would not be surprised to see higher volatility, though we would use any undue corrections as opportunities to add exposure.
AxJ equities – Overweight
AxJ enjoys the strongest earnings growth among major markets, as its technology sector remains a key beneficiary of the AI capex cycle. AxJ also has the lowest P/E valuation, given the earnings surge has not yet beenreflected in the market. Within AxJ, we are Overweight
Taiwan, which benefits from clear visibility on AI-driven growth and dominance in manufacturing advanced AI chips.
We lower China to a Core holding as the valuation re-rating potential now appears delayed. Share placements for AI spending will likely continue, diluting earnings. Regulatory concerns still linger from US restrictions on AI chips and distillation accusations, even as the Trump-Xi summit signals a mutual desire for steady ties. Looming offshore trust taxes may lead to further sell down pressures, while domestic demand remains weak. However, valuations remain inexpensive with rapid tech innovation and AI-localisation investments. Policy stimulus could provide upside.
South Korea equities remain a Core holding. We are positive on the long-term agreements giving greater earnings visibility on memory chips. Positioning is also cleaner, with reduced foreign investor exposure and declining leveraged ETFs. India remains a Core holding amid positive earnings revision and strong domestic demand, alongside macro headwinds from RBI rate hikes. We remain Underweight on ASEAN, as oil shocks and a supported USD could weigh on the region, although Singapore offers defensive growth.
Fig. 18 Global equity valuations have declined this year, with market gains led by earnings growth
Composition of returns YTD for regional MSCI equity indices
Japan equities – Core holding
Rising nominal economic growth is supporting solid broad-based earnings revisions, with rising rates supportive of bank earnings. The fiscal support for strategic industries is also pro-growth, offsetting energy shocks.
Europe ex-UK equities – Core holding
Europe ex-UK is seeing an earnings inflection after three stagnant years, with rising rates supportive of banks’ earnings. Fiscal expansion is benefitting domestic demand and the industrial sector, although earnings growth in the region still lags that of the US and AxJ.
UK equities – Underweight
The UK lacks exposure to growth sectors, with relatively muted earnings growth. We expect this to weigh on the UK, making it lag the performance of other markets.
Equity opportunistic views
|
|
||||
|
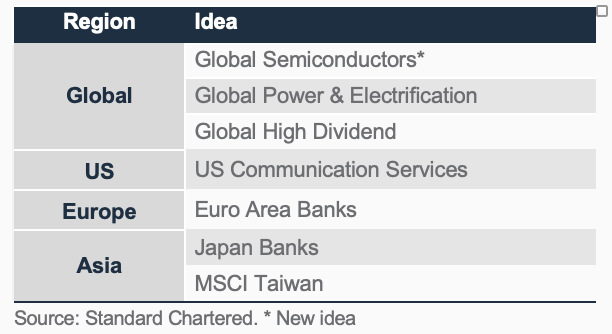
Add Global Semiconductors, remove HSTECH
We initiated an Opportunistic Idea on Global Semiconductors on 9 Sept 2026. We expect sustained AI investments and rising AI adoption to support earnings growth, with demand widening beyond processors to memory, networking, and advanced manufacturing equipment. Valuations have also eased since the middle of the year.
We remove Hang Seng Technology (31 Oct 2024 to 24 Sep 2026: -1.2%) amid mixed earnings trends, while AI monetisation has yet to keep pace with rising investments. Widening US-China tech restrictions adds to the uncertainty, and we see better risk-adjusted opportunities elsewhere.
Fig. 19 Opportunistic ideas
Ongoing Opportunistic Ideas
Euro area banks: A higher-for-longer rates backdrop should extend the earnings upcycle, with further ECB tightening expected. Corporate loan demand is showing recovery, while non-interest income is growing. Strong capital generation supports higher dividends and continued share buybacks.
Global Power & Electrification: Rising AI and data centre power demand should drive a multi-year grid and electrification investment cycle. Power availability and grid capacity are emerging bottlenecks to the AI infra buildout. Addressing these constraints requires capex and time, which supports strong earnings visibility for grid equipment makers.
Japan Banks: BoJ policy normalisation drives net interest margin upside, while Japan’s reflation cycle supports nominal loan demand, corporate capex and wealth activity. Governance reform is a re-rating driver independent of the rate cycle. This includes recycling legacy holdings towards growth, buybacks and dividends.
MSCI Taiwan: Taiwan’s foundry leadership makes it a critical supplier to global tech firms, while its broadening AI hardware supply chain is driving strong revenue growth.
Global High Dividend payers: Provides a higher-income equity allocation with historically lower volatility than the MSCI ACWI and modest downside cushioning on balance.
US Communication Services: We remain constructive and expect further upward earnings revisions, driven by improving digital ad-spending and AI monetisation.
Sector views: Continue to broaden & diversify
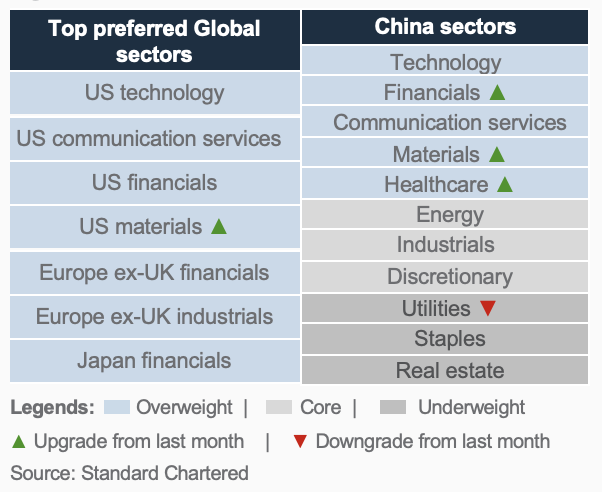
We upgrade US Materials to Overweight as robust capex drives demand for industrial metals and construction materials, while we remain bullish on gold. US Technology and Communication Services remain the primary growth engines, supported by structural AI tailwinds. We remain Overweight in Financials across the US, Europe ex-UK, and Japan, underpinned by earnings stability and elevated rates supporting interest income. This is further supported by a US capital markets recovery and European balance-sheet strength. We remain Overweight in Europe ex-UK Industrials, reflecting EU fiscal stimulus and Germany’s infrastructure acceleration legislation.
In China, we broaden our Overweight exposure by upgrading three sectors: Materials (benefiting from structurally elevated commodity prices), Healthcare (biotech innovation and a robust pipeline sustaining growth), and Financials (easing margin pressure, fee recovery, and capital market reform). Our existing Overweight positions in Technology and Communication Services maintain exposure to China’s AI build-out, with fiscal deployment into high-tech infrastructure serving as a near-term catalyst. On the other hand, we downgrade Utilities to Underweight on capped margins and retain our Underweight views on Real Estate and Consumer Staples.
Fig. 20 Our sector views
Gold, crude oil – at a glance
|
Our view
- We maintain our Overweight on gold, and our 3 – and 12-month price targets at USD 4,750/oz and 5,000/oz, respectively.
- We raise our 3-month West Texas Intermediate (WTI) oil forecast to USD 100/bbl and 12-month target to USD 80/bbl.
Key chart
Fig. 21 Futures positioning in gold eased on Fed repricing while longer-term ETF holders stayed put
Gold net managed money positions vs ETF holdings
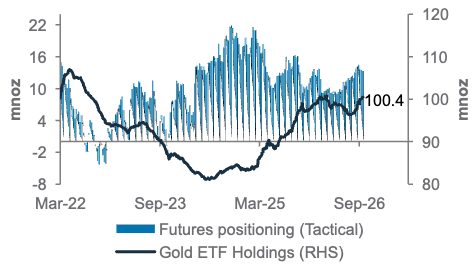
Fig. 23 Other Gulf oil producers have offset the loss of Saudi exports
Middle East crude exports, million barrels per week
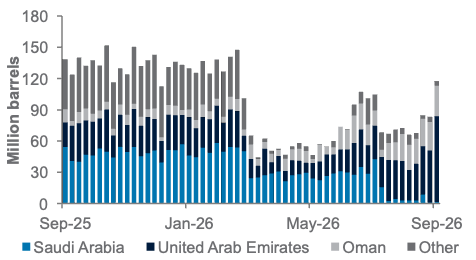
Fig. 22 Central bank gold buying has slowed from recent years, but more countries are participating
Top 10 central bank gold buyers, 2026 year-to-date
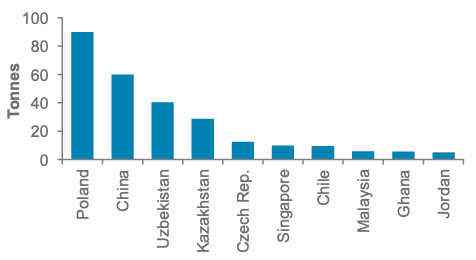
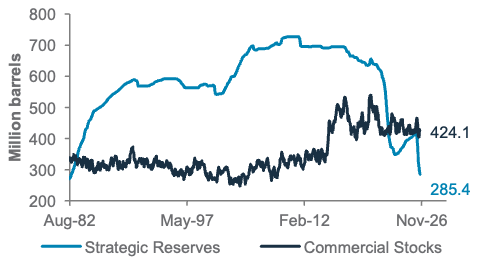
Fig. 24 US strategic oil reserves remain near multi-decade lows while commercial stocks are healthy
US commercial stocks vs Strategic Petroleum Reserve, mb
Gold outlook: Gold has remained resilient despite a more hawkish Fed and higher real yields, suggesting much of the tightening is already reflected in prices. With markets discounting an aggressive Fed path, we see an increasingly asymmetric risk-reward: limited downside risk from further rate repricing, but meaningful upside should Fed rate expectations shift towards being less restrictive. Official-sector demand has slowed from recent years but has become broader based, while investor positioning remains well below levels seen at the start of the 2022 hiking cycle.
Oil outlook: Oil prices have risen sharply as recent attacks cast greater uncertainty over Saudi exports, even as Gulf crude flows overall remain resilient. Other regional producers have helped sustain exports, containing the immediate supply impact. However, adequate US commercial crude stocks mask thinner buffers elsewhere, with strategic reserves and fuel inventories low. This leaves the market more vulnerable to a prolonged disruption, supporting a higher geopolitical risk premium and an upward revision to our outlook.
FX – at a glance
|
|
||||
|
USD view
Further Fed tightening supports the USD near term. We expect the USD to remain supported, with our 3-month DXY forecast at 100.2. Resilient US payrolls for August alongside sticky energy and IT price-driven inflation reinforce the Fed’s focus on containing inflation. Following its 25bp hike to 3.75–4.00%, we expect another hike by end-2026 and potentially another one in early H1 2027. Further tightening should keep US front-end yields elevated and support the USD. However, money markets already price a more aggressive Fed hiking path than our expectations, limiting the scope for further USD gains and leaving the USD vulnerable if incoming data weaken the case for additional hikes.
Fading inflation and narrowing rate advantage point to a softer USD in the medium term. We expect the USD index (DXY) to decline gradually towards 98 over 12 months. Inflation pressures are expected to moderate as the impact of oil prices and tariffs fade, reducing the need for continued Fed tightening. We forecast that the Fed funds rate may peak in H1 2027 in the current mini-rate hike cycle and then gradually decline thereafter as inflation moves closer towards target, supporting our DXY call. Further ECB and BoJ tightening should also progressively narrow the USD’s relative rate advantage, supporting gradual USD moderation. Resilient US growth and elevated government bond yields should, however, limit the pace of depreciation.
Key charts
Fig. 25 Higher US front-end yields support near-term USD strength
USD Index (DXY) and US 2-year government bond yield
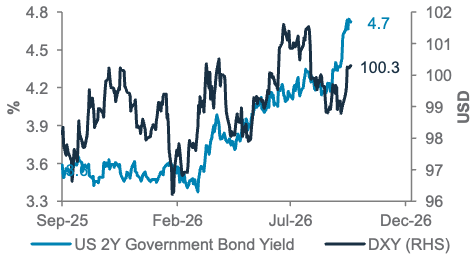
Fig. 27 Wider US-German rate gap caps EUR upside
EUR and US-German 2-year government bond yield differential
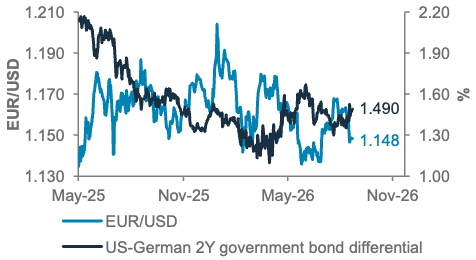
Fig. 26 Wide yield differentials support USD/JPY, but BOJ policy normalisation should narrow the gap
USD/JPY and US-Japan 2-year government bond yield differentials
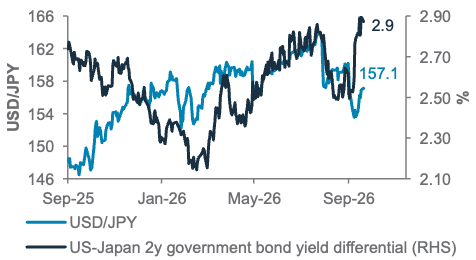
Fig. 28 GBP/USD is expected to trade within the 1.30-1.36 range, with downside risk
GBP/USD
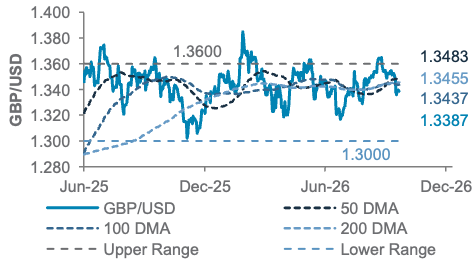
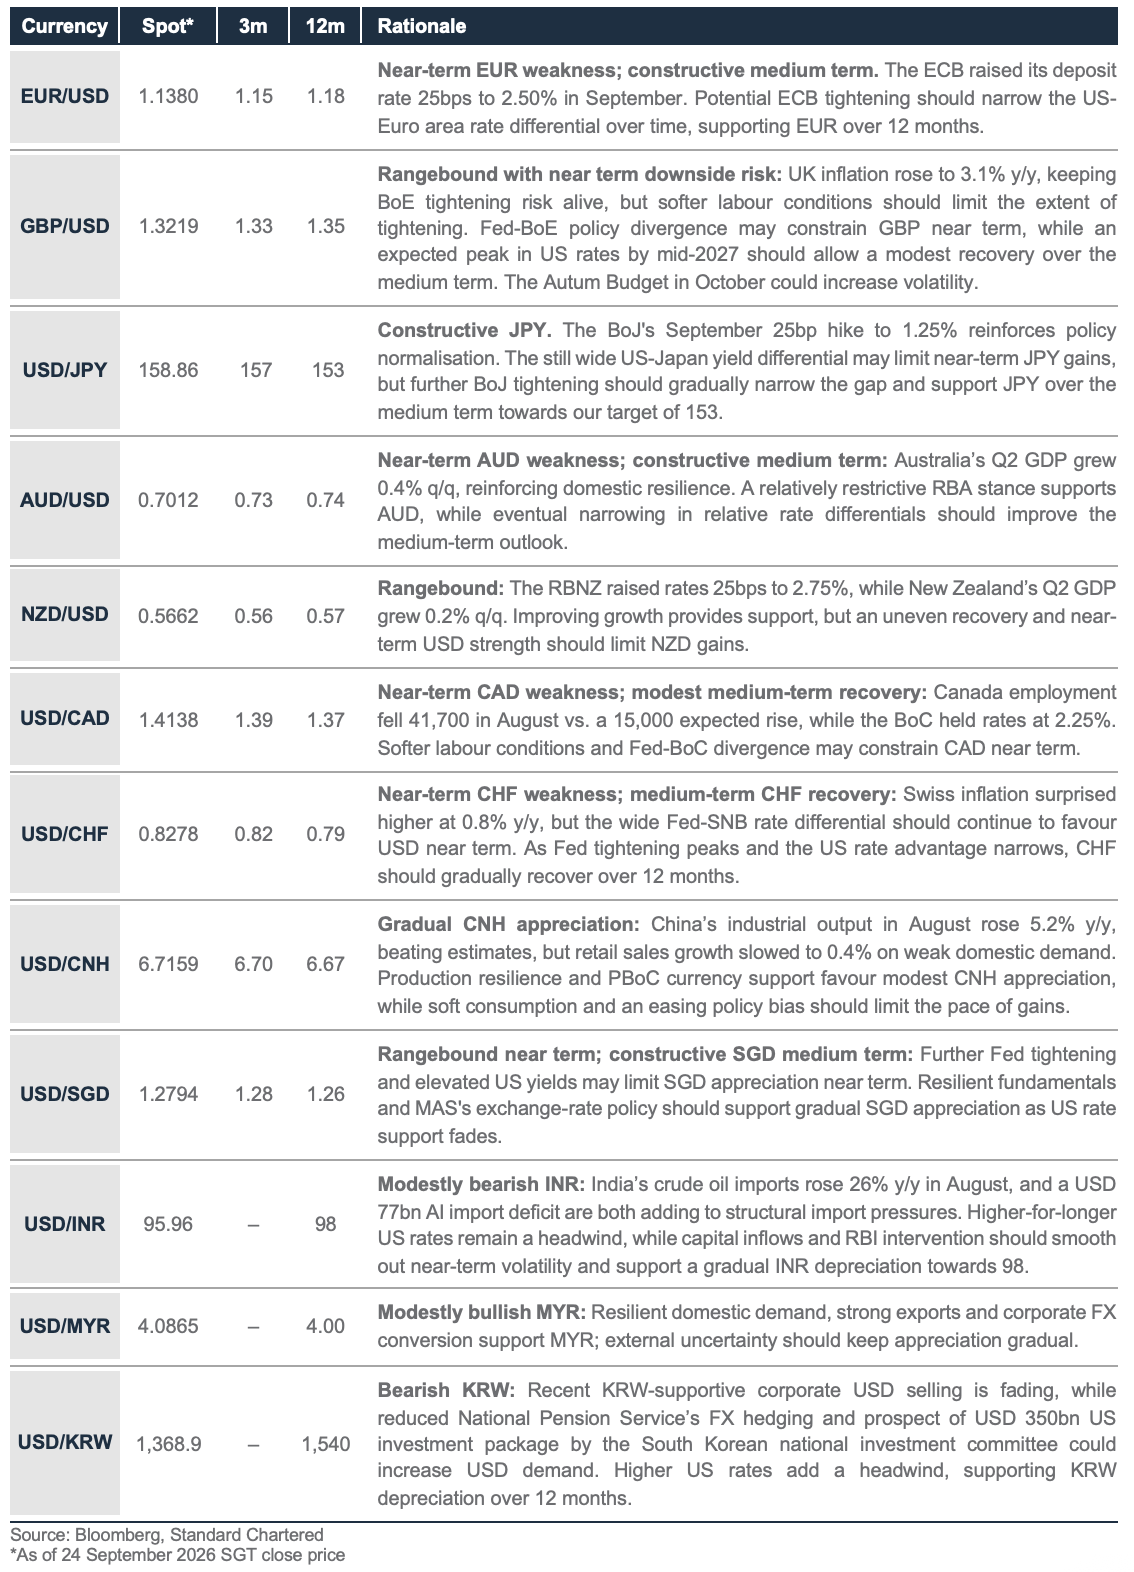
Fig. 29 Summary of G7 and select Asian FX forecasts and drivers
Additional perspectives
Quant perspective: Raising equity Overweight as positioning improves
|
|
||||
Summary
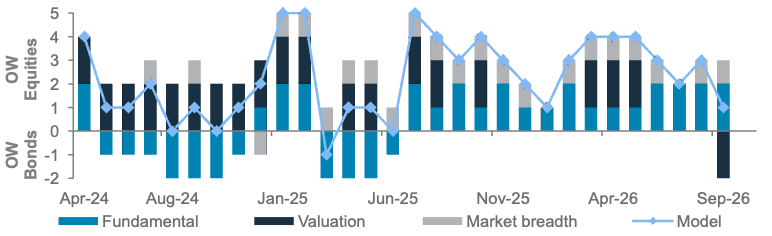
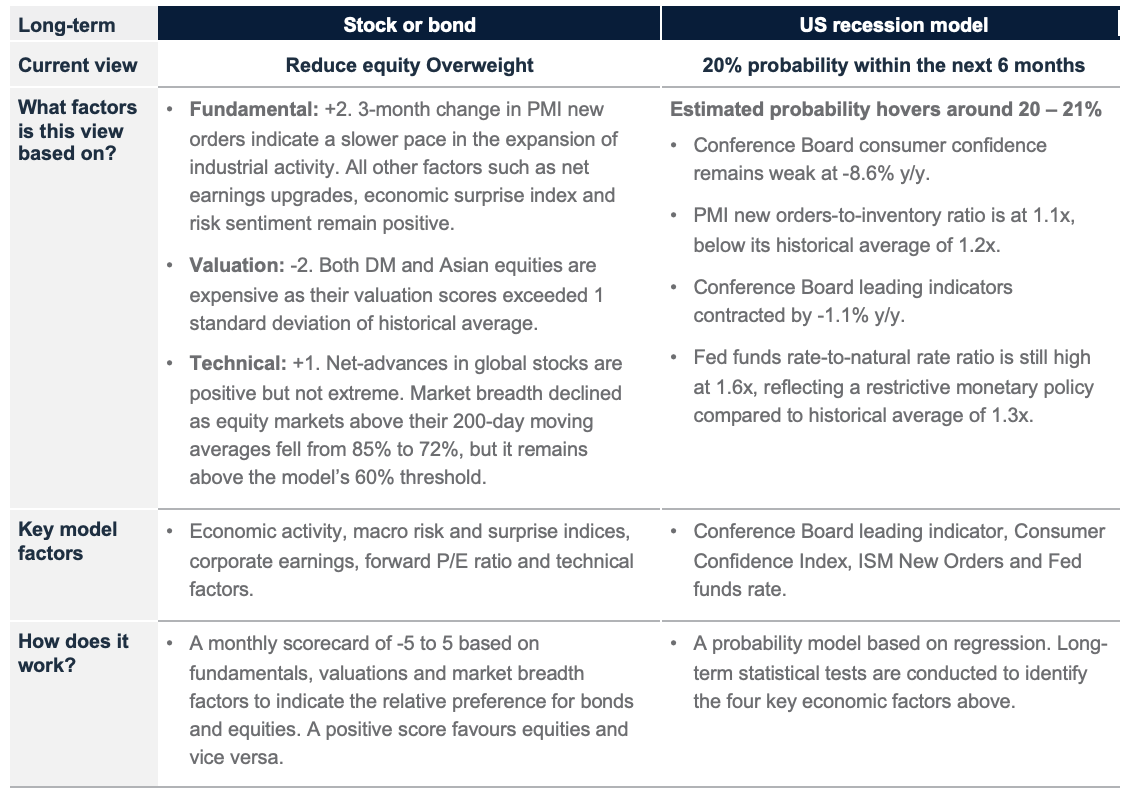
Our stock-bond model (3-6 months) reduced its Overweight allocation to global equities to +1 from +3 (maximum +5) in September. The downgrade was driven primarily by a weaker valuation signal as valuation score fell to -2 for both Developed Market and Asian equities. Despite some moderation, fundamentals remain strongly supportive of equities. Positive factors include resilient net earnings upgrades, a positive economic surprise index, and PMI new orders remaining above 50, signalling continued expansion in industrial activity. Market technicals weakened but continued to support equities overall. Our market breadth indicator shows that 72% of equity markets remain above their 200-day moving averages. Stock net advances are positive and not at levels that would typically signal an imminent market reversal. The stock-bond model continues to outperform strongly, generating 4.2% alpha YTD relative to the 60/40 equity-bond benchmark.
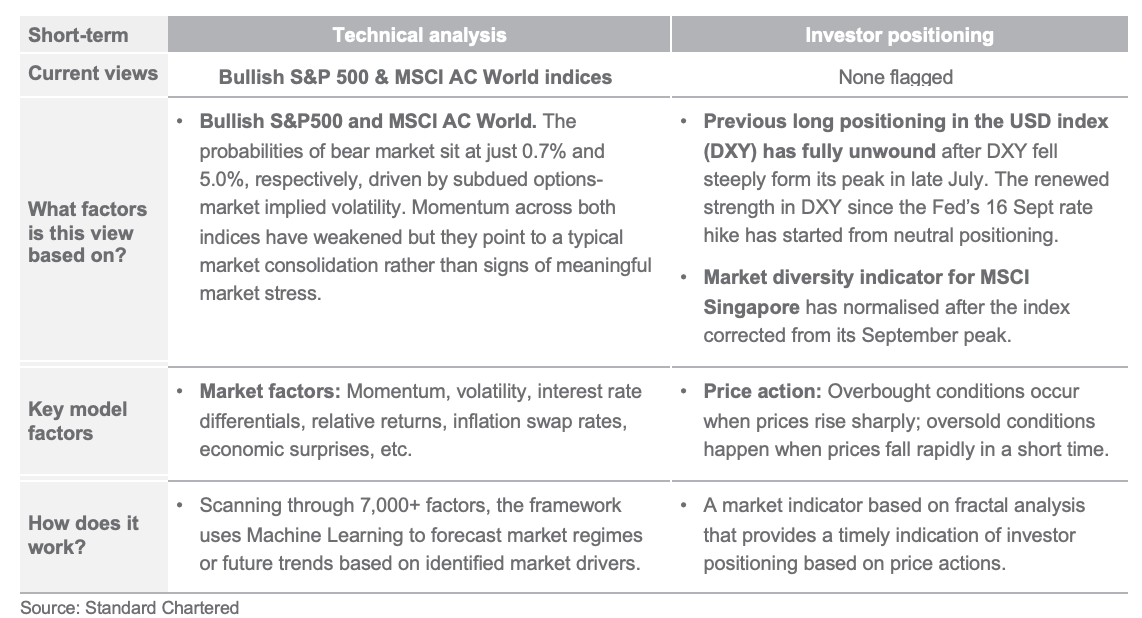
Our 1–3 month equity market regime models continue to signal low bear market risk, with probabilities of just 0.7% for S&P 500 and 5.0% for MSCI AC World indices. The low readings continued to be driven by subdued option-market implied volatility. At 14 – 15%, the VIX and market cap-weighted one-month implied volatility measures for Europe and US remain comfortably below the 20% threshold at which bear market risk tends to rise sharply. While momentum indicators have softened, they point to a typical market consolidation rather than signs of meaningful market stress.
Our positioning indicators are not signalling any reversal risk. Previous long positioning in DXY has fully unwound and our market diversity indicator for MSCI Singapore has also normalized after the index corrected from its September peak.
Key chart
Our stock-bond model reduced its Overweight equity position as valuation weakened.
Fig. 30 Breakdown of our stock-bond rotation model’s scores
Our model reduced equity Overweight to 8% from 24% as the model score fell to +1
VIX has fallen to 15.6%, comfortably below the 20% threshold at which bear market risk tends to rise sharply. Softer market momentum remains consistent with consolidation rather than meaningful market stress.
Fig. 31 Our technical model remains bullish on the S&P500
S&P500 Index; model’s bearish signal; technical support and resistance levels
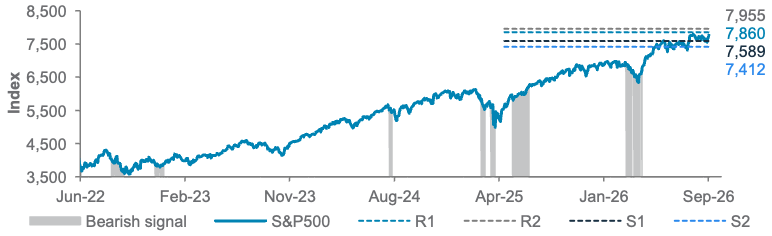
Fig. 32 Long- and short-term quantitative models remain bullish on risk assets
Long-term models below have a typical time horizon of 3-6 months, while short-term models have a 1-3-month horizon
Performance review
Foundation: Asset allocation summary
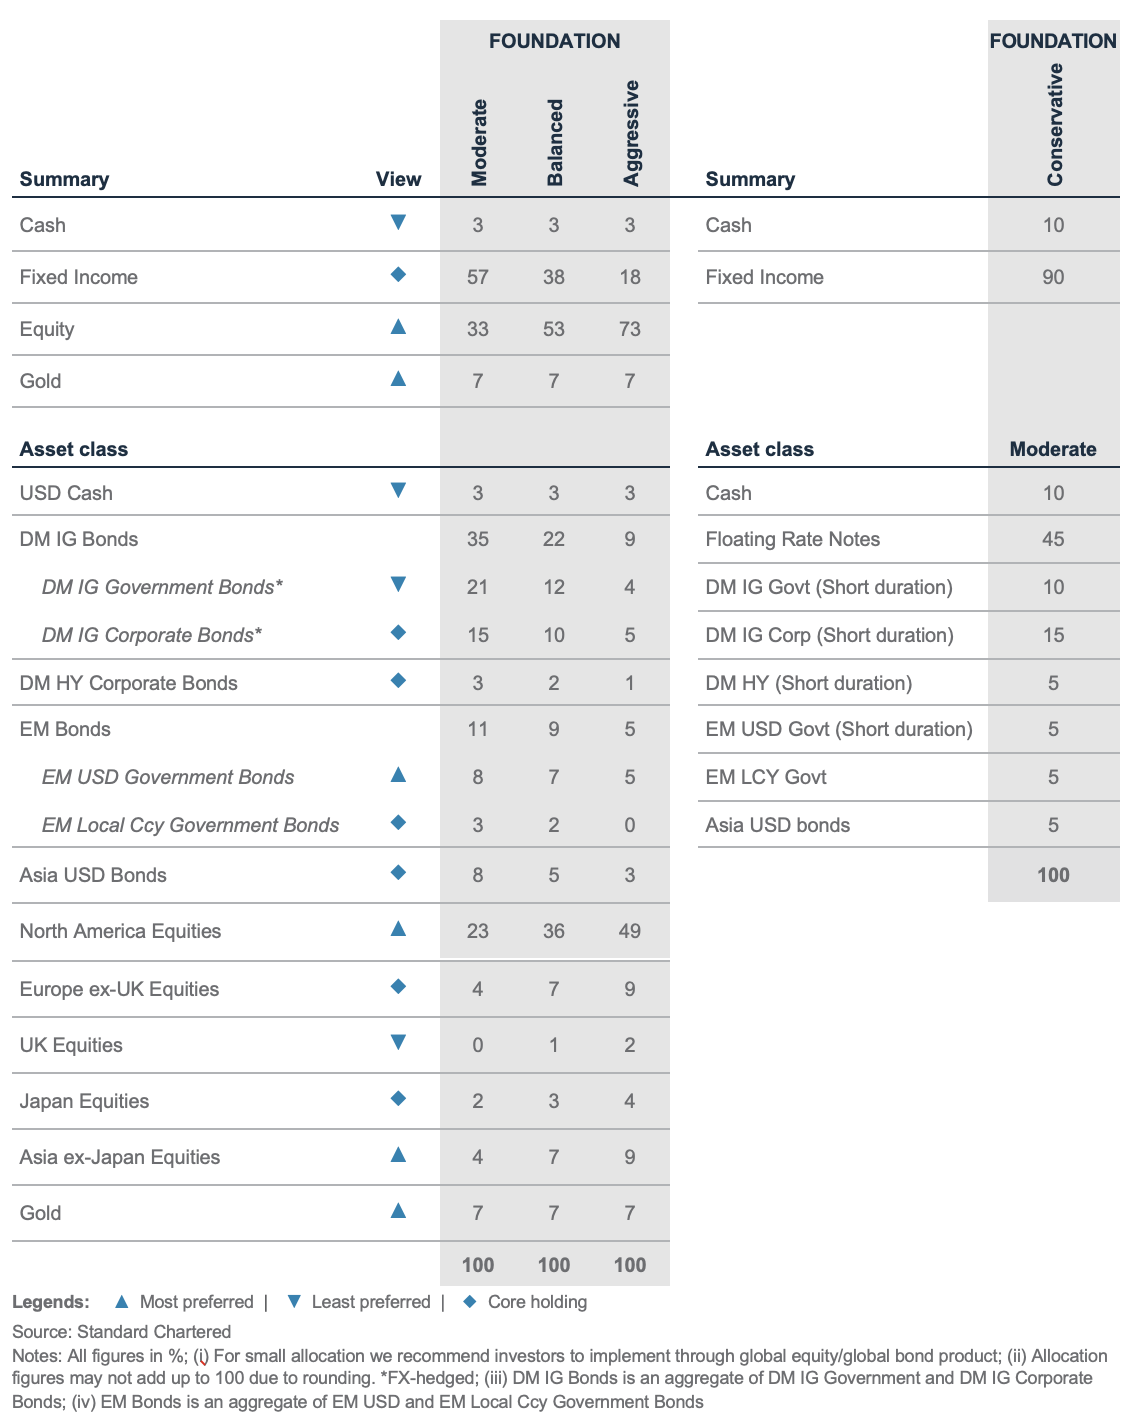
Note: All figures in %; (i) For small allocation we recommend investors to implement through global equity/global bond product; (ii) Allocation figures may not add up to 100 due to rounding. *FX-hedged; (iii) DM IG Bonds is an aggregate of DM IG Government and DM IG Corporate Bonds; (iv) EM Bonds is an aggregate of EM USD and EM Local Ccy Government Bonds
Foundation+: Asset allocation summary
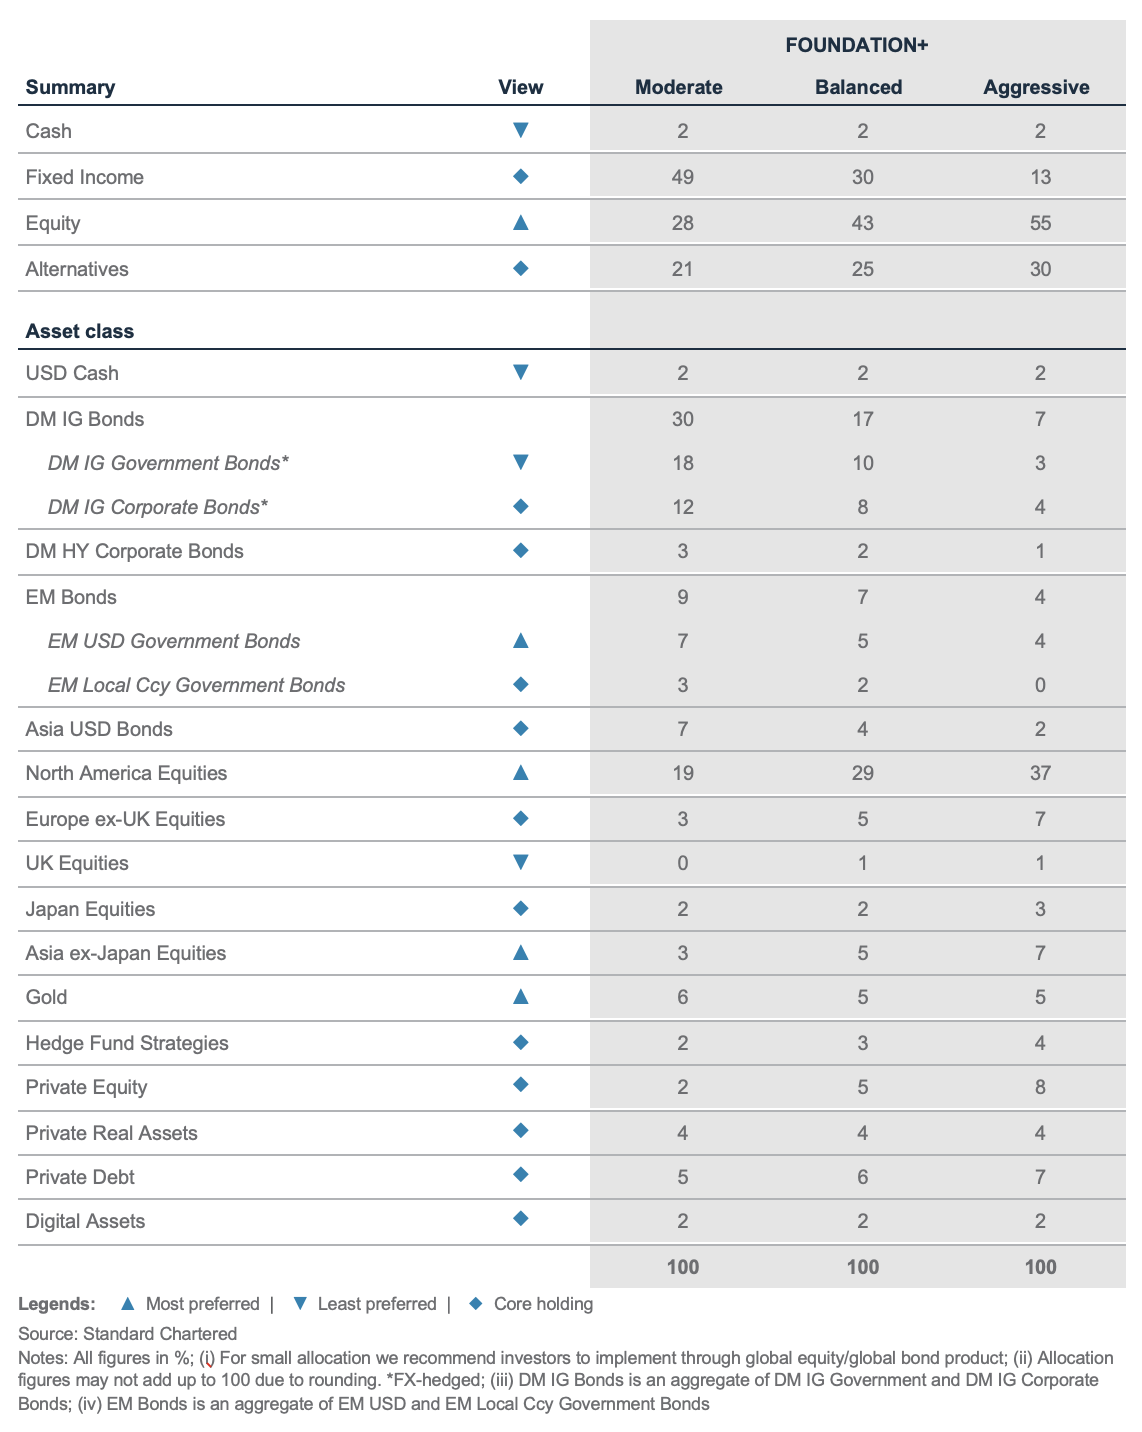
Note: All figures in %; (i) For small allocation we recommend investors to implement through global equity/global bond product; (ii) Allocation figures may not add up to 100 due to rounding. *FX-hedged; (iii) DM IG Bonds is an aggregate of DM IG Government and DM IG Corporate Bonds; (iv) EM Bonds is an aggregate of EM USD and EM Local Ccy Government Bonds
Market performance summary
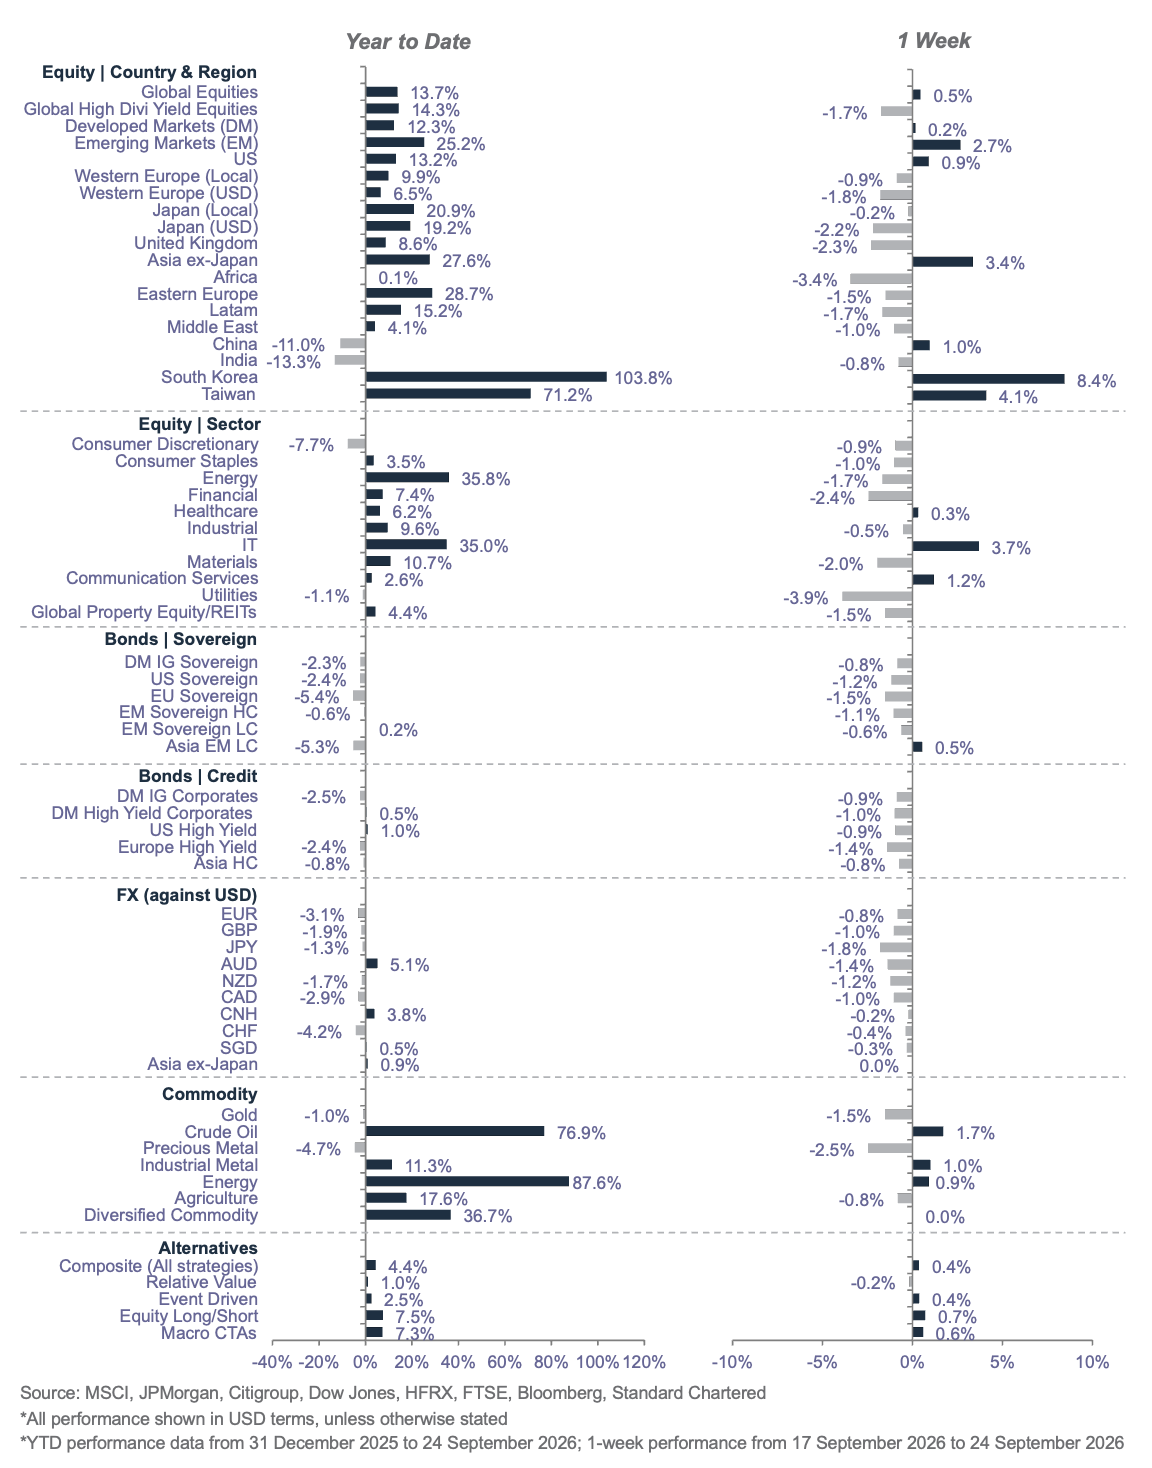
*All performance shown in USD terms, unless otherwise stated
*YTD performance data from 31 December 2025 to 27 August 2026; 1-week performance from 20 August 2026 to 27 August 2026
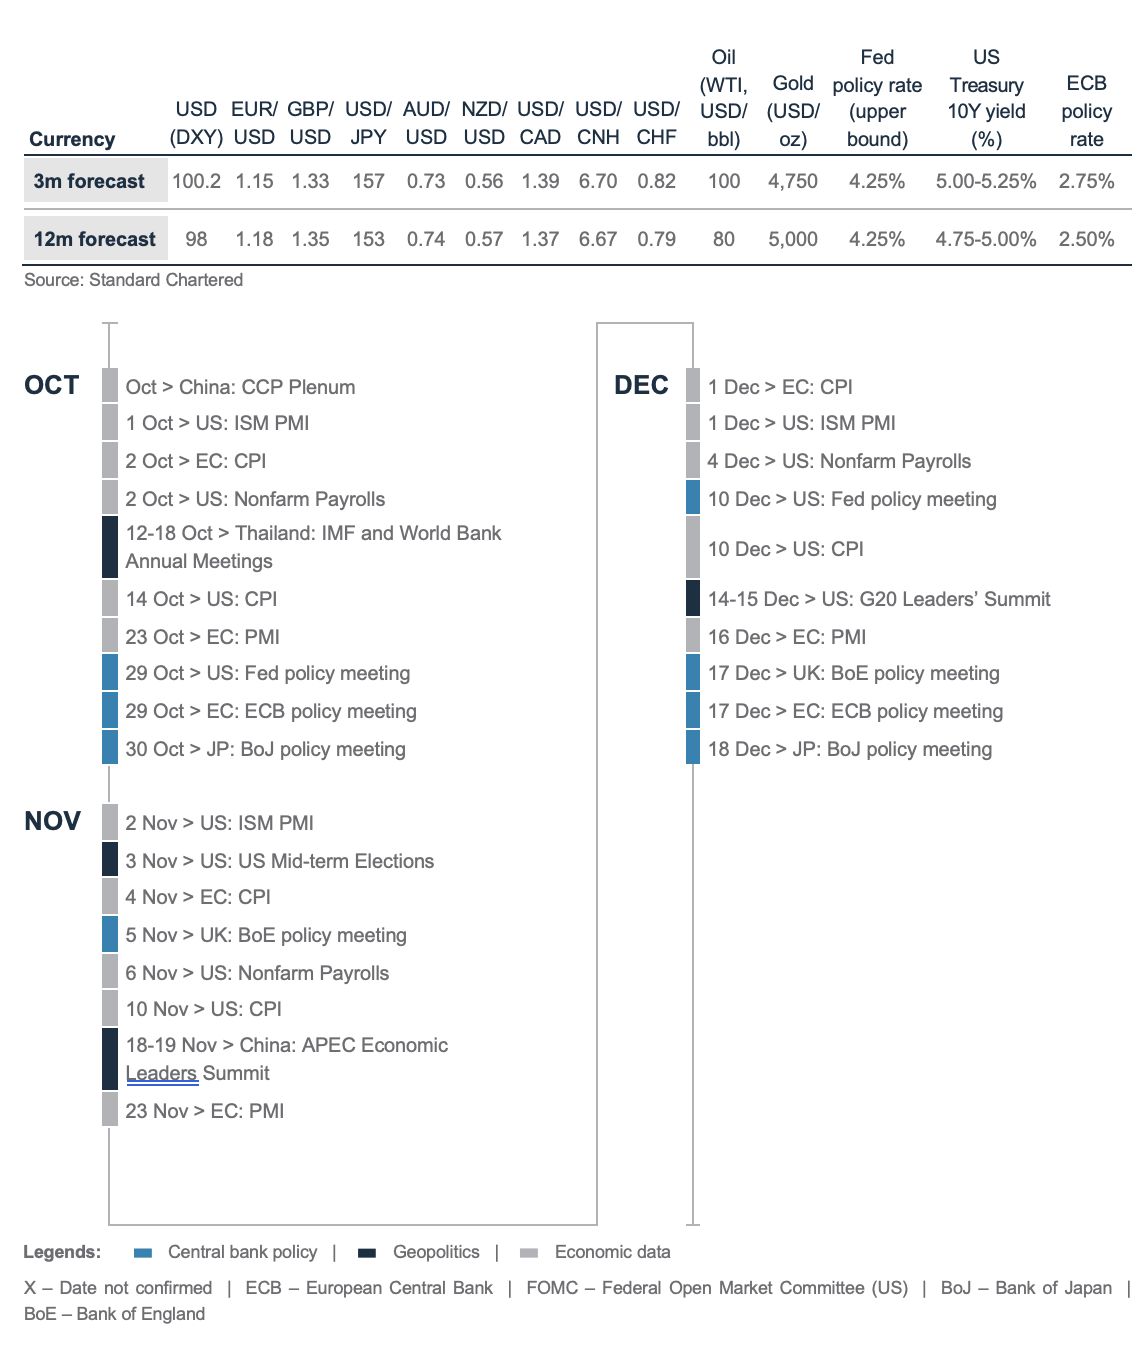
Our key forecasts and calendar events
SC Wealth Select

Explanatory notes
- The figures on page 5 show allocations for a moderately aggressive risk profile only – different risk profiles may produce significantly different asset allocation results. Page 5 is only an example, provided for general information only and they do not constitute investment advice, an offer, recommendation or solicitation. They do not take into account the specific investment objectives, needs or risk tolerances of a particular person or class of persons and they have not been prepared for any particular person or class of persons.
- Contingent Convertibles are complex financial instruments and are not a suitable or appropriate investment for all investors. This document is not an offer to sell or an invitation to buy any securities or any beneficial interests therein. Contingent convertible securities are not intended to be sold and should not be sold to retail clients in the European Economic Area (EEA) (each as defined in the Policy Statement on the Restrictions on the Retail Distribution of Regulatory Capital Instruments (Feedback to CP14/23 and Final Rules) (“Policy Statement”), read together with the Product Intervention (Contingent Convertible Instruments and Mutual Society Shares) Instrument 2015 (“Instrument”, and together with the Policy Statement, the “Permanent Marketing Restrictions”), which were published by the United Kingdom’s Financial Conduct Authority in June 2015), other than in circumstances that do not give rise to a contravention of the Permanent Marketing Restrictions.
Disclosure
This document is confidential and may also be privileged. If you are not the intended recipient, please destroy all copies and notify the sender immediately. This document is being distributed for general information only and is subject to the relevant disclaimers available at our Standard Chartered website under Regulatory disclosures. It is not and does not constitute research material, independent research, an offer, recommendation or solicitation to enter into any transaction or adopt any hedging, trading or investment strategy, in relation to any securities or other financial instruments. This document is for general evaluation only. It does not take into account the specific investment objectives, financial situation or particular needs of any particular person or class of persons and it has not been prepared for any particular person or class of persons. You should not rely on any contents of this document in making any investment decisions. Before making any investment, you should carefully read the relevant offering documents and seek independent legal, tax and regulatory advice. In particular, we recommend you to seek advice regarding the suitability of the investment product, taking into account your specific investment objectives, financial situation or particular needs, before you make a commitment to purchase the investment product. Opinions, projections and estimates are solely those of SC at the date of this document and subject to change without notice. Past performance is not indicative of future results and no representation or warranty is made regarding future performance. The value of investments, and the income from them, can go down as well as up, and you may not recover the amount of your original investment. You are not certain to make a profit and may lose money. Any forecast contained herein as to likely future movements in rates or prices or likely future events or occurrences constitutes an opinion only and is not indicative of actual future movements in rates or prices or actual future events or occurrences (as the case may be). This document must not be forwarded or otherwise made available to any other person without the express written consent of the Standard Chartered Group (as defined below). Standard Chartered Bank is incorporated in England with limited liability by Royal Charter 1853 Reference Number ZC18. The Principal Office of the Company is situated in England at 1 Basinghall Avenue, London, EC2V 5DD. Standard Chartered Bank is authorised by the Prudential Regulation Authority and regulated by the Financial Conduct Authority and Prudential Regulation Authority. Standard Chartered PLC, the ultimate parent company of Standard Chartered Bank, together with its subsidiaries and affiliates (including each branch or representative office), form the Standard Chartered Group. Standard Chartered Global Private Bank is the private banking division of Standard Chartered. Private banking activities may be carried out internationally by different legal entities and affiliates within the Standard Chartered Group (each an “SC Group Entity”) according to local regulatory requirements. Not all products and services are provided by all branches, subsidiaries and affiliates within the Standard Chartered Group. Some of the SC Group Entities only act as representatives of Standard Chartered Global Private Bank and may not be able to offer products and services or offer advice to clients.
Copyright © 2026, Accounting Research & Analytics, LLC d/b/a CFRA (and its affiliates, as applicable). Reproduction of content provided by CFRA in any form is prohibited except with the prior written permission of CFRA. CFRA content is not investment advice and a reference to or observation concerning a security or investment provided in the CFRA SERVICES is not a recommendation to buy, sell or hold such investment or security or make any other investment decisions. The CFRA content contains opinions of CFRA based upon publicly-available information that CFRA believes to be reliable and the opinions are subject to change without notice. This analysis has not been submitted to, nor received approval from, the United States Securities and Exchange Commission or any other regulatory body. While CFRA exercised due care in compiling this analysis, CFRA, ITS THIRD-PARTY SUPPLIERS, AND ALL RELATED ENTITIES SPECIFICALLY DISCLAIM ALL WARRANTIES, EXPRESS OR IMPLIED, INCLUDING, BUT NOT LIMITED TO, ANY WARRANTIES OF MERCHANTABILITY OR FITNESS FOR A PARTICULAR PURPOSE OR USE, to the full extent permitted by law, regarding the accuracy, completeness, or usefulness of this information and assumes no liability with respect to the consequences of relying on this information for investment or other purposes. No content provided by CFRA (including ratings, credit-related analyses and data, valuations, model, software or other application or output therefrom) or any part thereof may be modified, reverse engineered, reproduced or distributed in any form by any means, or stored in a database or retrieval system, without the prior written permission of CFRA, and such content shall not be used for any unlawful or unauthorized purposes. CFRA and any third-party providers, as well as their directors, officers, shareholders, employees or agents do not guarantee the accuracy, completeness, timeliness or availability of such content. In no event shall CFRA, its affiliates, or their third-party suppliers be liable for any direct, indirect, special, or consequential damages, costs, expenses, legal fees, or losses (including lost income or lost profit and opportunity costs) in connection with a subscriber’s, subscriber’s customer’s, or other’s use of CFRA’s content.
Market Abuse Regulation (MAR) Disclaimer
Banking activities may be carried out internationally by different branches, subsidiaries and affiliates within the Standard Chartered Group according to local regulatory requirements. Opinions may contain outright “buy”, “sell”, “hold” or other opinions. The time horizon of this opinion is dependent on prevailing market conditions and there is no planned frequency for updates to the opinion. This opinion is not independent of Standard Chartered Group’s trading strategies or positions. Standard Chartered Group and/or its affiliates or its respective officers, directors, employee benefit programmes or employees, including persons involved in the preparation or issuance of this document may at any time, to the extent permitted by applicable law and/or regulation, be long or short any securities or financial instruments referred to in this document or have material interest in any such securities or related investments. Therefore, it is possible, and you should assume, that Standard Chartered Group has a material interest in one or more of the financial instruments mentioned herein. Please refer to our Standard Chartered website under Regulatory disclosures for more detailed disclosures, including past opinions/ recommendations in the last 12 months and conflict of interests, as well as disclaimers. A covering strategist may have a financial interest in the debt or equity securities of this company/issuer. All covering strategist are licensed to provide investment recommendations under Monetary Authority of Singapore or Hong Kong Monetary Authority. This document must not be forwarded or otherwise made available to any other person without the express written consent of Standard Chartered Group.
Sustainable Investments
Any ESG data used or referred to has been provided by Morningstar, Sustainalytics, MSCI or Bloomberg. Refer to 1) Morningstar website under Sustainable Investing, 2) Sustainalytics website under ESG Risk Ratings, 3) MCSI website under ESG Business Involvement Screening Research and 4) Bloomberg green, social & sustainability bonds guide for more information. The ESG data is as at the date of publication based on data provided, is for informational purpose only and is not warranted to be complete, timely, accurate or suitable for a particular purpose, and it may be subject to change. The ESG data providers may not provide data coverage of all companies or securities in our Sustainable Investment Universe or Fund Select funds. As a result, a small subset of companies or securities will not be in scope for exclusionary screening. Sustainable Investments (SI): This refers to funds that have been classified as ‘ESG Intentional Investments – Overall’ by Morningstar. SI funds have explicitly stated in their prospectus and regulatory filings that they either incorporate ESG factors into the investment process or have a thematic focus on the environment, gender diversity, low carbon, renewable energy, water or community development. For equity, it refers to shares/stocks issued by companies with Sustainalytics ESG Risk Rating of Low/Negligible. For bonds, it refers to debt instruments issued by issuers with Sustainalytics ESG Risk Rating of Low/Negligible, and/or those being certified green, social, sustainable bonds by Bloomberg. For structured products, it refers to products that are issued by any issuer who has a Sustainable Finance framework that aligns with Standard Chartered’s Green and Sustainable Product Framework, with underlying assets that are part of the Sustainable Investment universe or separately approved by Standard Chartered’s Sustainable Finance Governance Committee. Sustainalytics ESG risk ratings shown are factual and are not an indicator that the product is classified or marketed as “green”, “sustainable” or similar under any particular classification system or framework.
Shariah (“Shariah Compliant or Shariah Compliance”)
For any reason to enter only into transactions which comply or are consistent with the principles of the Shariah, the client certifies that he/she/it has made his /her/its own investigation into and satisfied itself as to the Shariah compliance of the Islamic security and all necessary action to confirm that the Islamic security is Shariah compliant has been taken (including the obtaining of a fatwa, where required) and the Client will not claim any dispute on the grounds of any lack of Shariah compliance of these investments. The Client has not relied on Standard Chartered Group or any written declaration, fatwa, opinion or other documents prepared by, on behalf or at the request of Standard Chartered Group for the purposes of a determination or confirmation that these instruments are Shariah compliant.
Country/Market Specific Disclosures
Bahrain: This document is being distributed in Bahrain by Standard Chartered Bank, Bahrain Branch, having its address at P.O. 29, Manama, Kingdom of Bahrain, is a branch of Standard Chartered Bank and is licensed by the Central Bank of Bahrain as a conventional retail bank. Botswana: This document is being distributed in Botswana by, and is attributable to, Standard Chartered Bank Botswana Limited which is a financial institution licensed under the Section 6 of the Banking Act CAP 46.04 and is listed in the Botswana Stock Exchange. Brunei Darussalam: This document is being distributed in Brunei Darussalam by, and is attributable to, Standard Chartered Bank (Brunei Branch) | Registration Number RFC/61 and Standard Chartered Securities (B) Sdn Bhd | Registration Number RC20001003. Standard Chartered Bank is incorporated in England with limited liability by Royal Charter 1853 Reference Number ZC18. Standard Chartered Securities (B) Sdn Bhd is a limited liability company registered with the Registry of Companies with Registration Number RC20001003 and licensed by Brunei Darussalam Central Bank as a Capital Markets Service License Holder with License Number BDCB/R/CMU/S3-CL and it is authorised to conduct Islamic investment business through an Islamic window. China Mainland: This document is being distributed in China by, and is attributable to, Standard Chartered Bank (China) Limited which is mainly regulated by National Financial Regulatory Administration (NFRA), State Administration of Foreign Exchange (SAFE), and People’s Bank of China (PBOC). Hong Kong: In Hong Kong, this document, except for any portion advising on or facilitating any decision on futures contracts trading, is distributed by Standard Chartered Bank (Hong Kong) Limited (“SCBHK”), a subsidiary of Standard Chartered PLC. SCBHK has its registered address at 32/F, Standard Chartered Bank Building, 4-4A Des Voeux Road Central, Hong Kong and is regulated by the Hong Kong Monetary Authority and registered with the Securities and Futures Commission (“SFC”) to carry on Type 1 (dealing in securities), Type 4 (advising on securities), Type 6 (advising on corporate finance) and Type 9 (asset management) regulated activity under the Securities and Futures Ordinance (Cap. 571) (“SFO”) (CE No. AJI614). The contents of this document have not been reviewed by any regulatory authority in Hong Kong and you are advised to exercise caution in relation to any offer set out herein. If you are in doubt about any of the contents of this document, you should obtain independent professional advice. Any product named herein may not be offered or sold in Hong Kong by means of any document at any time other than to “professional investors” as defined in the SFO and any rules made under that ordinance. In addition, this document may not be issued or possessed for the purposes of issue, whether in Hong Kong or elsewhere, and any interests may not be disposed of, to any person unless such person is outside Hong Kong or is a “professional investor” as defined in the SFO and any rules made under that ordinance, or as otherwise may be permitted by that ordinance. In Hong Kong, Standard Chartered Global Private Bank is the private banking division of SCBHK, a subsidiary of Standard Chartered PLC. Ghana: Standard Chartered Bank Ghana Limited accepts no liability and will not be liable for any loss or damage arising directly or indirectly (including special, incidental or consequential loss or damage) from your use of these documents. Past performance is not indicative of future results and no representation or warranty is made regarding future performance. You should seek advice from a financial adviser on the suitability of an investment for you, taking into account these factors before making a commitment to invest in an investment. To unsubscribe from receiving further updates, please send an email to feedback.ghana@sc.com. Please do not reply to this email. Call our Priority Banking on 0302610750 for any questions or service queries. You are advised not to send any confidential and/or important information to Standard Chartered via e-mail, as Standard Chartered makes no representations or warranties as to the security or accuracy of any information transmitted via e-mail. Standard Chartered shall not be responsible for any loss or damage suffered by you arising from your decision to use e-mail to communicate with the Bank. India: This document is being distributed in India by Standard Chartered in its capacity as a distributor of mutual funds and referrer of any other third party financial products. Standard Chartered does not offer any ‘Investment Advice’ as defined in the Securities and Exchange Board of India (Investment Advisers) Regulations, 2013 or otherwise. Services/products related securities business offered by Standard Charted are not intended for any person, who is a resident of any jurisdiction, the laws of which imposes prohibition on soliciting the securities business in that jurisdiction without going through the registration requirements and/or prohibit the use of any information contained in this document. Indonesia: This document is being distributed in Indonesia by Standard Chartered Bank, Indonesia branch, which is a financial institution licensed and supervised by Otoritas Jasa Keuangan (Financial Service Authority) and Bank Indonesia. Jersey: In Jersey, Standard Chartered Global Private Bank is the Registered Business Name of the Jersey Branch of Standard Chartered Bank. The Jersey Branch of Standard Chartered Bank is regulated by the Jersey Financial Services Commission. Copies of the latest audited accounts of Standard Chartered Bank are available from its principal place of business in Jersey: PO Box 80, 15 Castle Street, St Helier, Jersey JE4 8PT. Standard Chartered Bank is incorporated in England with limited liability by Royal Charter in 1853 Reference Number ZC 18. The Principal Office of the Company is situated in England at 1 Basinghall Avenue, London, EC2V 5DD. Standard Chartered Bank is authorised by the Prudential Regulation Authority and regulated by the Financial Conduct Authority and Prudential Regulation Authority. The Jersey Branch of Standard Chartered Bank is also an authorised financial services provider under license number 44946 issued by the Financial Sector Conduct Authority of the Republic of South Africa. Jersey is not part of the United Kingdom and all business transacted with Standard Chartered Bank, Jersey Branch and other SC Group Entity outside of the United Kingdom, are not subject to some or any of the investor protection and compensation schemes available under United Kingdom law. Kenya: This document is being distributed in Kenya by and is attributable to Standard Chartered Bank Kenya Limited. Investment Products and Services are distributed by Standard Chartered Investment Services Limited, a wholly owned subsidiary of Standard Chartered Bank Kenya Limited that is licensed by the Capital Markets Authority in Kenya, as a Fund Manager. Standard Chartered Bank Kenya Limited is regulated by the Central Bank of Kenya. Malaysia: This document is being distributed in Malaysia by Standard Chartered Bank Malaysia Berhad (“SCBMB”). Recipients in Malaysia should contact SCBMB in relation to any matters arising from, or in connection with, this document. This document has not been reviewed by the Securities Commission Malaysia. The product lodgement, registration, submission or approval by the Securities Commission of Malaysia does not amount to nor indicate recommendation or endorsement of the product, service or promotional activity. Investment products are not deposits and are not obligations of, not guaranteed by, and not protected by SCBMB or any of the affiliates or subsidiaries, or by Perbadanan Insurans Deposit Malaysia, any government or insurance agency. Investment products are subject to investment risks, including the possible loss of the principal amount invested. SCBMB expressly disclaim any liability and responsibility for any loss arising directly or indirectly (including special, incidental or consequential loss or damage) arising from the financial losses of the Investment Products due to market condition. Nigeria: This document is being distributed in Nigeria by Standard Chartered Bank Nigeria Limited (SCB Nigeria), a bank duly licensed and regulated by the Central Bank of Nigeria. SCB Nigeria accepts no liability for any loss or damage arising directly or indirectly (including special, incidental or consequential loss or damage) from your use of these documents. You should seek advice from a financial adviser on the suitability of an investment for you, taking into account these factors before making a commitment to invest in an investment. To unsubscribe from receiving further updates, please send an email to clientcare.ng@sc.com requesting to be removed from our mailing list. Please do not reply to this email. Call our Priority Banking on 02 012772514 for any questions or service queries. SCB Nigeria shall not be responsible for any loss or damage arising from your decision to send confidential and/or important information to Standard Chartered via e-mail. SCB Nigeria makes no representations or warranties as to the security or accuracy of any information transmitted via e-mail. Pakistan: This document is being distributed in Pakistan by, and attributable to Standard Chartered Bank (Pakistan) Limited having its registered office at PO Box 5556, I.I Chundrigar Road Karachi, which is a banking company registered with State Bank of Pakistan under Banking Companies Ordinance 1962 and is also having licensed issued by Securities & Exchange Commission of Pakistan for Security Advisors. Standard Chartered Bank (Pakistan) Limited acts as a distributor of mutual funds and referrer of other third-party financial products. Singapore: This document is being distributed in Singapore by, and is attributable to, Standard Chartered Bank (Singapore) Limited (Registration No. 201224747C/ GST Group Registration No. MR-8500053-0, “SCBSL”). Recipients in Singapore should contact SCBSL in relation to any matters arising from, or in connection with, this document. SCBSL is an indirect wholly owned subsidiary of Standard Chartered Bank and is licensed to conduct banking business in Singapore under the Singapore Banking Act, 1970. Standard Chartered Global Private Bank is the private banking division of SCBSL. IN RELATION TO ANY SECURITY OR SECURITIES-BASED DERIVATIVES CONTRACT REFERRED TO IN THIS DOCUMENT, THIS DOCUMENT, TOGETHER WITH THE ISSUER DOCUMENTATION, SHALL BE DEEMED AN INFORMATION MEMORANDUM (AS DEFINED IN SECTION 275 OF THE SECURITIES AND FUTURES ACT, 2001 (“SFA”)). THIS DOCUMENT IS INTENDED FOR DISTRIBUTION TO ACCREDITED INVESTORS, AS DEFINED IN SECTION 4A(1)(a) OF THE SFA, OR ON THE BASIS THAT THE SECURITY OR SECURITIES-BASED DERIVATIVES CONTRACT MAY ONLY BE ACQUIRED AT A CONSIDERATION OF NOT LESS THAN S$200,000 (OR ITS EQUIVALENT IN A FOREIGN CURRENCY) FOR EACH TRANSACTION. Further, in relation to any security or securities-based derivatives contract, neither this document nor the Issuer Documentation has been registered as a prospectus with the Monetary Authority of Singapore under the SFA. Accordingly, this document and any other document or material in connection with the offer or sale, or invitation for subscription or purchase, of the product may not be circulated or distributed, nor may the product be offered or sold, or be made the subject of an invitation for subscription or purchase, whether directly or indirectly, to persons other than a relevant person pursuant to section 275(1) of the SFA, or any person pursuant to section 275(1A) of the SFA, and in accordance with the conditions specified in section 275 of the SFA, or pursuant to, and in accordance with the conditions of, any other applicable provision of the SFA. In relation to any collective investment schemes referred to in this document, this document is for general information purposes only and is not an offering document or prospectus (as defined in the SFA). This document is not, nor is it intended to be (i) an offer or solicitation of an offer to buy or sell any capital markets product; or (ii) an advertisement of an offer or intended offer of any capital markets product. Deposit Insurance Scheme: Singapore dollar deposits of non-bank depositors are insured by the Singapore Deposit Insurance Corporation, for up to S$100,000 in aggregate per depositor per Scheme member by law. Foreign currency deposits, dual currency investments, structured deposits and other investment products are not insured. This advertisement has not been reviewed by the Monetary Authority of Singapore. Taiwan: SC Group Entity or Standard Chartered Bank (Taiwan) Limited (“SCB (Taiwan)”) may be involved in the financial instruments contained herein or other related financial instruments. The author of this document may have discussed the information contained herein with other employees or agents of SC or SCB (Taiwan). The author and the above-mentioned employees of SC or SCB (Taiwan) may have taken related actions in respect of the information involved (including communication with customers of SC or SCB (Taiwan) as to the information contained herein). The opinions contained in this document may change, or differ from the opinions of employees of SC or SCB (Taiwan). SC and SCB (Taiwan) will not provide any notice of any changes to or differences between the above-mentioned opinions. This document may cover companies with which SC or SCB (Taiwan) seeks to do business at times and issuers of financial instruments. Therefore, investors should understand that the information contained herein may serve as specific purposes as a result of conflict of interests of SC or SCB (Taiwan). SC, SCB (Taiwan), the employees (including those who have discussions with the author) or customers of SC or SCB (Taiwan) may have an interest in the products, related financial instruments or related derivative financial products contained herein; invest in those products at various prices and on different market conditions; have different or conflicting interests in those products. The potential impacts include market makers’ related activities, such as dealing, investment, acting as agents, or performing financial or consulting services in relation to any of the products referred to in this document. UAE: DIFC – Standard Chartered Bank is incorporated in England with limited liability by Royal Charter 1853 Reference Number ZC18.The Principal Office of the Company is situated in England at 1 Basinghall Avenue, London, EC2V 5DD. Standard Chartered Bank is authorised by the Prudential Regulation Authority and regulated by the Financial Conduct Authority and Prudential Regulation Authority. Standard Chartered Bank, Dubai International Financial Centre having its offices at Dubai International Financial Centre, Building 1, Gate Precinct, P.O. Box 999, Dubai, UAE is a branch of Standard Chartered Bank and is regulated by the Dubai Financial Services Authority (“DFSA”). This document is intended for use only by Professional Clients and is not directed at Retail Clients as defined by the DFSA Rulebook. In the DIFC we are authorised to provide financial services only to clients who qualify as Professional Clients and Market Counterparties and not to Retail Clients. As a Professional Client you will not be given the higher retail client protection and compensation rights and if you use your right to be classified as a Retail Client we will be unable to provide financial services and products to you as we do not hold the required license to undertake such activities. For Islamic transactions, we are acting under the supervision of our Shariah Supervisory Committee. Relevant information on our Shariah Supervisory Committee is currently available on the Standard Chartered Bank website in the Islamic banking section. For residents of the UAE – Standard Chartered UAE (“SC UAE”) is licensed by the Central Bank of the U.A.E. SC UAE is licensed by Securities and Commodities Authority to practice Promotion Activity. SC UAE does not provide financial analysis or consultation services in or into the UAE within the meaning of UAE Securities and Commodities Authority Decision No. 48/r of 2008 concerning financial consultation and financial analysis. Uganda: Our Investment products and services are distributed by Standard Chartered Bank Uganda Limited, which is licensed by the Capital Markets Authority as an investment adviser. United Kingdom: In the UK, Standard Chartered Bank is authorised by the Prudential Regulation Authority and regulated by the Financial Conduct Authority and Prudential Regulation Authority. This communication has been approved by Standard Chartered Bank for the purposes of Section 21 (2) (b) of the United Kingdom’s Financial Services and Markets Act 2000 (“FSMA”) as amended in 2010 and 2012 only. Standard Chartered Bank (trading as Standard Chartered Global Private Bank) is also an authorised financial services provider (license number 45747) in terms of the South African Financial Advisory and Intermediary Services Act, 2002. The Materials have not been prepared in accordance with UK legal requirements designed to promote the independence of investment research, and that it is not subject to any prohibition on dealing ahead of the dissemination of investment research. Vietnam: This document is being distributed in Vietnam by, and is attributable to, Standard Chartered Bank (Vietnam) Limited which is mainly regulated by State Bank of Vietnam (SBV). Recipients in Vietnam should contact Standard Chartered Bank (Vietnam) Limited for any queries regarding any content of this document. Zambia: This document is distributed by Standard Chartered Bank Zambia Plc, a company incorporated in Zambia and registered as a commercial bank and licensed by the Bank of Zambia under the Banking and Financial Services Act Chapter 387 of the Laws of Zambia.