13 February 2026
Global Market Outlook
Global Market Outlook
Refocusing on growth and earnings
Improving growth and earnings offer room for optimism in early 2026. Our preference for equities and gold, supported by earnings growth and diversification demand, respectively, has delivered positive results thus far.
Add to US and Asia ex-Japan equities. Recent corporate earnings provide fundamental support for US markets, notwithstanding the AI bubble debate. Asian equities are supported by robust fundamentals and a weak USD.
Stay Overweight gold. Looking through recent volatility paints a picture of still-strong central bank demand and a sustained price uptrend. The recent pause is an opportunity for under-allocated investors to add exposure.
AI – still bubbling with opportunities?
Is gold still attractive after the recent sell-off?
Are your quant models still positive on risk assets?
Strategy
Investment strategy and key themes
|
|
||||
|

12m Foundation Overweights:
- Global equities, gold
- US, Asia ex-Japan equities
- Emerging Market (EM) USD, local currency (LCY) bonds
Opportunistic ideas – Equities
- US technology, pharma, utilities, aerospace and defence*
- India large and mid-cap,
China non-financial high-dividend state-owned entities, Hang Seng Technology index - Europe banks
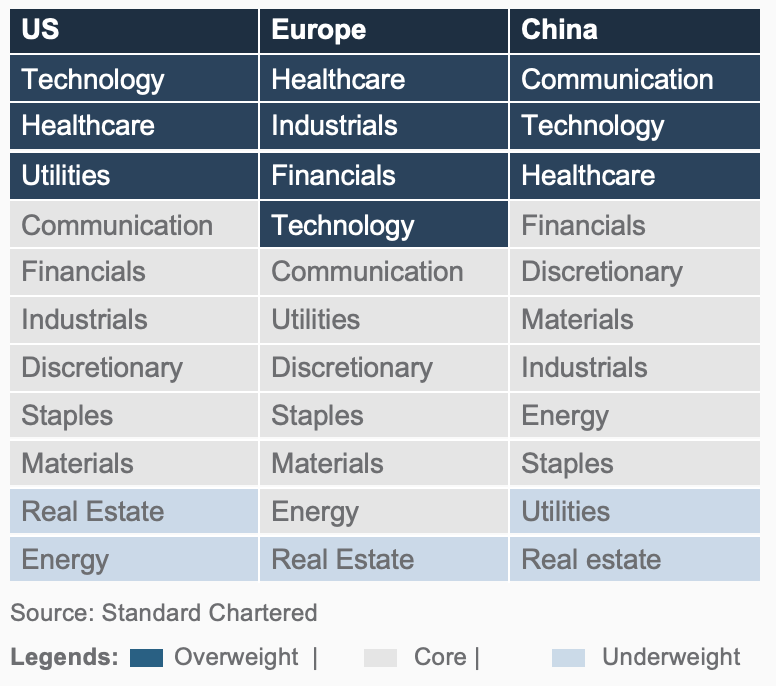
Sector Overweights:
- US: Technology, healthcare, utilities
- Europe: Healthcare, industrials, technology, financials
- China: Technology, healthcare, communication
Opportunistic ideas – Bonds
- US Treasury Inflation-Protected Securities, short-duration HY, AAA-rated CLOs
- Asia Investment Grade (IG)
- European bank CoCos
Refocusing on growth and earnings
- Improving growth and earnings offer room for optimism in early 2026. Our preference for equities and gold, supported by earnings growth and diversification demand, respectively, has delivered positive results thus far.
- Add to US and Asia ex-Japan (AxJ) equities. Recent corporate earnings provide fundamental support to US markets, notwithstanding the AI bubble debate. Asian equities are supported by robust fundamentals and a weak USD.
- Stay Overweight gold. Looking through recent volatility paints a picture of still-strong central bank demand and a sustained price uptrend. The recent pause is an opportunity for under-allocated investors to add exposure.
So far performing as expected, but monitor data
The early months of 2026 have, thus far, been evolving largely along the lines we outlined in our 2026 Outlook – ‘Blowing Bubbles?’. Equities have performed well, with Asian equities picking up the slack in US market returns. Gold has trended strongly higher, while the USD has fallen. US bond yields have largely been rangebound.
From a policy perspective, we expect a rising focus on US macroeconomic data in the coming month(s). On the positive side, economic activity data is showing a smart rebound, most visibly so in the new orders purchasing managers’ index (PMI) surveys. However, the job market remains soft, despite a nascent recovery. We continue to believe this data mix will culminate in more Fed cuts in 2026 and thus ultimately prove to be a tailwind for corporate earnings and risky assets, such as equities.
The uptick in economic activity data is not confined to the US alone, with positive signs visible in most major regions. Japan’s election outcome points to more stimulative fiscal policy settings. In Asia, policy in India continues to be supportive for growth and earnings. In China, we expect continued policy support on any signs of significant economic weakness.
Geopolitics means that higher oil prices – and thus higher inflation expectations – are a short-term risk. While this can risk a delay in the next Fed cut, we do not see a significant risk to our base case scenario assuming no sustained oil supply disruption.
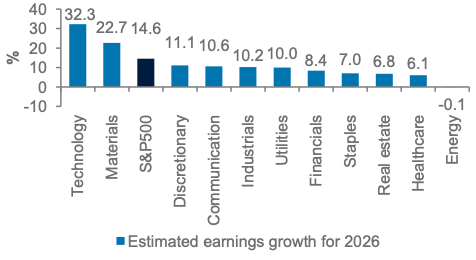
Fig. 1 US tech sector earnings projections continue to outperform those of other sectors
Projected 2026 earnings growth across S&P500 sectors
Solid earnings remain the foundation
A key theme in our 2026 Outlook was whether the US AI rally is supported by fundamentals or is a bubble. We view the technology sector’s strong performance as supported by fundamentals – a view reinforced over the past two months.
The latest earnings season is pointing to robust US earnings growth this year, with consensus expectations for 14.6% growth, led by the technology sector with 32.3% growth. While valuations are no doubt at levels that need to be watched closely, we continue to believe earnings growth is providing the fundamental support for continued equity market gains.
Having said that, we do believe there is value in avoiding excessive concentration in AI and technology against the backdrop of this bubble debate. We remain Overweight US equities, with a preference for the US technology sector. However, we also favour the healthcare and utilities sectors. We opened a bullish opportunistic idea on US aerospace and defence sector on solid air traffic growth and geopolitical risks.
Regionally, we remain Overweight AxJ. AxJ has outperformed the US since we published our 2026 Outlook, with USD weakness helping unlock outperformance as expected. This also makes the region attractive as a diversifier away from excessive concentration in the US technology sector.
Within AxJ, we remain Overweight Indian equities. Indian equities continued to lag AxJ in the early weeks of 2026. However, improving earnings expectations, the completion of a US-India trade deal, cuts in tariffs to levels competitive with Asian peers and growth-supportive policy measures, such as the recent budget, suggest risk/reward remains attractive. We see the market’s underperformance relative to the broader region as offering an opportunity to add Overweight exposure.
We are also Overweight Chinese equities within Asia. The growth and policy backdrop remains a mixed bag, with some soft growth data points offset by continued targeted policy measures. Ultimately, we expect the market to outperform as the growth-policy mix remains supportive and the broader market benefits from an economic and policy outlook that favours cyclical, growth-style equity markets.
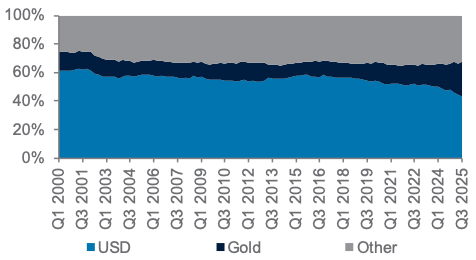
Fig. 2 Gold continues to rise as a share of central bank reserves, mainly at the expense of the USD
Share of global central bank FX reserves
Can gold keep going?
Our positive view on gold is panning out as expected, albeit in an unexpectedly spectacular fashion and with much higher-than-usual volatility.
Our core view that gold prices are supported by continued Emerging Market (EM) central bank demand remains unchanged, with recent data showing continued demand for the metal. Gold also continues to rise as a share of global central bank reserves, though, at the moment, there is little to suggest central banks are aiming for a specific level. We believe this ratio (of gold relative to other reserve currencies) will warrant closer attention later in the year. A pure chart-based view also shows gold remains in an uptrend even after recent volatility.
In this context, recent volatility was likely a result of animal spirits pushing the price well above trend until excessive positioning led to a correction back to trend. Despite these dramatic moves, little has arguably changed from a long-term perspective. We remain Overweight gold.
Bonds are all about the yield
Against the relative excitement in equities and commodities, bonds have been relatively lacklustre in the early months of the year. While there has been considerable debate over the direction of Fed policy under new Fed Chair nominee Warsh, US bond yields have been rangebound, offering attractive opportunities to earn a yield, but little more. More significant moves have been visible in Japanese bond yields as commitment to expansionary fiscal policy pushes long-maturity bond yields higher. However, we see low risk of a spillover to other major bond markets for now. Instead, we believe the divergence supports our view of a weak USD as US policy rates move lower against higher Japanese policy rates and unchanged policy rates elsewhere.
Within bonds, we continue to favour EM bonds, which benefit from slightly better value (EM USD) and a weaker USD (EM local currency). We also expect some pressure on US IG bond prices as hyperscaler bond issuance supply starts to rise.
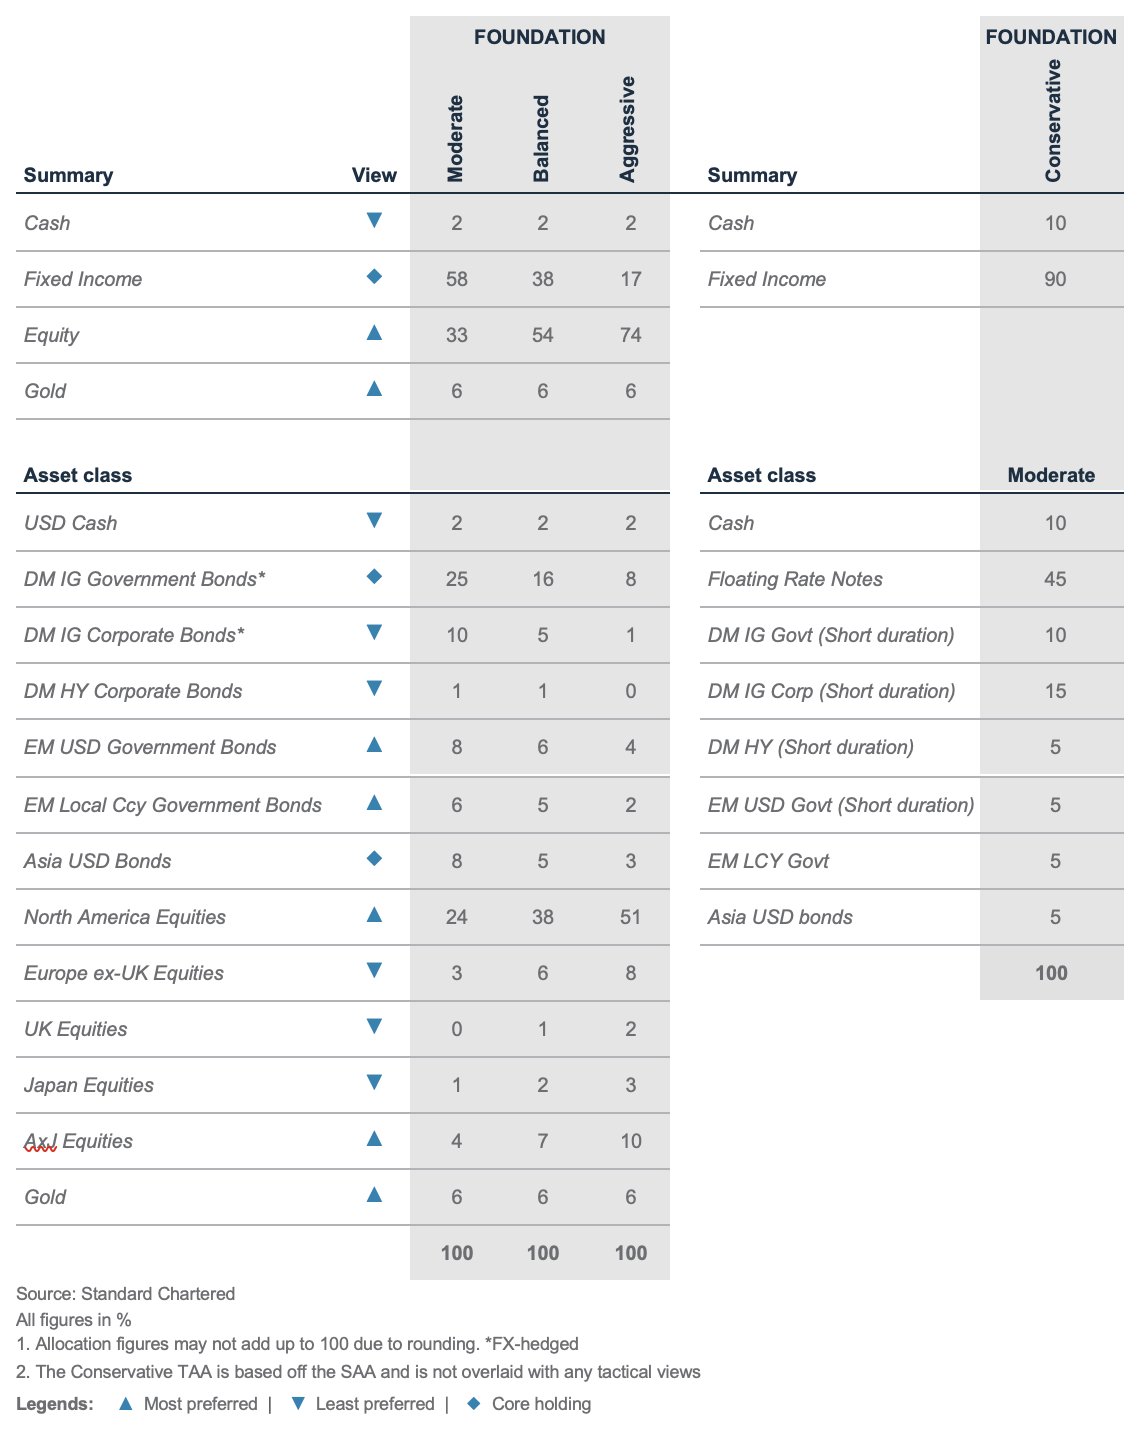
Foundation asset allocation models
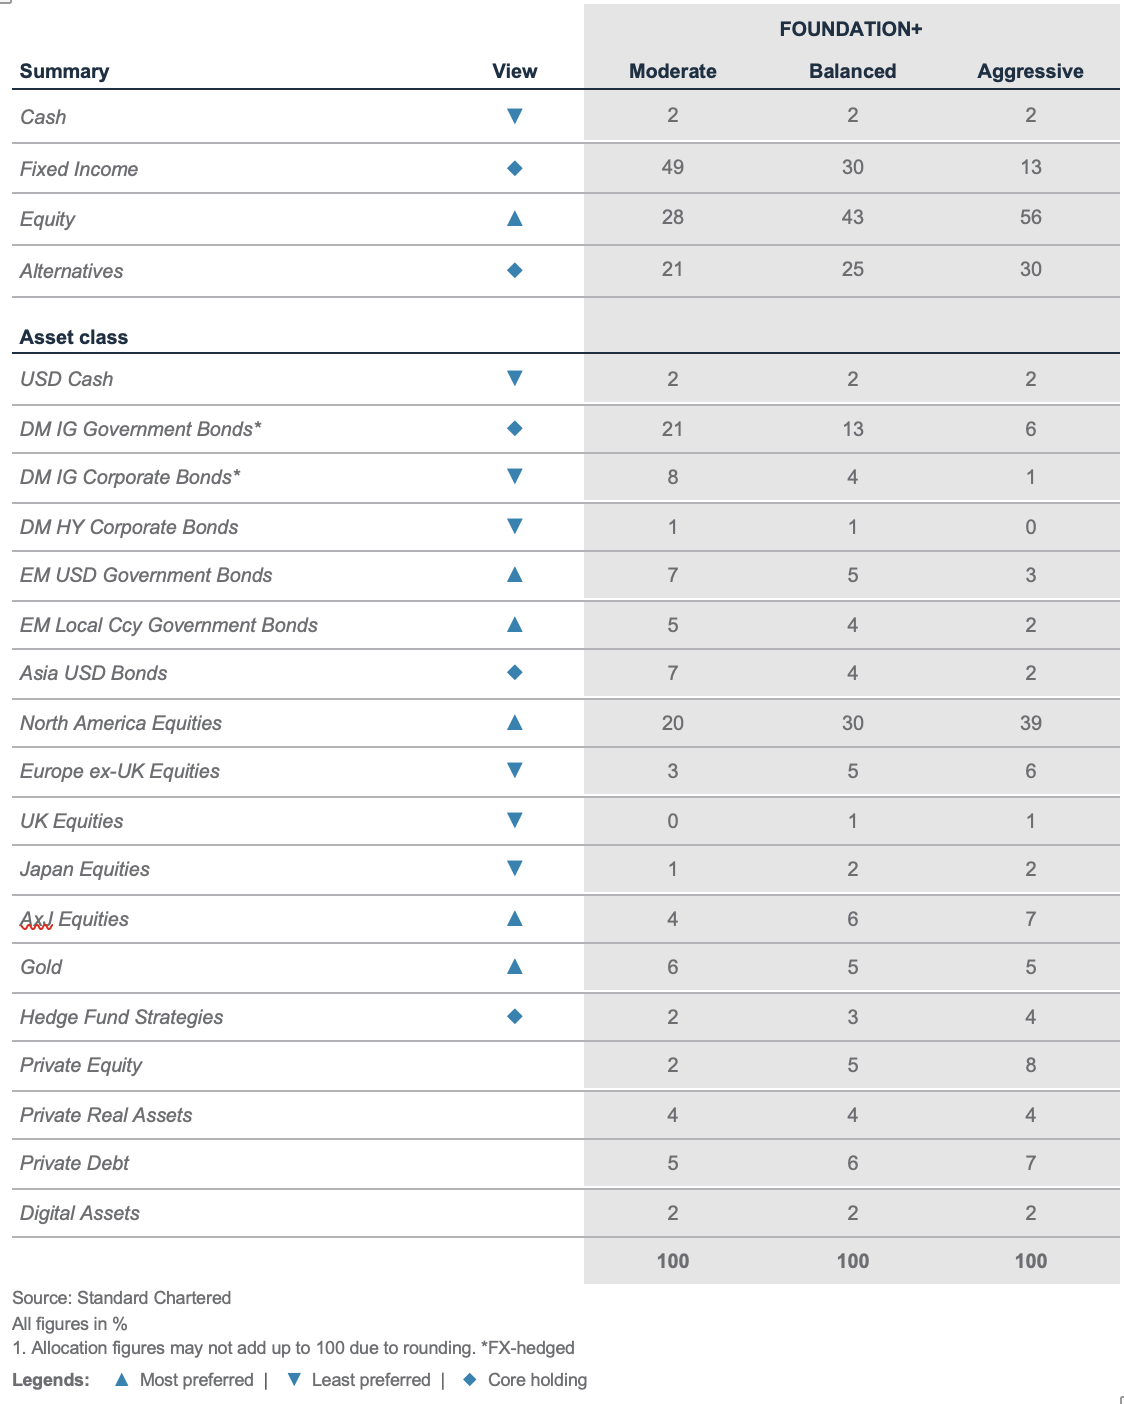
The Foundation and Foundation+ models are allocations that you can use as the starting point for building a diversified investment portfolio. The Foundation model showcases a set of allocations focusing on traditional asset classes that are accessible to most investors, while the Foundation+ model includes allocations to private assets that may be accessible to investors in some jurisdictions, but not others.
Fig. 3 Foundation asset allocation for a balanced risk profile
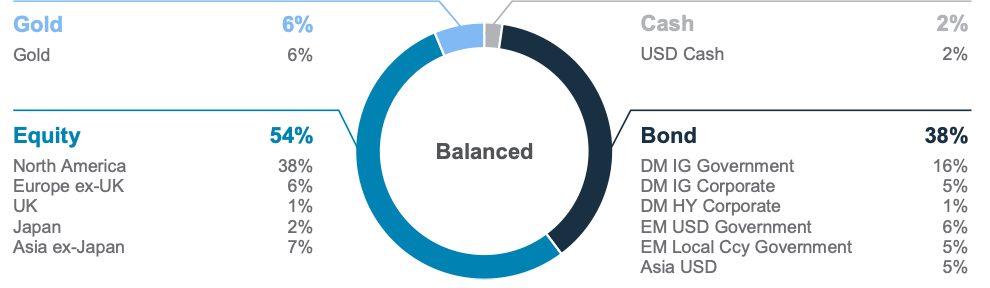
Fig. 4 Foundation+ asset allocation for a balanced risk profile
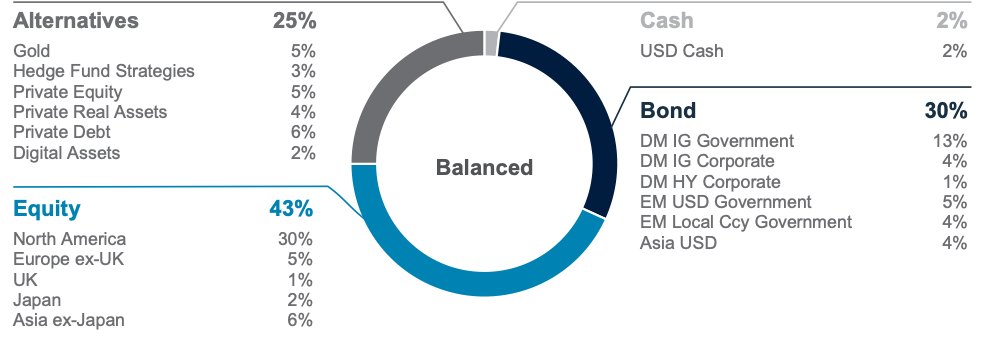
Fig. 5 Multi-asset income allocation for a moderate risk profile
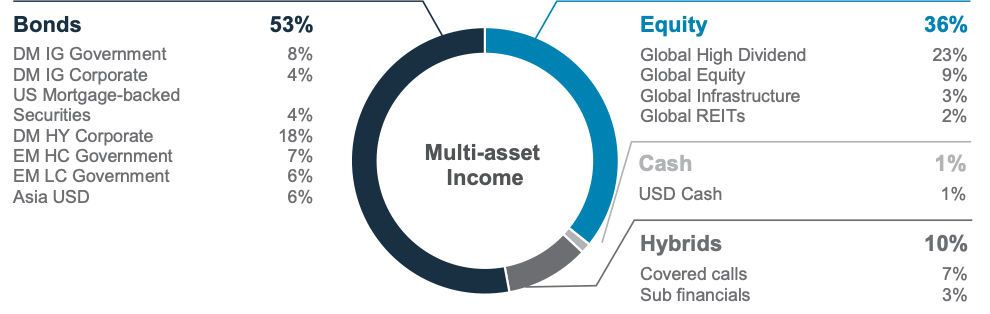
Source: Standard Chartered
Foundation: Our tactical asset allocation views
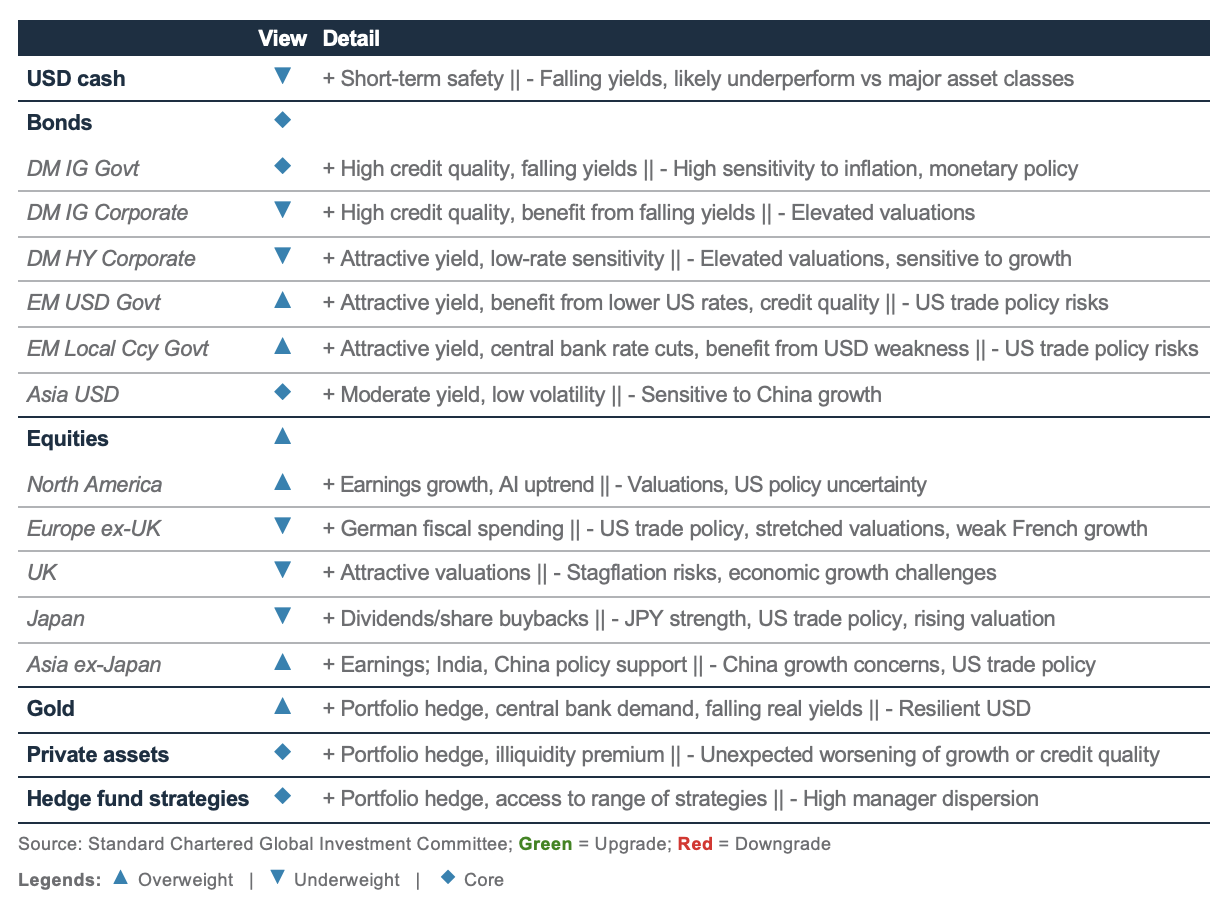
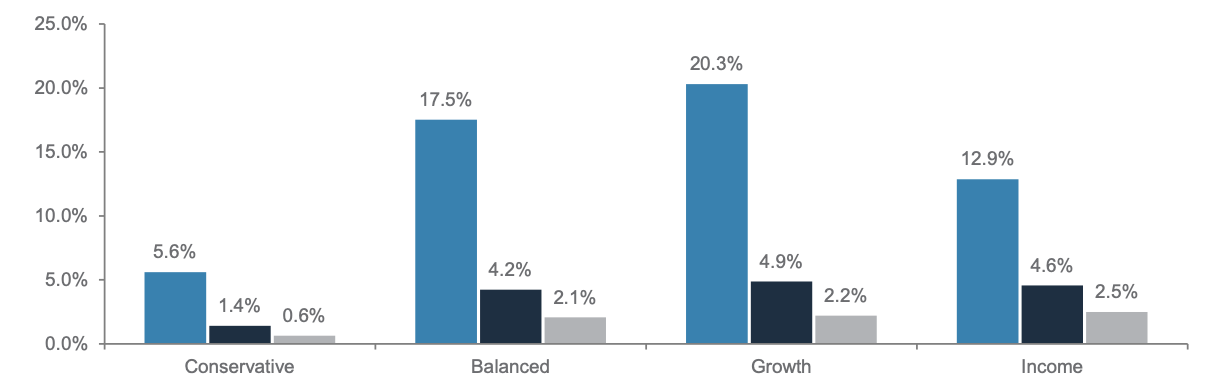
Fig.6 Performance of our Foundation Allocations*
Perspectives on key client questions
|
Is AI in a bubble, or are there still investment opportunities?
We believe AI is not a bubble yet. Its nearly four-year rally holds strong, supported by AI-related companies’ solid earnings growth and fair valuations.
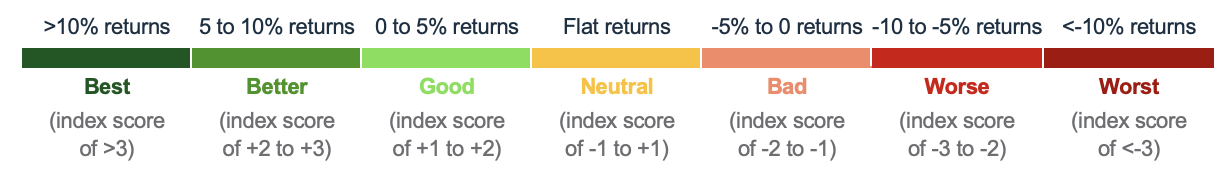
Very few technological developments in recent memory have captivated the post-2010s zeitgeist the way AI has. As the AI talking point reaches a fever pitch, investors continue to debate whether this is a bubble waiting to burst or a structural boom that will remain unstoppable for a long time. To help investors cut through the noise and understand AI’s ever-changing investment implications, we introduce our first-of-its-kind index called the AI bubble meter, which measures sector confidence from Best (>+3) to Worst (< -3).
AI – bubbling with opportunity or fizzling out?
Our AI bubble meter – an innovative metric that weighs five key industry catalysts against five key risks and across seven risk-reward buckets – has risen from 2 in January to 2.5 in February 2026, signalling a shift from a good to a better risk‑reward profile. This points to potential returns of 5-10% for the AI theme over the next three to six months. Notwithstanding the fragile investor sentiment amid heightened geopolitical volatility this year, our meter suggests that the AI bubble fears are overdone.
Despite the relatively short history of the AI cycle, historical back testing indicates that our AI confidence index has solid predictive power for three-month forward returns, with higher readings generally associated with stronger performance across the AI theme. Using the Nasdaq-100 as a proxy, the correlation between our AI confidence index and subsequent market performance has been consistently around or above 0.5, suggesting a meaningful positive relationship.
The data behind the confidence
We see five main catalysts supporting the AI cycle. These, including capital investment and adoption, continue to show strong momentum:

AI capital expenditure (capex) has remained a key pillar of the structural AI theme over the past three years. Despite concerns around aggressive buildouts, we expect 45% y/y growth in 2026 and a solid 26% CAGR in 2025-2030. With ongoing Q4 2025 earnings results likely to reaffirm the strong capex outlook, our capex trend score remains unchanged at 4 for February, consistent with January (on a 1-5 scale).
AI adoption rates, as measured by US Census Bureau data, are likely to continue to trend higher. Latest readings indicate 15-20% adoption in the US – a significant jump from around 3.8% in late 2023. We maintain February’s AI adoption rate score at 3.
Earnings revisions for AI-related companies remain solid, led by strength across the semiconductor industry. Over the past month, we have seen a further pickup in positive revisions. Consequently, we raise our earnings revision score from 3 to 3.5 for February.
- AI-related companies’ margins help assess their quality of growth, as margins capture pricing power, operating leverage and overall efficiency. IT companies’ operating margin profiles show margin trends currently remain steady. Accordingly, we maintain February’s quality-of-growth score at 2.5.
- Big Tech has been instrumental in driving the global AI boom, supported by its first-mover advantage and substantial capex. Strong capex intensity (capex-to-sales) reinforces its sustained investment momentum. Accordingly, we maintain our Big Tech commitment score at 3.5 for February.
From DeepSeek to regulatory headwinds, risks remain manageable
While the outlook for AI remains largely positive, lingering concerns remain. Most investors understand that this is not a risk-free environment, but some of their worries can be assuaged:
- Disruption by low-cost China-based large language models (LLMs), such as DeepSeek, remains one of the biggest risks to the market-dominating US-based LLMs. While China-based LLMs have undoubtedly gained traction, we believe the AI market is large enough to accommodate multiple winners, leaving the disruption risk manageable for now.
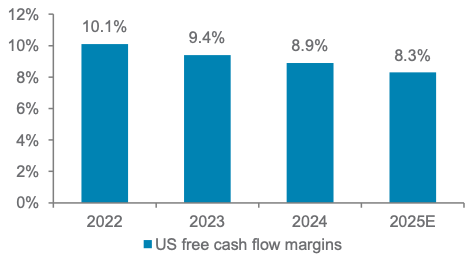
- Valuation and funding risks have moderated. While AI and broader tech stock valuations spiked in late 2025, the AI theme’s muted performance in Q4 2025 helped normalise valuation levels. Similarly, funding risks remain manageable despite elevated capex weighing on free-cash-flow margins across US equities, given credible pathways towards monetisation are emerging. Cash-flow generation among leading platforms also remains robust.
- The global regulatory and macro environment remains benign and manageable, supported by government policies that favour an enabling versus a restrictive stance on AI.
Strategising for the next phase
With the risk-reward profile improving, we favour an offensively defensive approach to AI exposure. On the offensive side, opportunities remain strongest within cyclical semiconductors, including AI accelerators, semiconductor capital equipment and foundries. On the defensive side, we favour US- and China-based internet platforms and early AI adopters in global healthcare. Big Tech also offers solid near‑term potential due to strong H1 seasonality. However, we remain cautious on traditional business models facing disruption risk, particularly across hardware, legacy software and other service-related industries.
While the AI bubble debate rages on, substance continues to allay fears about hype. Nevertheless, investors should not be complacent and should instead follow our AI bubble meter regularly to monitor AI investment opportunities.
Fig. 7 AI bubble meter
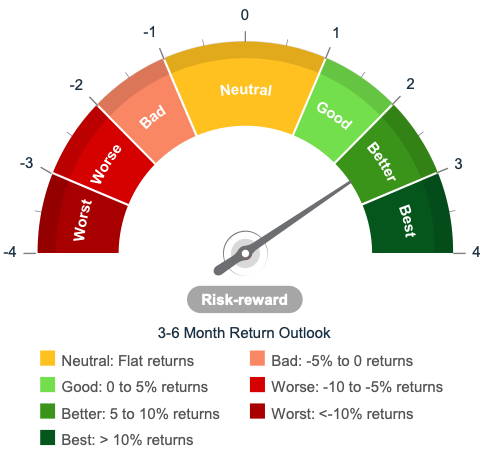
Fig. 8 Strong AI capex trends to continue in 2026 and beyond
Global AI capital expenditure over years
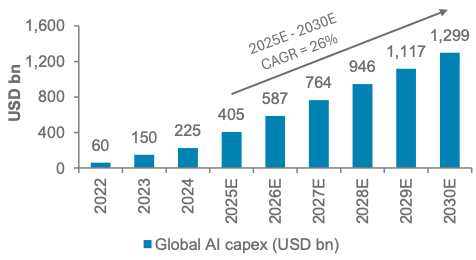
Fig. 9 Declining free cash flow margins show some funding stress in AI but they are manageable
Free cash flow margins for US equities on declining path due to elevated capex spend
Macro overview – at a glance
Our macroeconomic outlook and key questions
|
Our view
Core scenario (soft landing, 60% probability): We continue to expect an economic soft landing amid fiscal stimulus in the US, Germany and Japan, easing trade tensions and last year’s global monetary easing. A solid US jobs report for January has pushed back prospects of a Fed rate cut until proposed Chair Warsh takes over in May. We expect the Fed, under Warsh, to cut rates by 75bps to 3% this year to revive a still-tepid job market as tariff-driven inflation fades. The ECB is likely to hold rates at 2% this year as German stimulus kicks in. China is likely to ease policy in Q2 to sustain hi-tech- and consumption-fuelled growth.
Downside risk (hard landing, 15% probability): US military action in Iran is a near-term risk. A delay in Fed rate cuts due to elevated inflation could further impair the US job market, triggering a mild recession. A stock market downturn hurting investor confidence or a simultaneous USD-bond and USD sell-off on concerns about US debt and/or Fed independence are other risks.
Upside risk (no landing, 25% probability): US tax incentives and deregulation, combined with Fed rate cuts and a potential Supreme Court ruling against tariffs, could revive private sector animal spirits. A Russia-Ukraine peace deal, a US-China grand bargain or EU-wide reforms to establish a Savings and Investments Union each have the potential to boost global growth.
Key chart
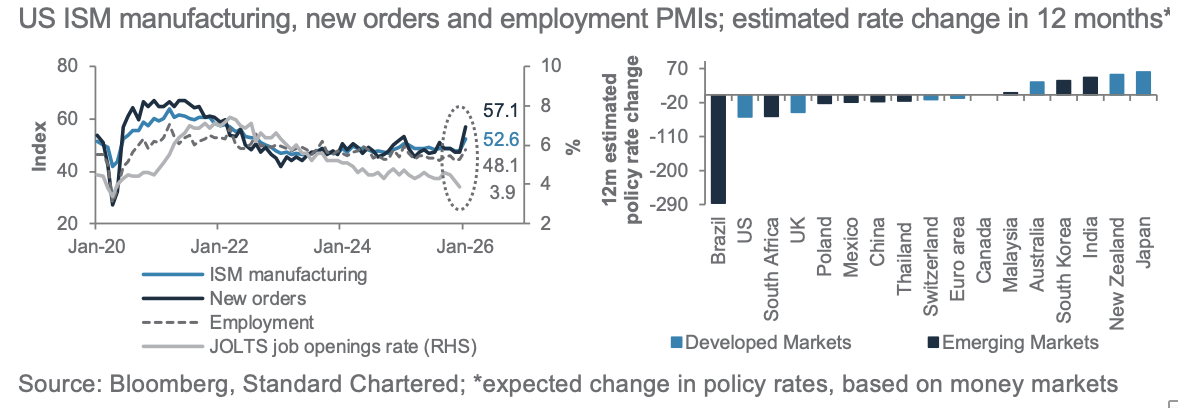
US manufacturing is likely recovering, but job creation remains tepid. The US and the UK are likely to lead rate cuts among Developed Markets (DMs) amid slowing job markets; Brazil to lead rate cuts among EMs.
Fig. 10 US activity likely picking up pace; Brazil, US and UK to lead rate cuts in 2026
Macro factors to watch
US Supreme Court verdict on tariffs; Warsh appointment: Prediction markets give over a 70% chance the Supreme Court will strike down President Trump’s tariffs. While such an outcome would lift business sentiment, bond markets would be focused on whether the court orders the administration to refund tariffs collected so far and whether the administration reimposes some of the tariffs through other regulations.
Meanwhile, we will closely watch Kevin Warsh’s Senate confirmation as the next Fed Chair, starting in May, and his outlook on rates and plans to reduce the Fed’s balance sheet. Previously known for his hawkish policy stance, Warsh has recently shifted to a more dovish, pragmatic approach. This aligns with President Trump’s desire for significantly lower Fed rates. Warsh believes inflation is temporarily elevated due to tariffs and expects AI-driven productivity gains to eventually curb inflation. He views high rates as a barrier to growth and jobs. However, his dovish stance faces risks if productivity gains fall short and inflation rises. Warsh must persuade other Fed policymakers to achieve a majority to back rate cuts.
ECB balanced between German stimulus, falling inflation: Germany’s fiscal stimulus and EU-wide defence spending are due to accelerate in 2026, lifting the Euro area growth outlook. The US trade deal has eased uncertainty. Nevertheless, the EUR’s strength since 2025 has partly offset easier financial conditions caused by the ECB’s 200bps of rate cuts since June 2024, while France’s political and fiscal uncertainty remains a key risk. We expect the ECB to stay on hold this year as core inflation falls towards its 2% target. Further EUR strength would raise the chance of another ECB rate cut.
China’s slowing growth implies sustained stimulus: China’s economic momentum has slowed in recent months, dragged by the property sector, which continues to weigh on consumer sentiment. However, its trade balance reached new highs on the back of resilient exports and slowing imports. CNY’s recent strength is likely to undermine exports in the coming months. Although fiscal stimulus is likely to be front-loaded again in 2026, it is likely to be targeted at boosting domestic services consumption and hi-tech innovation and productivity, in line with the government’s long-term strategy.
Asset Classes
Bonds – at a glance
|
|
||||
|
|
||||
Our view
Foundation: We have a neutral allocation to global bonds in a diversified portfolio and a relative preference for government bonds over corporate bonds (‘rates’ over ‘credit’), given still-attractive nominal yields vs. expensive corporate bond valuations. Government bonds are a more direct play on short-term rate cuts as we continue to expect short-term yields to decline more than long-term yields. We maintain our view of a 3% Fed funds rate by year end-2026 and expect a wider yield gap between long- and short-maturity yields. US fiscal burden, inflation and Fed independence risks will continue to bring volatility in bonds. However, we would use any resulting yield rebound to lock in higher absolute yields to hedge against the risk of ever-lower cash yields. We find US 10-year government bond yields above 4.25% attractive, expecting them to ease to 3.75-4.00% within 6-12 months. Five- to seven-year bond maturities offer the most attractive balance between higher yields and managing risks.
We prefer EM bonds over DM bonds. We are Overweight both EM USD and LCY government bonds, driven by expectations of benign EM inflation, dovish monetary policy settings, fiscal improvements, a weak USD and attractive yields. Within DM bonds, we are Underweight both Investment Grade (IG) and High Yield (HY) corporate bonds.
Opportunistic ideas: We are bullish (i) European bank AT1 bonds (contingent convertibles (CoCos[1]); FX-hedged), (ii) AAA-rated Collateralised Loan Obligations (CLOs), (iii) US TIPS bonds, (iv) short-duration US HY bonds and (v) Asia IG USD bonds.
Key chart
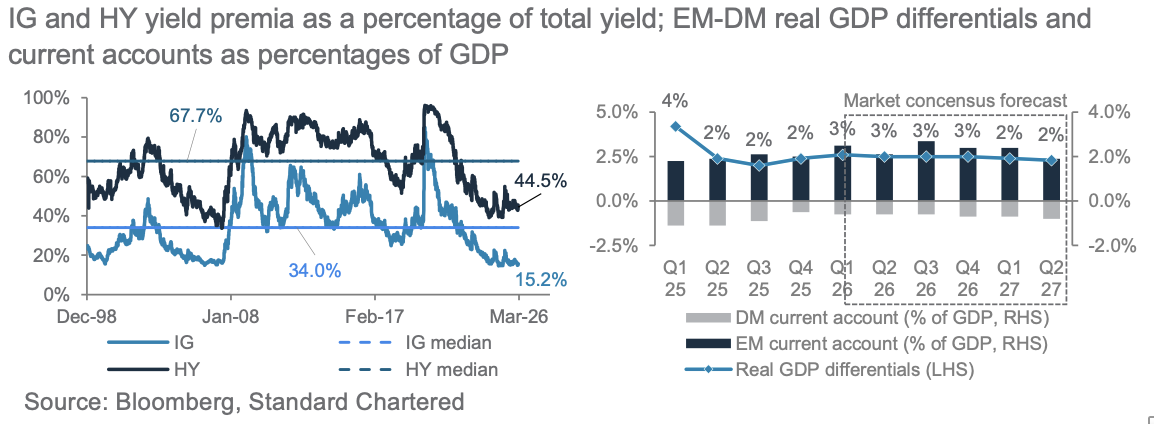
We are Overweight EM USD and LCY government bonds, supported by solid EM fundamentals. We prefer to take corporate risks via equities as corporate yield premia are tight and equities are less constrained to the upside.
Fig. 11 Corporate yield premia are tight; EM fundamentals trend is solid
We are opportunistically bullish European bank AT1 bonds. European bank sector fundamentals remain solid. While European bank CoCos’ valuations are elevated, alongside the broader DM bonds asset class, CoCos is likely to benefit from the current late-cycle environment, with the yield expected to be a major return contributor. Unexpected extensions (non-call) and principal write-downs are risks.
We are opportunistically bullish AAA-rated CLOs and believe the asset class offers more attractive yields than similarly rated bonds, while at the same time mitigating the risk of higher bond yields due to their floating rate nature. The recent surge in US corporates using alternative funding routes, such as leveraged loans, has created unique opportunities in CLOs. We like the high-quality AAA-rated segment due to its superiority in payment priority. Earlier-than-expected call risk
and contingent spillover from credit events in weaker-quality loans or private credit are risks.
We are opportunistically bullish TIPS, as they provide protection against upside risks to longer-term inflation amid fiscal concerns and tariff- and commodity-driven inflation due to geopolitical risks. We are opportunistically bullish short-duration US HY bonds because of their attractive absolute yields and relatively low expected default rates.
We are opportunistically bullish Asia USD IG bonds. Asia IG bond valuations remain elevated, but favourable supply demand dynamics and strong credit fundamentals – solid cashflows, relatively low leverage and a higher share of sovereign or sovereign-linked issuers – are keeping valuations tight. Asia IG bonds should also offer modest price gains as they benefit from lower Fed rates. A downturn in credit quality is a risk.
Equity – at a glance
|
|
||||
|
|
||||
|
Our view
We maintain an Overweight allocation to global equities amid resilient global growth and company earnings. AxJ and the US are our preferred regions. Strong US Q4 2025 earnings, a more accommodative fiscal policy and expectations of further Fed rate cuts are set to reinforce our economic soft-landing expectations for the US.
AxJ is projected to lead in earnings growth over the next year. We prefer China and India equities within the region, anticipating gains from improved governance and ongoing fiscal measures.
Europe ex-UK and UK equities remain Underweights. They are overly defensive and valuations are no longer compelling. European exporters face challenges from a strong EUR, and the UK’s fiscal position remains vulnerable. We are also Underweight Japanese equities, reflecting modest earnings growth forecasts for 2026.
Key chart
US and AxJ equities are leading other regions in 2026
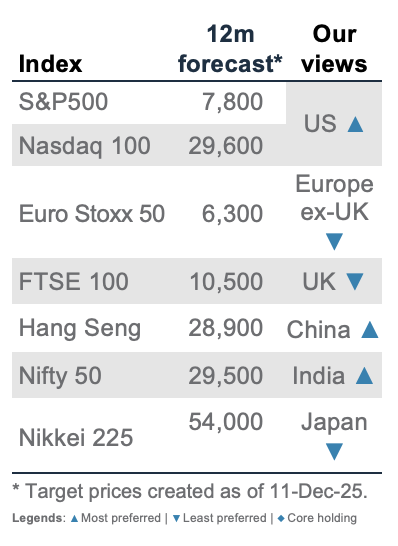
Fig. 12 Fig. 1 The technology-led trend supported by earnings; corporate earnings growth estimates for AxJ and the US are leading other regions in 2026
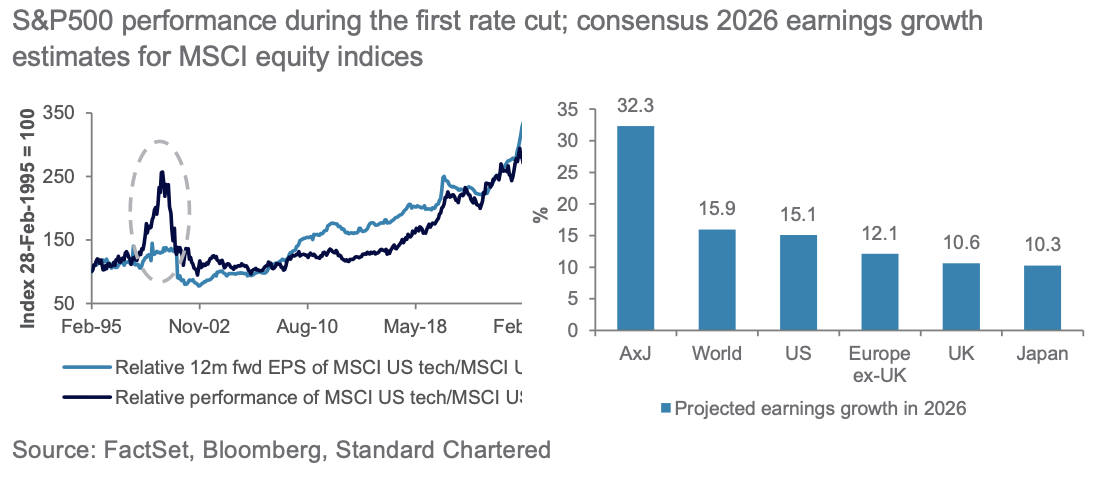
Still bullish
Global equity markets continue to benefit from a strong earnings season and an improving macroeconomic backdrop. We remain Overweight US equities. Robust Q4 2025 earnings and accelerating AI‑related capex are expected to underpin growth sectors, offsetting valuation concerns. Meanwhile, the nomination of Kevin Warsh as the new Fed Chair reinforces expectations of potential monetary easing in H2 2026, which should support the corporate financing and earnings outlook. US earnings revisions continue to outperform global equities. We are Overweight AxJ equities. A softer USD continues to lend support across Asian equities due to the lowering of input costs as well as investment fund inflows. Within the region, we retain our preference for China and India. China’s 15th Five-Year-Plan highlights ongoing innovation and technological self‑reliance, while potential fiscal stimulus at the upcoming Two Sessions – the annual meetings of China’s top legislature – could further bolster growth. We prefer offshore China
equities due to their heavier tilt towards growth‑oriented sectors. In India, our constructive view is supported by potential export momentum following the recent US-India trade deal, as well as resilient domestic GDP growth aided by the Union Budget’s emphasis on sectors such as biopharmaceuticals and semiconductors. The region’s 12‑month forward P/E has eased to 22.4x, aligning with its five‑year historical average.
We remain Underweight Japan equities. The recent lower house election victory by Prime Minister Takaichi’s administration is marginally supportive for markets, as proposed fiscal measures, such as a planned tax cut on food consumption, now face fewer obstacles. A potentially weaker JPY could also bolster earnings projections for export‑oriented stocks. However, we remain cautious due to Japan’s ongoing geopolitical frictions with China and stretched valuations, with the 12‑month forward P/E for Japan now trading over +2 standard deviations above its five‑year average.
Equity opportunistic views
|
Adding US aerospace and defence idea
We initiate an opportunistic idea on the US aerospace and defence industry. We are positive on the commercial aerospace market, with structural growth in international air traffic supporting demand for aircraft equipment and services. In addition, heightened geopolitical tensions are likely to boost defence spending, supporting resilient earnings growth for the industry. Risks include a slowdown in air travel or weakness in defence spending.
We took profit on our global gold miners idea following the strong run-up in gold prices in January, locking in a gain of 45.5% in less than three months (30 October 2025 to 22 January 2026; published in our Weekly Market View on 23 January 2026). We remain bullish on gold prices, but prefer to monitor gold miners for now amidst the volatility. Gold miners are typically much more volatile than gold prices.
Fig. 13 Opportunistic ideas
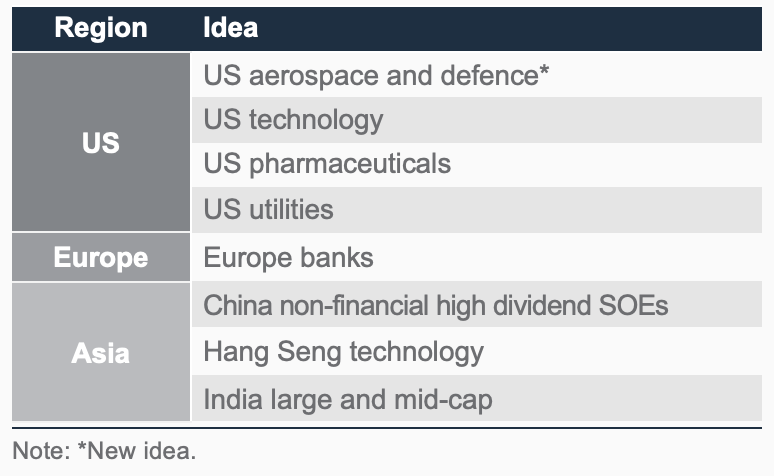
Ongoing ideas
US technology has underperformed the broader market year-to-date due to weakness in the software and services industry, offsetting gains in semiconductors and technology hardware. We recognise that AI could disrupt the software industry, although pockets of value are starting to emerge. We continue to be bullish, especially on semiconductors, validated by the significant capex spending plans outlined by major tech companies during the Q4 2025 earnings season. A slowdown in AI investments is a risk.
US pharmaceuticals: We expect further gains here, driven by earnings growth from innovative medicine, while valuations remain at a reasonable discount to the broader market. Adverse regulatory changes are a risk.US utilities: We continue to be positive on defensive earnings growth here, supplemented by strong electricity demand from AI-related data centre growth. This gives good visibility to
utilities’ earnings growth. A slowdown in data centre buildout is a risk.
Europe banks: We expect the positive performance to continue, driven by steady earnings growth supporting attractive dividends and share buybacks. Higher bond yields are a tailwind to bank earnings, while valuations remain at an attractive discount to the broader market. A sharp slowdown in Europe’s economy is a risk.
China non-financial high-dividend state-owned enterprises (SOEs) offer stable performance. Sustainable dividend income is particularly attractive to Chinese investors facing low deposit rates. Non-financial SOEs are less exposed to the troubled property sector. Adverse regulatory changes are a risk.
Hang Seng Technology Index: We expect the valuation re-rating to continue with growth in AI infrastructure and the rollout of cost-effective AI models. There are also encouraging signs of monetisation of AI investments, which is supportive of the earnings growth outlook. Adverse regulatory changes are a risk.
India large- and mid-cap: We expect the recovery to continue, following the US-India trade deal, coupled with a growth-focused 2026 budget centred around India’s improving manufacturing and services sector competitiveness, which is positive for the country’s long-term growth prospects. We expect the earnings outlook to improve and foreign investors’ inflows to support the market even more. Weaker-than-expected earnings growth is a risk.
Fig. 14 Our sector views by region
Gold, crude oil – at a glance
|
Our view
- We remain Overweight gold and raise our 3- and 12-month price targets to USD 5,250/oz and USD 5,350/oz, respectively.
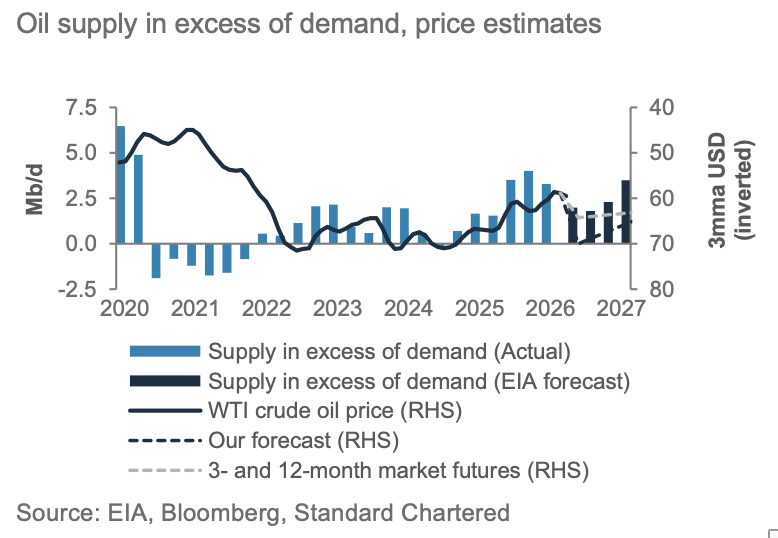
- We raise our three-month forecast on West Texas Intermediate (WTI) oil to USD 70/bbl. Geopolitical risks and a shrinking supply glut could support prices, though the market remains oversupplied, limiting sustained upside.
Key chart
Fig. 15 Gold has decoupled from real yields as structural demand dominates
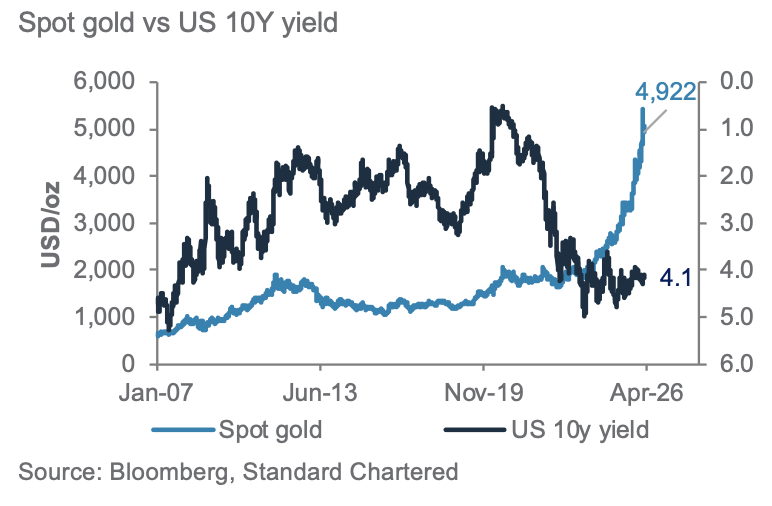
Fig. 17 Previous geopolitical sparks have had a fleeting impact on oil prices
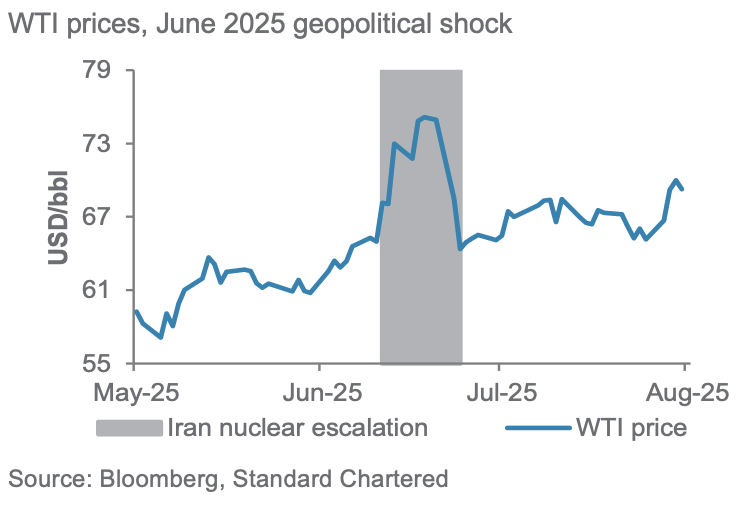
Fig. 16 Rising Gold-S&P500 ratio above long-run average highlights renewed demand for hedges
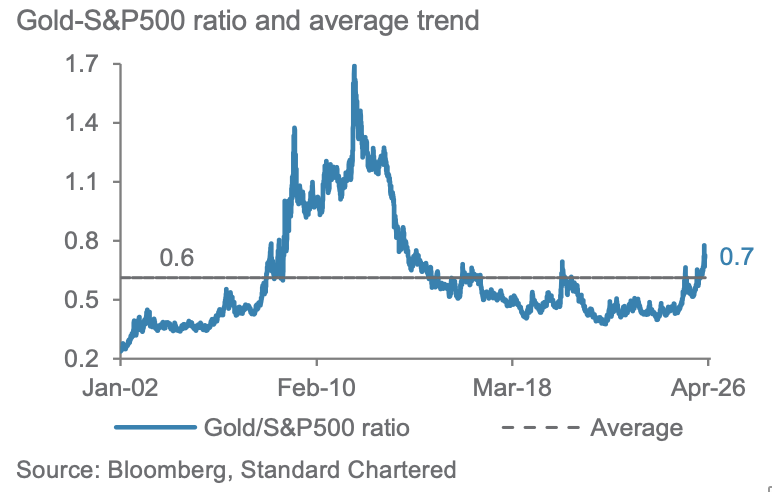
Fig. 18 The oil market remains oversupplied on balance
Gold outlook: Gold spiked to a record USD 5,600 before retracing to around USD 4,500 but has since resumed its upward trend. It remains a key strategic diversifier for both official and private investors, serving as the primary non-USD reserve asset. Geopolitical and safe-haven demand provides strong support, while an easing policy bias and ETF flows offer cyclical backing. Structural concerns over debt sustainability and fiscal dominance could keep US yields lower – a positive for gold. While gold has recently shown resilience against rising yields, a sustained rise in the near term and a stronger USD could cap upside despite favourable fundamentals.
Oil outlook: Oil prices remain anchored by a soft but gradually tightening supply-demand balance as forecast revisions narrow the surplus. OPEC+ is likely to manage output cautiously to defend prices without overtightening or losing share. Elevated geopolitical tensions are helping sustain a risk premium in prices, though past episodes suggest these shocks more often trigger sharp but short-lived spikes rather than a lasting repricing. In the absence of a prolonged disruption to physical supply or broader regional escalation, rallies should fade, leaving supply-demand fundamentals as the dominant drivers of price direction.
FX – at a glance
|
|
||||
Our view
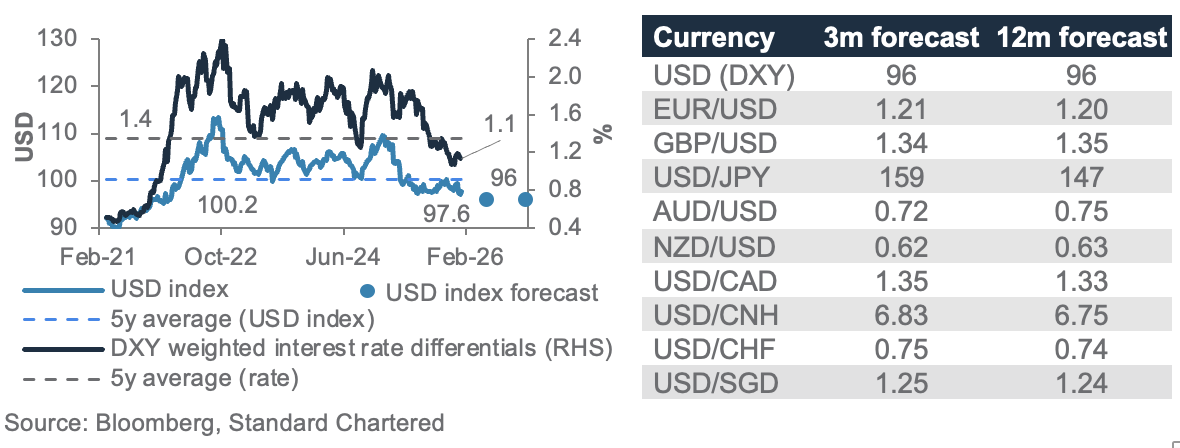
We expect the USD to decline slightly to 96 over the next one to three months, with our 12-month forecast unchanged at this level. Since the beginning of 2026, broad USD selling has become evident. We foresee a gradual downside risk for the USD in the near term as US economic growth slows and the Fed’s policy stance becomes less USD-supportive relative to other global central banks. Furthermore, recent warnings from Chinese regulators regarding banks’ US government bond holdings have introduced a new headwind for USD sentiment. Overall, while the outlook points to further structural underperformance of the USD, the 12-month target suggests that most of the adjustment will take place early on rather than over a prolonged period.
The CHF, rather than the JPY, is expected to remain a standout performer among safe-haven currencies. We see USD/CHF move towards 0.75 over the next three months, followed by a further downside to 0.74 in 12 months.This anticipated strength in the CHF is underpinned by persistent geopolitical tensions and ongoing uncertainties surrounding US international relations. Such conditions are encouraging investors to seek refuge in assets that are viewed as reliable and stable.
Key charts
The USD index (DXY) remains under pressure on the back of narrowing interest rate differentials. It is trading below its five-year average.
Fig. 18 USD index (DXY) has fallen below the five-year average; FX forecast table
Upgrading AUD; USD/CNH to edge lower
We revise our AUD/USD three-month forecast higher to 0.72, reflecting a decisive shift in Australia’s macro policy trajectory. The Reserve Bank of Australia’s (RBA’s) February statement signalled a materially firmer domestic economy, with upside surprises in labour market and inflation prompting markets to price around 60bps of additional tightening over the forecast horizon. The AUD entered 2026 with renewed resilience, trading near 0.67 in early January as investors reassessed Australia’s policy stance and commodity exposure. We expect AUD/USD to benefit from a front-loaded appreciation cycle, supported by CNH gains and strong gold price. NZD/USD is likely to stabilise around 0.62 and USD/CAD to consolidate around 1.35 amid resilient oil prices.
European currencies are expected to show divergent performance in the near term. The ECB appears to have concluded its rate-cut cycle. The EUR should benefit from improved investor confidence and resilient trade data to trade near 1.21. However, the GBP remains vulnerable to downside risks due to ongoing concerns regarding domestic growth.
Subdued UK retail sales and weaker manufacturing output have increased expectations of further Bank of England (BoE) rate cuts in the coming months.
After a landslide election victory, Japanese Prime Minister Takaichi clarified that the proposed tax cut on food consumption will be strictly limited to two years and that the government will not rely on debt issuance to fund the tax cut. This has allayed fiscal concerns for now. The government has not decided whether to use the Foreign Exchange Special Account to fund the proposed tax cut. USD/JPY is likely to remain sensitive to Japan’s fiscal policy agenda, while upside is capped by intervention risk and a soft USD. This should help USD/JPY consolidate around 159 over the next three months.
Asian currencies show resilience. We expect USD/CNH to edge gradually to 6.83, then lower to 6.75 in the next 12 months amid a softer USD. Meanwhile, Singapore’s central bank cited upside risks to growth and inflation, raising the chance of a modest policy tightening at the next meeting in April. USD/SGD is likely to trade lower, around 1.24-1.25.
Additional perspectives
Quant perspective
Stay bullish equities
|
|
||||
Summary
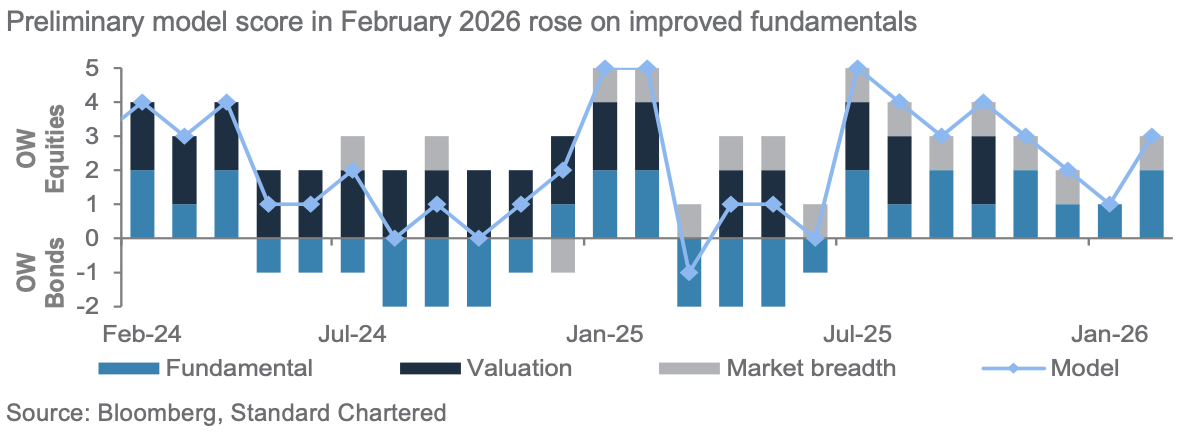
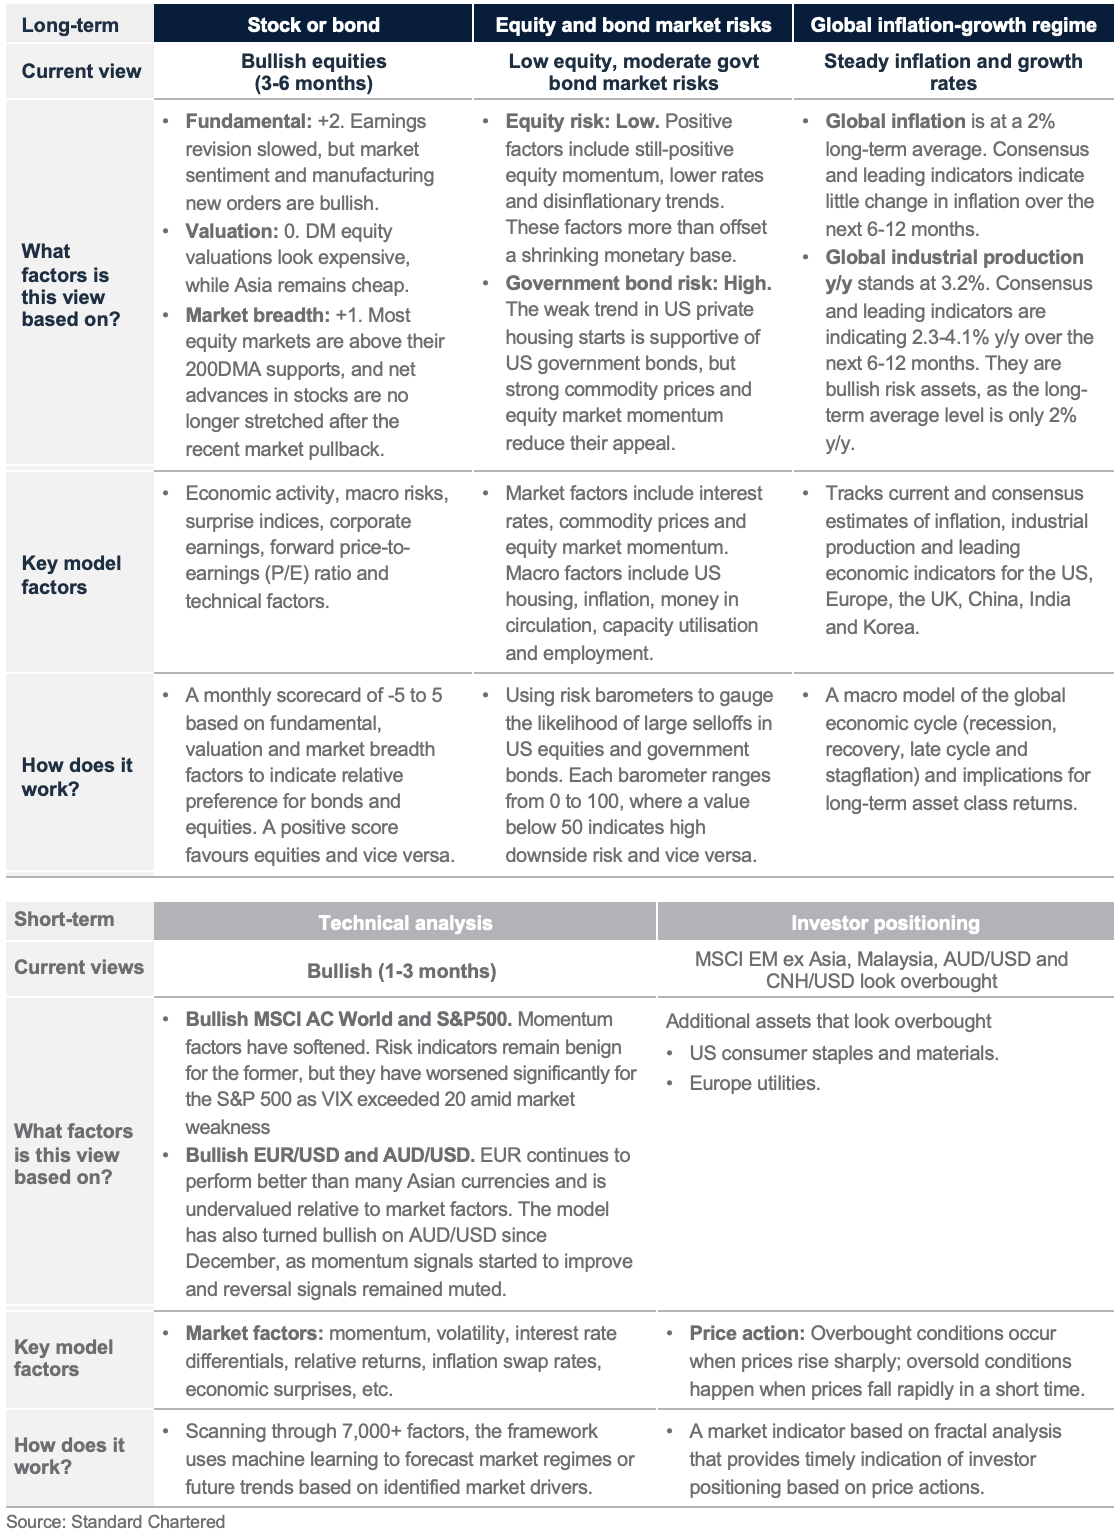
Our stock-bond model (three- to six-month view) was modestly Overweight global equities mid-January, but preliminary signals in February raise the Overweight of equities higher. This is represented by our model score falling to +1 (maximum is +5) mid-January before it rose back to +3 in early February. The initial drop in the equity score was driven by the reversal signal from net advances in stocks significantly exceeding the historical average. In early February, we observed (i) net advances in stocks normalised after the recent market pullback and (ii) a sharp recovery in manufacturing new orders after they contracted for four consecutive months. The model has delivered a 61% return since inception in February 2023, outperforming the 60/40 equity/bond benchmark annually with an excess return of 8.2% over entire the period.
Our short-term equity models (one- to three-month view) are not expecting a bear market yet. The estimated bear market probabilities for the S&P500 and MSCI AC World are 42% and 17%, respectively. Momentum indicators have softened for both indices. Risk indicators remain benign for MSCI AC World, but they have worsened significantly for S&P 500 as VIX exceeded 20 amid recent market weakness. Our short-term currency models are also bullish EUR/USD and AUD/USD. EUR/USD continues to perform relatively better than many Asian currencies, and it remains undervalued relative to market factors. Meanwhile, momentum factors are currently strongly supportive of AUD/USD, and reversal signals are muted. Our short-term models have delivered positive returns YTD for each asset.Our market diversity indicators flag potential overbought conditions in equity markets of EM ex Asia, Malaysia, US consumer staples and materials, Europe utilities and currencies (AUD/USD and CNH/USD). Gold no longer appears overbought after it was flagged by our indicator in January and experienced a 14% peak-to-trough decline.
Key chart
Our stock-bond model is Overweight equities. Preliminary model score in February rose to +3, indicating a more bullish equity signal due to improved fundamental factors.
Fig. 20 Breakdown of our stock-bond rotation model’s scores
Our short-term model is bullish on the S&P500 Index. Medium-term momentum has slowed, but risk indicators, such as options market’s implied volatility and EM currency volatility, remain benign.
Fig. 21 Our technical model remains bullish on S&P500
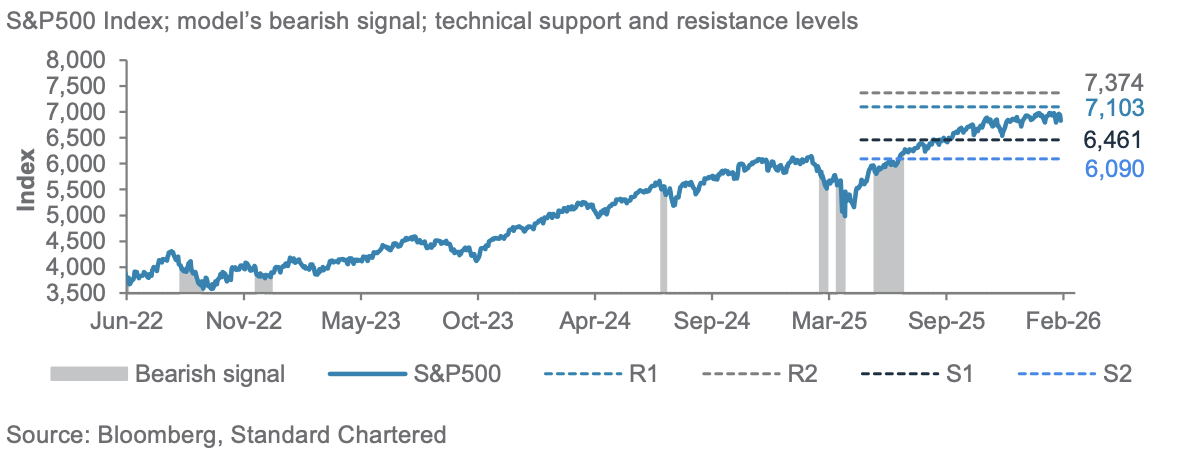
Fig. 22 Long- and short-term quantitative models remain bullish risk assets
Long-term models below have a typical time horizon of 3-6 months, while short-term models have a 1-3-month horizon
Performance review
Foundation: Asset allocation summary
Foundation+: Asset allocation summary
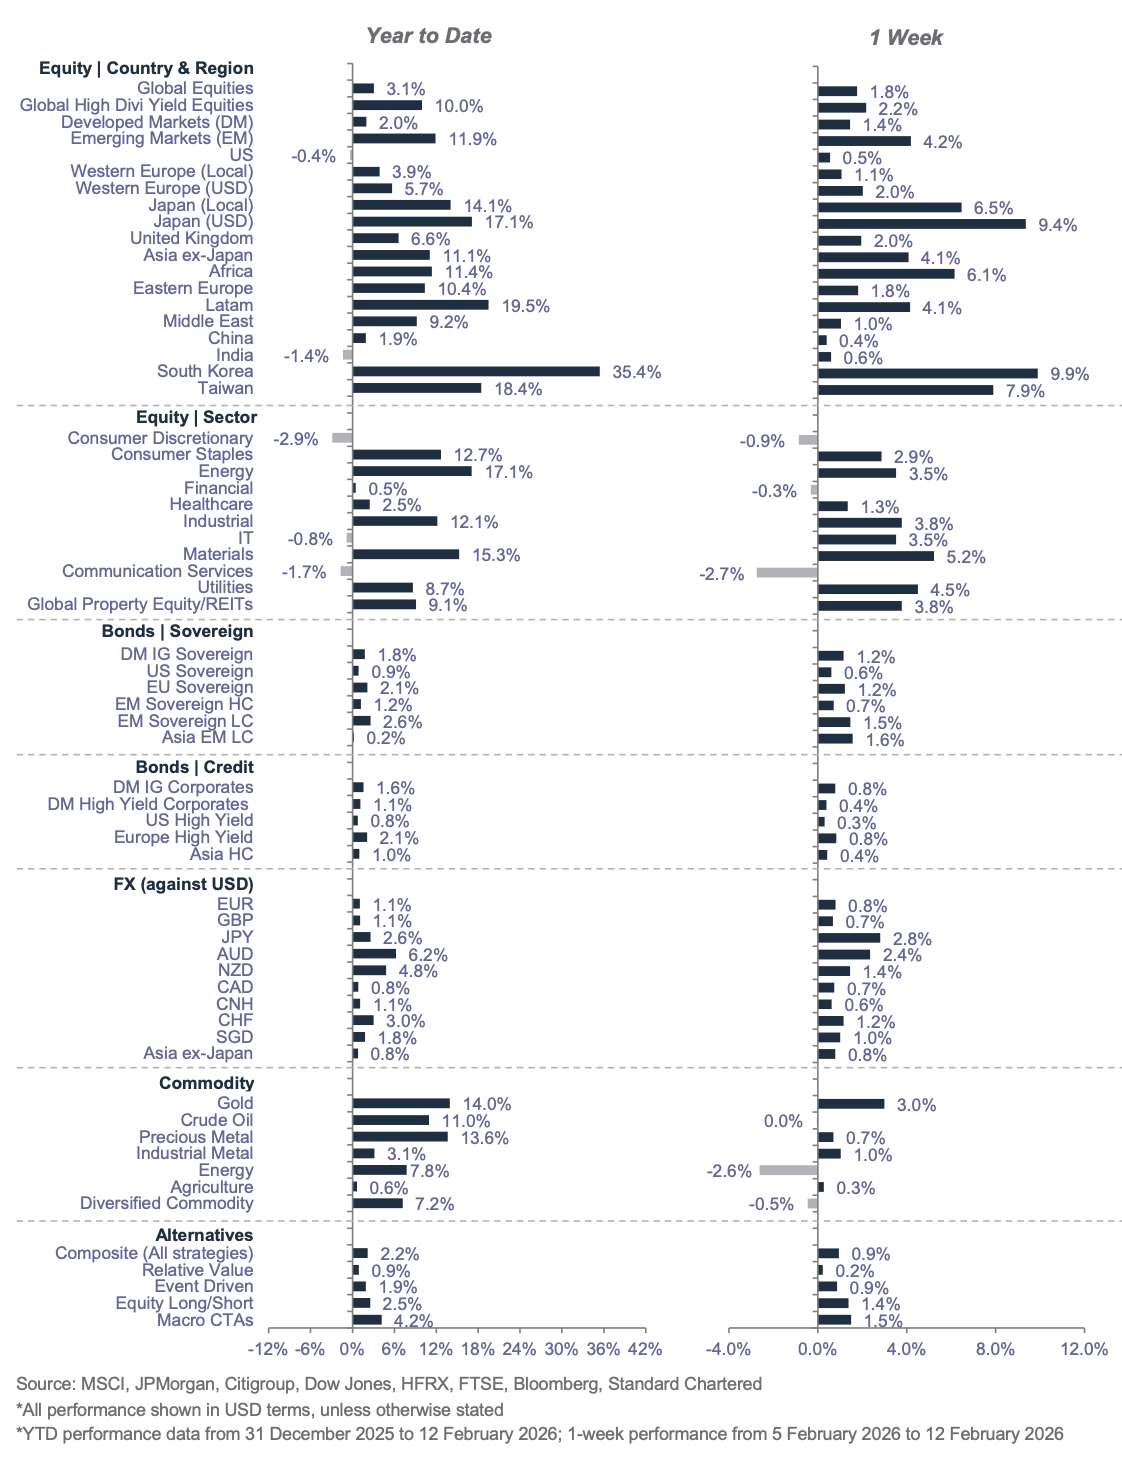
Market performance summary
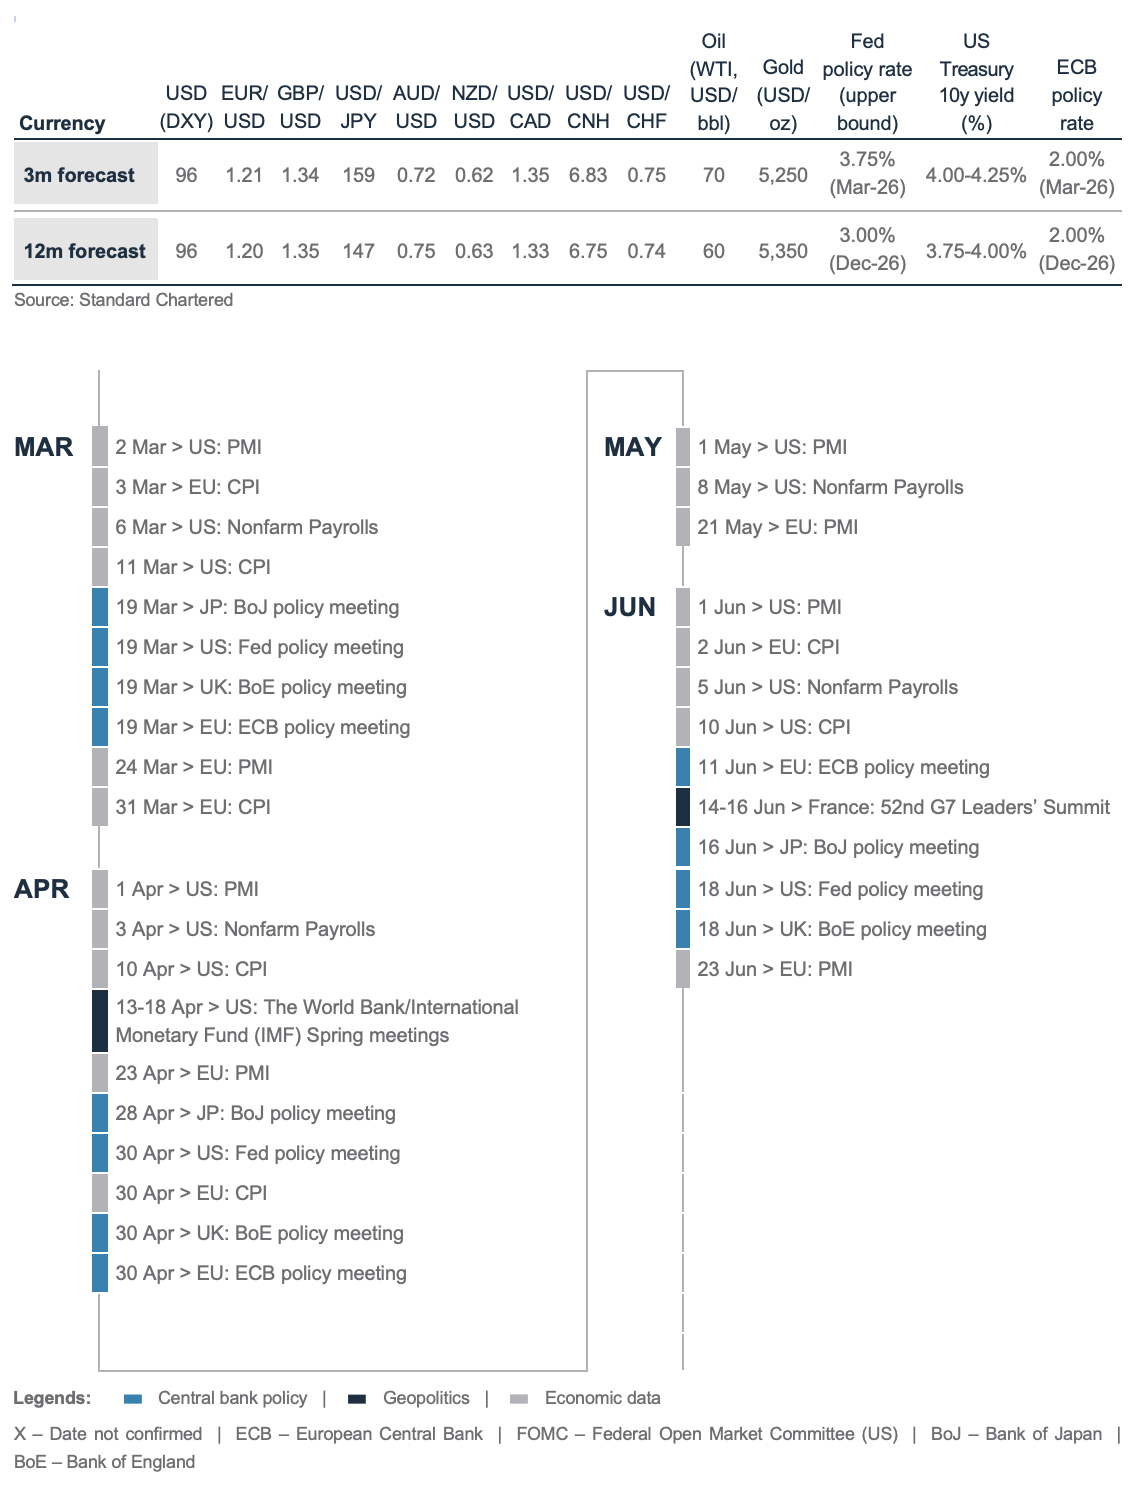
Our key forecasts and calendar events
SC Wealth Select


Explanatory notes
1. The figures on page 5 show allocations for a moderately aggressive risk profile only – different risk profiles may produce significantly different asset allocation results. Page 5 is only an example, provided for general information only and they do not constitute investment advice, an offer, recommendation or solicitation. They do not take into account the specific investment objectives, needs or risk tolerances of a particular person or class of persons and they have not been prepared for any particular person or class of persons.
2. Contingent Convertibles are complex financial instruments and are not a suitable or appropriate investment for all investors. This document is not an offer to sell or an invitation to buy any securities or any beneficial interests therein. Contingent convertible securities are not intended to be sold and should not be sold to retail clients in the European Economic Area (EEA) (each as defined in the Policy Statement on the Restrictions on the Retail Distribution of Regulatory Capital Instruments (Feedback to CP14/23 and Final Rules) (“Policy Statement”), read together with the Product Intervention (Contingent Convertible Instruments and Mutual Society Shares) Instrument 2015 (“Instrument”, and together with the Policy Statement, the “Permanent Marketing Restrictions”), which were published by the United Kingdom’s Financial Conduct Authority in June 2015), other than in circumstances that do not give rise to a contravention of the Permanent Marketing Restrictions.
Disclosure
This document is confidential and may also be privileged. If you are not the intended recipient, please destroy all copies and notify the sender immediately. This document is being distributed for general information only and is subject to the relevant disclaimers available at our Standard Chartered website under Regulatory disclosures. It is not and does not constitute research material, independent research, an offer, recommendation or solicitation to enter into any transaction or adopt any hedging, trading or investment strategy, in relation to any securities or other financial instruments. This document is for general evaluation only. It does not take into account the specific investment objectives, financial situation or particular needs of any particular person or class of persons and it has not been prepared for any particular person or class of persons. You should not rely on any contents of this document in making any investment decisions. Before making any investment, you should carefully read the relevant offering documents and seek independent legal, tax and regulatory advice. In particular, we recommend you to seek advice regarding the suitability of the investment product, taking into account your specific investment objectives, financial situation or particular needs, before you make a commitment to purchase the investment product. Opinions, projections and estimates are solely those of SC at the date of this document and subject to change without notice. Past performance is not indicative of future results and no representation or warranty is made regarding future performance. The value of investments, and the income from them, can go down as well as up, and you may not recover the amount of your original investment. You are not certain to make a profit and may lose money. Any forecast contained herein as to likely future movements in rates or prices or likely future events or occurrences constitutes an opinion only and is not indicative of actual future movements in rates or prices or actual future events or occurrences (as the case may be). This document must not be forwarded or otherwise made available to any other person without the express written consent of the Standard Chartered Group (as defined below). Standard Chartered Bank is incorporated in England with limited liability by Royal Charter 1853 Reference Number ZC18. The Principal Office of the Company is situated in England at 1 Basinghall Avenue, London, EC2V 5DD. Standard Chartered Bank is authorised by the Prudential Regulation Authority and regulated by the Financial Conduct Authority and Prudential Regulation Authority. Standard Chartered PLC, the ultimate parent company of Standard Chartered Bank, together with its subsidiaries and affiliates (including each branch or representative office), form the Standard Chartered Group. Standard Chartered Private Bank is the private banking division of Standard Chartered. Private banking activities may be carried out internationally by different legal entities and affiliates within the Standard Chartered Group (each an “SC Group Entity”) according to local regulatory requirements. Not all products and services are provided by all branches, subsidiaries and affiliates within the Standard Chartered Group. Some of the SC Group Entities only act as representatives of Standard Chartered Private Bank and may not be able to offer products and services or offer advice to clients.
Copyright © 2026, Accounting Research & Analytics, LLC d/b/a CFRA (and its affiliates, as applicable). Reproduction of content provided by CFRA in any form is prohibited except with the prior written permission of CFRA. CFRA content is not investment advice and a reference to or observation concerning a security or investment provided in the CFRA SERVICES is not a recommendation to buy, sell or hold such investment or security or make any other investment decisions. The CFRA content contains opinions of CFRA based upon publicly-available information that CFRA believes to be reliable and the opinions are subject to change without notice. This analysis has not been submitted to, nor received approval from, the United States Securities and Exchange Commission or any other regulatory body. While CFRA exercised due care in compiling this analysis, CFRA, ITS THIRD-PARTY SUPPLIERS, AND ALL RELATED ENTITIES SPECIFICALLY DISCLAIM ALL WARRANTIES, EXPRESS OR IMPLIED, INCLUDING, BUT NOT LIMITED TO, ANY WARRANTIES OF MERCHANTABILITY OR FITNESS FOR A PARTICULAR PURPOSE OR USE, to the full extent permitted by law, regarding the accuracy, completeness, or usefulness of this information and assumes no liability with respect to the consequences of relying on this information for investment or other purposes. No content provided by CFRA (including ratings, credit-related analyses and data, valuations, model, software or other application or output therefrom) or any part thereof may be modified, reverse engineered, reproduced or distributed in any form by any means, or stored in a database or retrieval system, without the prior written permission of CFRA, and such content shall not be used for any unlawful or unauthorized purposes. CFRA and any third-party providers, as well as their directors, officers, shareholders, employees or agents do not guarantee the accuracy, completeness, timeliness or availability of such content. In no event shall CFRA, its affiliates, or their third-party suppliers be liable for any direct, indirect, special, or consequential damages, costs, expenses, legal fees, or losses (including lost income or lost profit and opportunity costs) in connection with a subscriber’s, subscriber’s customer’s, or other’s use of CFRA’s content.
Market Abuse Regulation (MAR) Disclaimer
Banking activities may be carried out internationally by different branches, subsidiaries and affiliates within the Standard Chartered Group according to local regulatory requirements. Opinions may contain outright “buy”, “sell”, “hold” or other opinions. The time horizon of this opinion is dependent on prevailing market conditions and there is no planned frequency for updates to the opinion. This opinion is not independent of Standard Chartered Group’s trading strategies or positions. Standard Chartered Group and/or its affiliates or its respective officers, directors, employee benefit programmes or employees, including persons involved in the preparation or issuance of this document may at any time, to the extent permitted by applicable law and/or regulation, be long or short any securities or financial instruments referred to in this document or have material interest in any such securities or related investments. Therefore, it is possible, and you should assume, that Standard Chartered Group has a material interest in one or more of the financial instruments mentioned herein. Please refer to our Standard Chartered website under Regulatory disclosures for more detailed disclosures, including past opinions/ recommendations in the last 12 months and conflict of interests, as well as disclaimers. A covering strategist may have a financial interest in the debt or equity securities of this company/issuer. All covering strategist are licensed to provide investment recommendations under Monetary Authority of Singapore or Hong Kong Monetary Authority. This document must not be forwarded or otherwise made available to any other person without the express written consent of Standard Chartered Group.
Sustainable Investments
Any ESG data used or referred to has been provided by Morningstar, Sustainalytics, MSCI or Bloomberg. Refer to 1) Morningstar website under Sustainable Investing, 2) Sustainalytics website under ESG Risk Ratings, 3) MCSI website under ESG Business Involvement Screening Research and 4) Bloomberg green, social & sustainability bonds guide for more information. The ESG data is as at the date of publication based on data provided, is for informational purpose only and is not warranted to be complete, timely, accurate or suitable for a particular purpose, and it may be subject to change. Sustainable Investments (SI): This refers to funds that have been classified as ‘ESG Intentional Investments – Overall’ by Morningstar. SI funds have explicitly stated in their prospectus and regulatory filings that they either incorporate ESG factors into the investment process or have a thematic focus on the environment, gender diversity, low carbon, renewable energy, water or community development. For equity, it refers to shares/stocks issued by companies with Sustainalytics ESG Risk Rating of Low/Negligible. For bonds, it refers to debt instruments issued by issuers with Sustainalytics ESG Risk Rating of Low/Negligible, and/or those being certified green, social, sustainable bonds by Bloomberg. For structured products, it refers to products that are issued by any issuer who has a Sustainable Finance framework that aligns with Standard Chartered’s Green and Sustainable Product Framework, with underlying assets that are part of the Sustainable Investment universe or separately approved by Standard Chartered’s Sustainable Finance Governance Committee. Sustainalytics ESG risk ratings shown are factual and are not an indicator that the product is classified or marketed as “green”, “sustainable” or similar under any particular classification system or framework.
Country/Market Specific Disclosures
Bahrain: This document is being distributed in Bahrain by Standard Chartered Bank, Bahrain Branch, having its address at P.O. 29, Manama, Kingdom of Bahrain, is a branch of Standard Chartered Bank and is licensed by the Central Bank of Bahrain as a conventional retail bank. Botswana: This document is being distributed in Botswana by, and is attributable to, Standard Chartered Bank Botswana Limited which is a financial institution licensed under the Section 6 of the Banking Act CAP 46.04 and is listed in the Botswana Stock Exchange. Brunei Darussalam: This document is being distributed in Brunei Darussalam by, and is attributable to, Standard Chartered Bank (Brunei Branch) | Registration Number RFC/61 and Standard Chartered Securities (B) Sdn Bhd | Registration Number RC20001003. Standard Chartered Bank is incorporated in England with limited liability by Royal Charter 1853 Reference Number ZC18. Standard Chartered Securities (B) Sdn Bhd is a limited liability company registered with the Registry of Companies with Registration Number RC20001003 and licensed by Brunei Darussalam Central Bank as a Capital Markets Service License Holder with License Number BDCB/R/CMU/S3-CL and it is authorised to conduct Islamic investment business through an Islamic window. China Mainland: This document is being distributed in China by, and is attributable to, Standard Chartered Bank (China) Limited which is mainly regulated by National Financial Regulatory Administration (NFRA), State Administration of Foreign Exchange (SAFE), and People’s Bank of China (PBOC). Hong Kong: In Hong Kong, this document, except for any portion advising on or facilitating any decision on futures contracts trading, is distributed by Standard Chartered Bank (Hong Kong) Limited (“SCBHK”), a subsidiary of Standard Chartered PLC. SCBHK has its registered address at 32/F, Standard Chartered Bank Building, 4-4A Des Voeux Road Central, Hong Kong and is regulated by the Hong Kong Monetary Authority and registered with the Securities and Futures Commission (“SFC”) to carry on Type 1 (dealing in securities), Type 4 (advising on securities), Type 6 (advising on corporate finance) and Type 9 (asset management) regulated activity under the Securities and Futures Ordinance (Cap. 571) (“SFO”) (CE No. AJI614). The contents of this document have not been reviewed by any regulatory authority in Hong Kong and you are advised to exercise caution in relation to any offer set out herein. If you are in doubt about any of the contents of this document, you should obtain independent professional advice. Any product named herein may not be offered or sold in Hong Kong by means of any document at any time other than to “professional investors” as defined in the SFO and any rules made under that ordinance. In addition, this document may not be issued or possessed for the purposes of issue, whether in Hong Kong or elsewhere, and any interests may not be disposed of, to any person unless such person is outside Hong Kong or is a “professional investor” as defined in the SFO and any rules made under that ordinance, or as otherwise may be permitted by that ordinance. In Hong Kong, Standard Chartered Private Bank is the private banking division of SCBHK, a subsidiary of Standard Chartered PLC. Ghana: Standard Chartered Bank Ghana Limited accepts no liability and will not be liable for any loss or damage arising directly or indirectly (including special, incidental or consequential loss or damage) from your use of these documents. Past performance is not indicative of future results and no representation or warranty is made regarding future performance. You should seek advice from a financial adviser on the suitability of an investment for you, taking into account these factors before making a commitment to invest in an investment. To unsubscribe from receiving further updates, please send an email to feedback.ghana@sc.com. Please do not reply to this email. Call our Priority Banking on 0302610750 for any questions or service queries. You are advised not to send any confidential and/or important information to Standard Chartered via e-mail, as Standard Chartered makes no representations or warranties as to the security or accuracy of any information transmitted via e-mail. Standard Chartered shall not be responsible for any loss or damage suffered by you arising from your decision to use e-mail to communicate with the Bank. India: This document is being distributed in India by Standard Chartered in its capacity as a distributor of mutual funds and referrer of any other third party financial products. Standard Chartered does not offer any ‘Investment Advice’ as defined in the Securities and Exchange Board of India (Investment Advisers) Regulations, 2013 or otherwise. Services/products related securities business offered by Standard Charted are not intended for any person, who is a resident of any jurisdiction, the laws of which imposes prohibition on soliciting the securities business in that jurisdiction without going through the registration requirements and/or prohibit the use of any information contained in this document. Indonesia: This document is being distributed in Indonesia by Standard Chartered Bank, Indonesia branch, which is a financial institution licensed and supervised by Otoritas Jasa Keuangan (Financial Service Authority) and Bank Indonesia. Jersey: In Jersey, Standard Chartered Private Bank is the Registered Business Name of the Jersey Branch of Standard Chartered Bank. The Jersey Branch of Standard Chartered Bank is regulated by the Jersey Financial Services Commission. Copies of the latest audited accounts of Standard Chartered Bank are available from its principal place of business in Jersey: PO Box 80, 15 Castle Street, St Helier, Jersey JE4 8PT. Standard Chartered Bank is incorporated in England with limited liability by Royal Charter in 1853 Reference Number ZC 18. The Principal Office of the Company is situated in England at 1 Basinghall Avenue, London, EC2V 5DD. Standard Chartered Bank is authorised by the Prudential Regulation Authority and regulated by the Financial Conduct Authority and Prudential Regulation Authority. The Jersey Branch of Standard Chartered Bank is also an authorised financial services provider under license number 44946 issued by the Financial Sector Conduct Authority of the Republic of South Africa. Jersey is not part of the United Kingdom and all business transacted with Standard Chartered Bank, Jersey Branch and other SC Group Entity outside of the United Kingdom, are not subject to some or any of the investor protection and compensation schemes available under United Kingdom law. Kenya: This document is being distributed in Kenya by and is attributable to Standard Chartered Bank Kenya Limited. Investment Products and Services are distributed by Standard Chartered Investment Services Limited, a wholly owned subsidiary of Standard Chartered Bank Kenya Limited that is licensed by the Capital Markets Authority in Kenya, as a Fund Manager. Standard Chartered Bank Kenya Limited is regulated by the Central Bank of Kenya. Malaysia: This document is being distributed in Malaysia by Standard Chartered Bank Malaysia Berhad (“SCBMB”). Recipients in Malaysia should contact SCBMB in relation to any matters arising from, or in connection with, this document. This document has not been reviewed by the Securities Commission Malaysia. The product lodgement, registration, submission or approval by the Securities Commission of Malaysia does not amount to nor indicate recommendation or endorsement of the product, service or promotional activity. Investment products are not deposits and are not obligations of, not guaranteed by, and not protected by SCBMB or any of the affiliates or subsidiaries, or by Perbadanan Insurans Deposit Malaysia, any government or insurance agency. Investment products are subject to investment risks, including the possible loss of the principal amount invested. SCBMB expressly disclaim any liability and responsibility for any loss arising directly or indirectly (including special, incidental or consequential loss or damage) arising from the financial losses of the Investment Products due to market condition. Nigeria: This document is being distributed in Nigeria by Standard Chartered Bank Nigeria Limited (SCB Nigeria), a bank duly licensed and regulated by the Central Bank of Nigeria. SCB Nigeria accepts no liability for any loss or damage arising directly or indirectly (including special, incidental or consequential loss or damage) from your use of these documents. You should seek advice from a financial adviser on the suitability of an investment for you, taking into account these factors before making a commitment to invest in an investment. To unsubscribe from receiving further updates, please send an email to clientcare.ng@sc.com requesting to be removed from our mailing list. Please do not reply to this email. Call our Priority Banking on 02 012772514 for any questions or service queries. SCB Nigeria shall not be responsible for any loss or damage arising from your decision to send confidential and/or important information to Standard Chartered via e-mail. SCB Nigeria makes no representations or warranties as to the security or accuracy of any information transmitted via e-mail. Pakistan: This document is being distributed in Pakistan by, and attributable to Standard Chartered Bank (Pakistan) Limited having its registered office at PO Box 5556, I.I Chundrigar Road Karachi, which is a banking company registered with State Bank of Pakistan under Banking Companies Ordinance 1962 and is also having licensed issued by Securities & Exchange Commission of Pakistan for Security Advisors. Standard Chartered Bank (Pakistan) Limited acts as a distributor of mutual funds and referrer of other third-party financial products. Singapore: This document is being distributed in Singapore by, and is attributable to, Standard Chartered Bank (Singapore) Limited (Registration No. 201224747C/ GST Group Registration No. MR-8500053-0, “SCBSL”). Recipients in Singapore should contact SCBSL in relation to any matters arising from, or in connection with, this document. SCBSL is an indirect wholly owned subsidiary of Standard Chartered Bank and is licensed to conduct banking business in Singapore under the Singapore Banking Act, 1970. Standard Chartered Private Bank is the private banking division of SCBSL. IN RELATION TO ANY SECURITY OR SECURITIES-BASED DERIVATIVES CONTRACT REFERRED TO IN THIS DOCUMENT, THIS DOCUMENT, TOGETHER WITH THE ISSUER DOCUMENTATION, SHALL BE DEEMED AN INFORMATION MEMORANDUM (AS DEFINED IN SECTION 275 OF THE SECURITIES AND FUTURES ACT, 2001 (“SFA”)). THIS DOCUMENT IS INTENDED FOR DISTRIBUTION TO ACCREDITED INVESTORS, AS DEFINED IN SECTION 4A(1)(a) OF THE SFA, OR ON THE BASIS THAT THE SECURITY OR SECURITIES-BASED DERIVATIVES CONTRACT MAY ONLY BE ACQUIRED AT A CONSIDERATION OF NOT LESS THAN S$200,000 (OR ITS EQUIVALENT IN A FOREIGN CURRENCY) FOR EACH TRANSACTION. Further, in relation to any security or securities-based derivatives contract, neither this document nor the Issuer Documentation has been registered as a prospectus with the Monetary Authority of Singapore under the SFA. Accordingly, this document and any other document or material in connection with the offer or sale, or invitation for subscription or purchase, of the product may not be circulated or distributed, nor may the product be offered or sold, or be made the subject of an invitation for subscription or purchase, whether directly or indirectly, to persons other than a relevant person pursuant to section 275(1) of the SFA, or any person pursuant to section 275(1A) of the SFA, and in accordance with the conditions specified in section 275 of the SFA, or pursuant to, and in accordance with the conditions of, any other applicable provision of the SFA. In relation to any collective investment schemes referred to in this document, this document is for general information purposes only and is not an offering document or prospectus (as defined in the SFA). This document is not, nor is it intended to be (i) an offer or solicitation of an offer to buy or sell any capital markets product; or (ii) an advertisement of an offer or intended offer of any capital markets product. Deposit Insurance Scheme: Singapore dollar deposits of non-bank depositors are insured by the Singapore Deposit Insurance Corporation, for up to S$100,000 in aggregate per depositor per Scheme member by law. Foreign currency deposits, dual currency investments, structured deposits and other investment products are not insured. This advertisement has not been reviewed by the Monetary Authority of Singapore. Taiwan: SC Group Entity or Standard Chartered Bank (Taiwan) Limited (“SCB (Taiwan)”) may be involved in the financial instruments contained herein or other related financial instruments. The author of this document may have discussed the information contained herein with other employees or agents of SC or SCB (Taiwan). The author and the above-mentioned employees of SC or SCB (Taiwan) may have taken related actions in respect of the information involved (including communication with customers of SC or SCB (Taiwan) as to the information contained herein). The opinions contained in this document may change, or differ from the opinions of employees of SC or SCB (Taiwan). SC and SCB (Taiwan) will not provide any notice of any changes to or differences between the above-mentioned opinions. This document may cover companies with which SC or SCB (Taiwan) seeks to do business at times and issuers of financial instruments. Therefore, investors should understand that the information contained herein may serve as specific purposes as a result of conflict of interests of SC or SCB (Taiwan). SC, SCB (Taiwan), the employees (including those who have discussions with the author) or customers of SC or SCB (Taiwan) may have an interest in the products, related financial instruments or related derivative financial products contained herein; invest in those products at various prices and on different market conditions; have different or conflicting interests in those products. The potential impacts include market makers’ related activities, such as dealing, investment, acting as agents, or performing financial or consulting services in relation to any of the products referred to in this document. UAE: DIFC – Standard Chartered Bank is incorporated in England with limited liability by Royal Charter 1853 Reference Number ZC18.The Principal Office of the Company is situated in England at 1 Basinghall Avenue, London, EC2V 5DD. Standard Chartered Bank is authorised by the Prudential Regulation Authority and regulated by the Financial Conduct Authority and Prudential Regulation Authority. Standard Chartered Bank, Dubai International Financial Centre having its offices at Dubai International Financial Centre, Building 1, Gate Precinct, P.O. Box 999, Dubai, UAE is a branch of Standard Chartered Bank and is regulated by the Dubai Financial Services Authority (“DFSA”). This document is intended for use only by Professional Clients and is not directed at Retail Clients as defined by the DFSA Rulebook. In the DIFC we are authorised to provide financial services only to clients who qualify as Professional Clients and Market Counterparties and not to Retail Clients. As a Professional Client you will not be given the higher retail client protection and compensation rights and if you use your right to be classified as a Retail Client we will be unable to provide financial services and products to you as we do not hold the required license to undertake such activities. For Islamic transactions, we are acting under the supervision of our Shariah Supervisory Committee. Relevant information on our Shariah Supervisory Committee is currently available on the Standard Chartered Bank website in the Islamic banking section. For residents of the UAE – Standard Chartered UAE (“SC UAE”) is licensed by the Central Bank of the U.A.E. SC UAE is licensed by Securities and Commodities Authority to practice Promotion Activity. SC UAE does not provide financial analysis or consultation services in or into the UAE within the meaning of UAE Securities and Commodities Authority Decision No. 48/r of 2008 concerning financial consultation and financial analysis. Uganda: Our Investment products and services are distributed by Standard Chartered Bank Uganda Limited, which is licensed by the Capital Markets Authority as an investment adviser. United Kingdom: In the UK, Standard Chartered Bank is authorised by the Prudential Regulation Authority and regulated by the Financial Conduct Authority and Prudential Regulation Authority. This communication has been approved by Standard Chartered Bank for the purposes of Section 21 (2) (b) of the United Kingdom’s Financial Services and Markets Act 2000 (“FSMA”) as amended in 2010 and 2012 only. Standard Chartered Bank (trading as Standard Chartered Private Bank) is also an authorised financial services provider (license number 45747) in terms of the South African Financial Advisory and Intermediary Services Act, 2002. The Materials have not been prepared in accordance with UK legal requirements designed to promote the independence of investment research, and that it is not subject to any prohibition on dealing ahead of the dissemination of investment research. Vietnam: This document is being distributed in Vietnam by, and is attributable to, Standard Chartered Bank (Vietnam) Limited which is mainly regulated by State Bank of Vietnam (SBV). Recipients in Vietnam should contact Standard Chartered Bank (Vietnam) Limited for any queries regarding any content of this document. Zambia: This document is distributed by Standard Chartered Bank Zambia Plc, a company incorporated in Zambia and registered as a commercial bank and licensed by the Bank of Zambia under the Banking and Financial Services Act Chapter 387 of the Laws of Zambia.