20 March 2026
Global Market Outlook
Crude expectations
We see a 70% chance oil prices will peak in the next 3-4 weeks as the Middle East conflict eases. This base case drives our continued preference for global equities and gold over bonds and cash. However, downside risks warrant close monitoring.
We remain Overweight US and Asia ex-Japan equities. In our base scenario of a short-lived conflict, the pullback in Asian equities is an opportunity to add exposure, particularly in India and China. In the US, the technology sector remains attractive after YTD underperformance.
We raise Developed Market High Yield bonds to Overweight, while maintaining Emerging Market bonds Overweight. A rise in US bond yields and corporate bond yield premiums offers an opportunity to lock in yields. After the recent oil price-driven rebound, we expect the USD to weaken this year.
What are the various scenarios to consider?
Are global central banks turning hawkish?
Are your quant models still bullish on equities?
Strategy
Investment strategy and key themes
|
|
||||
|

12m Foundation Overweights:
- Global equities, gold
- US, Asia ex-Japan equities
- EM USD and local currency (LCY), DM High Yield (HY)^
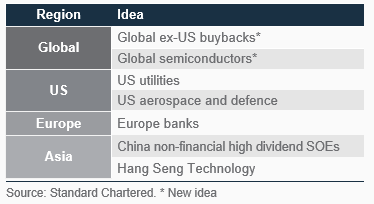
Opportunistic ideas – Equities
- Global semicon^, buybacks^
- US aerospace, defence, utilities
- China non-financial high-dividend SoEs, Hang Seng Technology index
- European banks
Top Global Sectors:
- US: Tech, utilities, healthcare
- Europe ex-UK: Financials
Opportunistic ideas – Bonds
- US Treasury Inflation-protected Securities (TIPS), short-duration HY bonds, AAA CLOs, utility sector hybrids^
- EU bank AT1s FX-hedged
- AUD corporate bonds^
Crude expectations
- We see a 70% chance oil prices will peak in the next 3-4 weeks as the Middle East conflict eases. This base case drives our preference for global equities and gold over bonds and cash. However, downside risks warrant close monitoring.
- We remain Overweight US and Asia ex-Japan (AxJ) equities. In our base scenario of a short-lived conflict, the pullback in Asian equities is an opportunity to add exposure, particularly in India and China. In the US, the US technology sector remains attractive after YTD underperformance.
- We raise Developed Market (DM) High Yield (HY) bonds to Overweight, while maintaining Emerging Market (EM) bonds Overweight. Arise in US bond yields and corporate bond yield premiums offers an opportunity to lock in yields. After the recent oil price-driven rebound, we expect the USD to weaken this year.
Base case or worse?
Equities delivered robust returns in the first two months of 2026, with a notable rotation to non-technology US sectors and non-US market outperformance. Bond yields remained rangebound and the USD remained soft. However, since the Middle East conflict began, the market narrative has turned to geopolitical risks. In our base case (70% chance), supply disruptions causing high oil prices could last another 3-4 weeks. How long oil prices stay high is critical – an important distinction because the impact on global inflation is likely to be fleeting if price gains do not sustain beyond a few weeks, allowing a return to our baseline ‘soft-landing’ scenario supported by Fed rate cuts in H2 26.
Conversely, a downside scenario, where oil prices stay high for an extended multi-month period (we assign a 30% chance), would likely be much more damaging for inflation and would limit the Fed’s ability to cut rates. This would risk a knock-on impact on equity and bond markets and could justify changes to our asset class views. While we currently view the likelihood of this scenario as relatively low, the rapidly evolving situation warrants close monitoring in the coming days and weeks.
Jitters in private credit are another risk to monitor. Near-term negativity, including some gating events, are possible. However, we see value in riding out short-term worries as long as exposure is focused on the highest-quality managers.
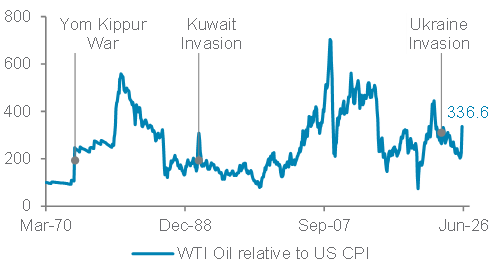
Fig. 1 Oil price surge has been sizeable, but muted relative to past conflicts in inflation-adjusted terms
WTI oil price in US inflation-adjusted terms
Oil as a swing factor for equity regions
US equities have been remarkably resilient amid the rise in oil prices to around USD 100/bbl. US equities have outperformed non-US equities since the start of the Middle East conflict and the related jump in oil prices, given the US’s relatively low dependence on energy imports compared to Europe or Asia. We maintain our Overweight stance on US equities.
In our base scenario, we expect US equities to outperform, driven mainly by strong earnings growth, with the market ultimately looking through near-term oil-driven volatility. We believe pullbacks would represent buying opportunities.
Within this, we view the US technology sector’s YTD underperformance as an opportunity to add where appropriate. The sector continues to deliver strong earnings growth, which we believe will ultimately drive performance, particularly for the semiconductor and internet sub-sectors over software. Within software, we prefer exposure across industries such as cybersecurity, operating systems and databases.
That said, avoiding excessive sector concentration is key. We see US utilities and healthcare sectors offering opportunities after recent pullbacks.
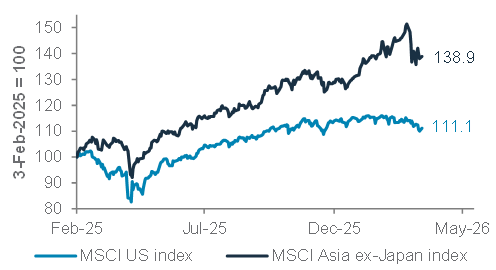
Asian equities, in contrast, have faced larger drawdowns since end-February (with Japanese equities falling more than AxJ). This is unsurprising, with the region highly dependent on energy imports from the Middle East, placing it at risk from both higher oil prices and reduced physical oil flows.
Asian equities are likely to remain under pressure for now if the conflict extends the rise in oil prices. However, in our base case of the oil price rise lasting only a few weeks, we would view any further near-term weakness in the coming 3-4 weeks as an attractive buying opportunity in Asian equities.
Within Asia, we remain Overweight Indian equities. The market is clearly sensitive to oil prices, but any further pullback in the coming weeks is expected to be an attractive buying opportunity, given our long-term focus on the rebound in corporate earnings growth and the cumulative impact of policy stimulus. We are similarly Overweight Chinese equities and expect outperformance to be led by strong technology sector earnings.
Fig. 2 US equity markets thus far experiencing a mild pullback, consistent with our base-case scenario
MSCI US and MSCI Asia ex-Japan indices
We also upgrade Japanese equities to a Neutral allocation and expect the market’s performance to resume once peak oil price pressure recedes.
Locking in the yields
The risk to inflation from oil prices has driven the recent rebound in US government bond yields.
In our base scenario, we view the bond yield rise (the rebound in the 10-year benchmark yield above 4.25%) as an attractive opportunity to lock in yields. We increasingly prefer to take this exposure via corporate bonds, given the recent rise in corporate bond yield premiums. Hence, we are now Overweight DM HY bonds and Underweight DM Investment Grade (IG) government bonds. We view DM IG corporate bonds as a core holding.
Our Overweight to EM bonds (both USD and local currency) remains unchanged. EM USD bonds offer a good balance between commodity exporters and importers, while local currency bonds should benefit from a renewed weakness in the USD over the coming months.
Watch the USD
The USD has unsurprisingly displayed safe-haven characteristics during the current oil price surge, resulting in the USD Dollar index (DXY) testing the key 100 level. USD gains also likely explain gold’s inability to rise in recent weeks.
In our base-case scenario, we expect USD weakness to resume over the rest of the year and, thus, see the current levels as an opportunity to rebuild weaker USD views. This includes being Overweight gold, preferring Asian equities and EM bonds, and diversifying currency exposure (including from any concentrated exposure) to carry trade currencies such as the CHF. However, we continue to expect the AUD to strengthen given domestic inflation pressure and a hawkish Reserve Bank of Australia (RBA).
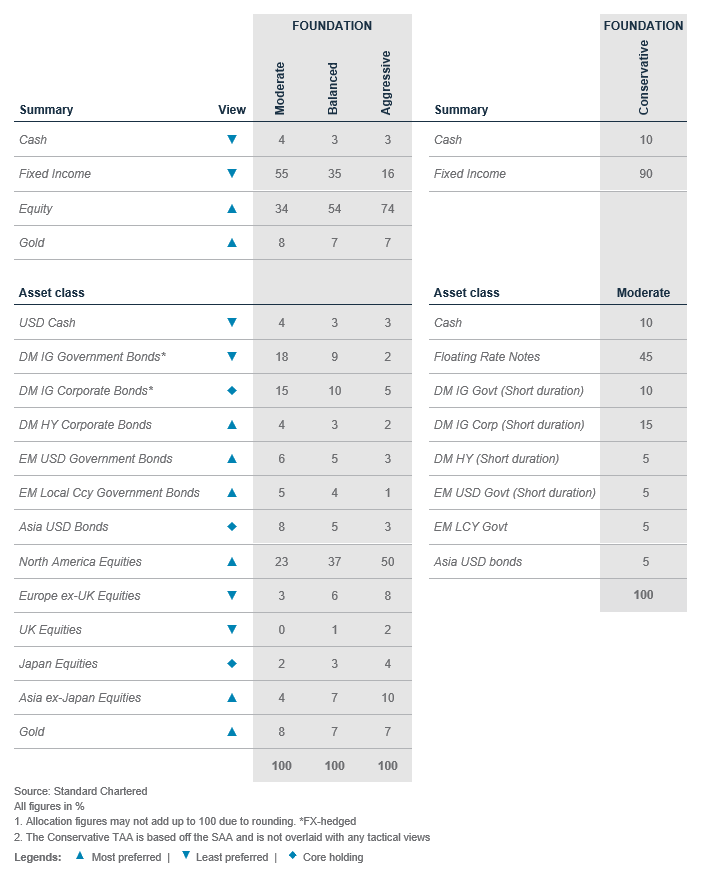
Foundation asset allocation models
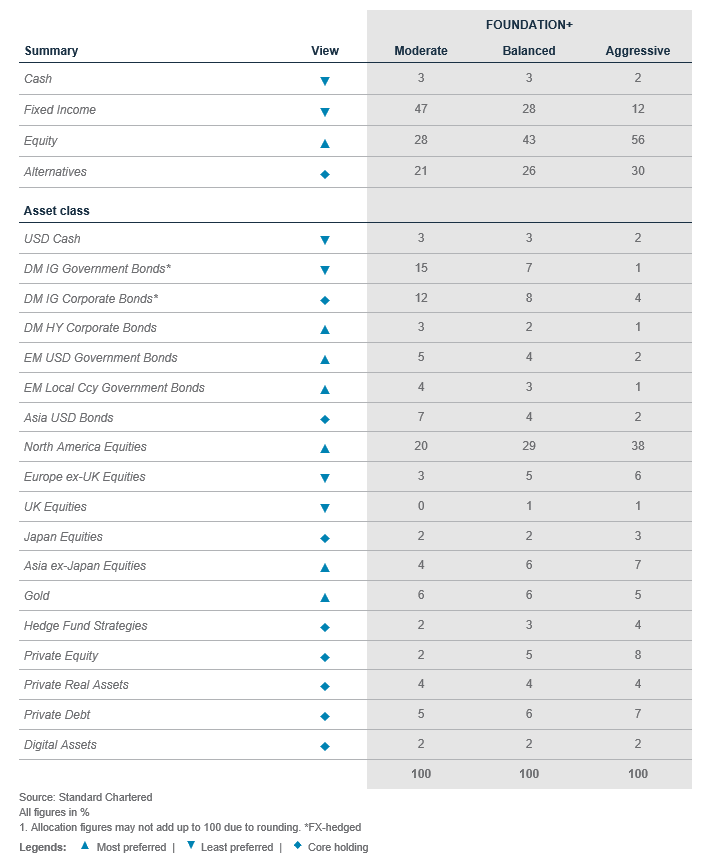
The Foundation and Foundation+ models are allocations that you can use as the starting point for building a diversified investment portfolio. The Foundation model showcases a set of allocations focusing on traditional asset classes that are accessible to most investors, while the Foundation+ model includes allocations to private assets that may be accessible to investors in some jurisdictions, but not others.
Fig. 3 Foundation asset allocation for a balanced risk profile
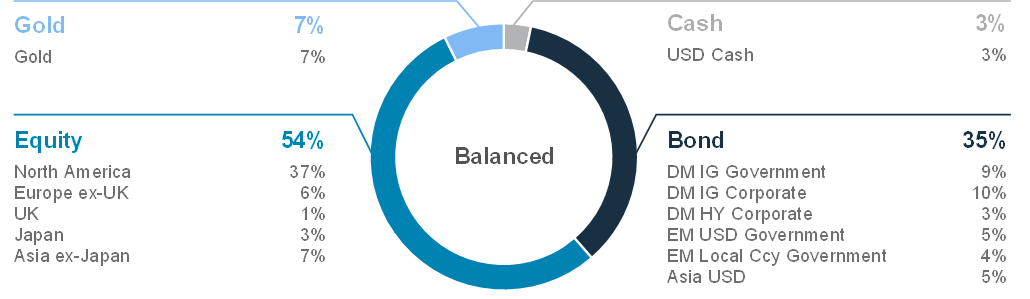
Fig. 4 Foundation+ asset allocation for a balanced risk profile
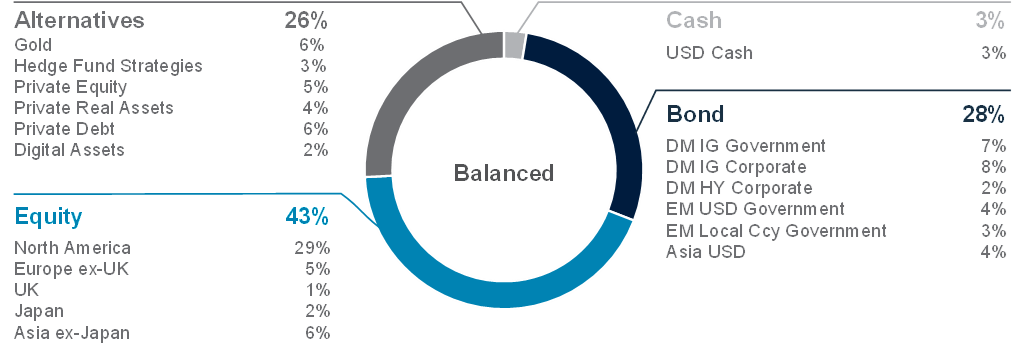
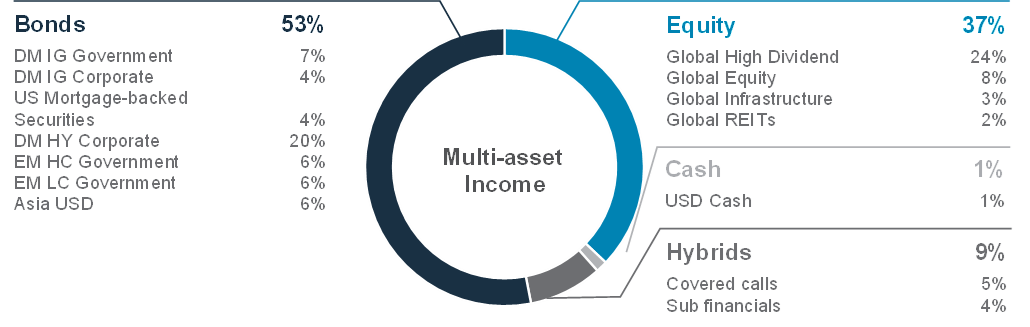
Fig. 5 Multi-asset income allocation for a moderate risk profile
Source: Standard Chartered
Foundation: Our tactical asset allocation views
Fig. 6 Performance of our Foundation Allocations*
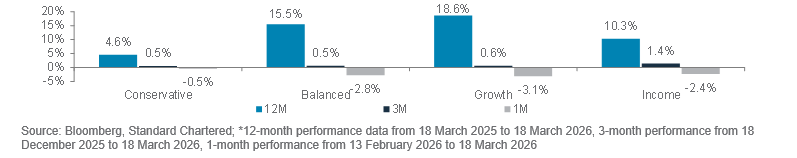
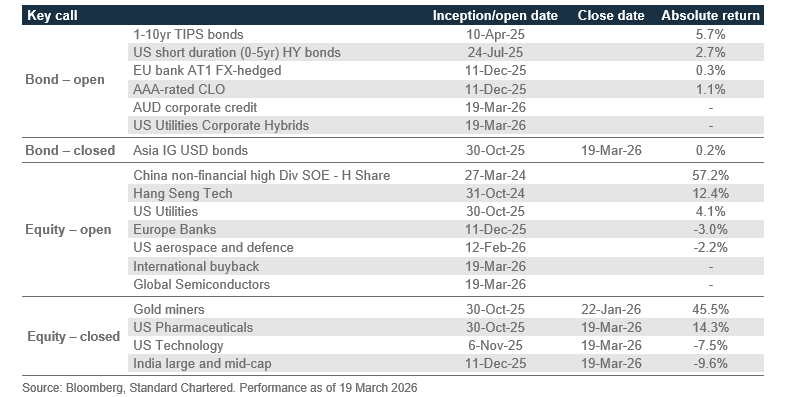
Fig. 7 Opportunistic ideas performance
Macro overview – at a glance
Our macroeconomic outlook and key questions
|
Our view
Core scenario (soft landing, 60% probability): We believe the Middle East conflict will be short-lived and thus unlikely to dent our base-case scenario of an economic soft landing this year. While near-term inflation expectations have surged with oil prices, the global fundamental backdrop is less hawkish than in 2022, when the Ukraine conflict accentuated pandemic-led supply disruptions to drive inflation sustainably higher. For one, the US job market is significantly weaker today, while inflation stood close to record lows in Asia before the latest conflict. Given this, we expect the Fed to cut rates by 50bps in H2 as focus turns to reviving the job market. The ECB is likely to hold rates, while China eases policy in H2 to sustain its consumption-led growth.
Downside risk (hard landing, 25% probability): We raise the risk of a hard landing from 15% due to the Middle East conflict. A prolonged conflict would keep oil prices higher for longer, delaying Fed rate cuts and further impairing the US job market. A stock market downturn hurting investor confidence and/or a bond sell-off on inflation and/or debt concerns are other tail risks.
Upside risk (no landing, 15% probability): There is still a possibility that US tax and Fed rate cuts, fiscal easing in Germany and China and a potential rollback of US tariffs could revive ‘animal spirits’, provided the Middle East conflict is short-lived. A Russia-Ukraine peace deal, a US-China ‘grand bargain’ or EU-wide defence spending could potentially lift global growth.
Key chart
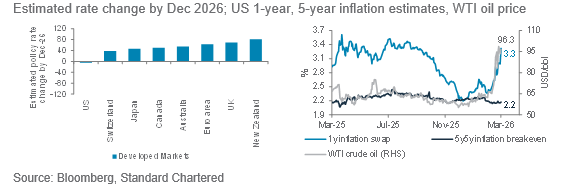
The Fed remains the only major DM central bank that is still expected to cut rates by the end of the year as other central banks turn hawkish amid a revival in inflation expectations
Fig. 8 Global rate estimates turn hawkish as oil price spike lifts near-term inflation
Policy rates watch
Fed to cut rates by 50bps by December: Our base case (60% probability) is that the US economy achieves a soft-landing this year. A short-lived Middle East conflict would temporarily raise US energy costs, hurt real disposable income and spending without causing a sustained inflation shock. Nevertheless, the US is likely to be more resilient than other major economies, given it’s the world’s largest oil producer and a net oil exporter. Moreover, an estimated USD 160bn of tax refunds in Q1 due to last year’s tax cuts should partly offset the hit to household wallets from higher oil prices, sustaining consumption. Also, AI-driven investment is likely to pick up this year, enabling economic growth to settle below long-term trend. Any rollback in tariffs heading into November mid-term elections would provide further support to growth.
There is low risk of a wage spiral, as the US job market was close to stalling before the conflict and is much weaker than during the 2022 energy shock caused by the Ukraine conflict.
US consumer sentiment remains near post-pandemic lows, while long-term inflation expectation remains low, although near-term inflation expectations have spiked with oil prices.
Against this backdrop, we expect the Fed to hold rates in H1 as it looks through a brief energy-led inflation upturn. A delay in Fed rate cuts is likely to put further downward pressure on the job market. This, in turn, is likely to push the central bank, under incoming Chair Kevin Warsh (subject to Senate confirmation), to turn dovish in H2 as oil price-driven inflation fades and the focus turns to reviving the weak job market. We expect the Fed to deliver 50bps of cuts in H2 versus market expectations of less than a full 25bps cut.
ECB to hold rates, with a hawkish bias: The Euro area economy was in fine balance before the onset of the Middle East conflict. The unemployment rate was close to record lows, underscoring a tight job market, while headline and core inflation were close to the ECB’s 2% target. However, overall business and consumer confidence remains lacklustre, with
wide regional disparity – Germany and Italy business activity picking up, the former due to growing impact of fiscal stimulus, while France remains subdued amid political uncertainty.
In our base scenario of a short-lived Middle East conflict, the impact on Euro area inflation is likely to be temporary, with a potential price spike in Q2, followed by an easing off in H2. We expect the ECB to look through any short-term inflation spike and hold its deposit rate at 2% as it focuses on the durability and impact of the conflict on long-term inflation expectations. Europe’s natural gas prices have almost doubled since the start of the latest conflict but remain less than one-fifth of 2022 highs thanks to efforts in recent years to diversify energy sources away from Russia. In January, almost 60% of the EU’s LNG imports came from the US.
However, in the risk scenario of an extended conflict leading oil and gas prices to stay sustainably above USD 100/bbl and EUR 100/Mwh for a few months, inflation is likely to rise towards 4%. Given the backdrop of a tight labour market, this would likely force the ECB to hike rates. However, any energy-price driven inflation spike is likely to be self-limiting as it ultimately hurts disposable incomes and growth.
China to hold policy now, ease in H2: China’s domestic economy was stabilising before the conflict, led by a recovery in investment. Data from the first two months of the year showed fixed‑asset investment expanded 1.8% y/y, led by a rebound in infrastructure investment and manufacturing. After under-utilising fiscal stimulus last year, authorities are front‑loading support for infrastructure and manufacturing.
Meanwhile, exports continue to drive China’s industrial sector, underscoring its competitiveness against higher US tariffs. The AI boom continues to power demand for China’s high-tech electronics and related exports. The marginal easing of US tariffs following the US Supreme Court ruling should help in the coming quarters, although President Trump is seeking to use other provisions to reimpose most of those tariffs.
Domestic consumption remains tepid, although it slightly beat expectations in the first two months of the year aided by strong services demand during the Lunar New Year holidays. The property sector continues to contract, weighing on
consumer and business confidence. The latest National People’s Congress’ focus on domestic consumption, productivity growth through hi-tech innovation and tackling irrational price competition should continue to help ease deflationary pressures.
We expect a temporary oil price spike to have a limited impact on China’s economy, given sufficient reserves and significant measures in recent years to diversify its energy supplies and electrify urban transport. However, a prolonged conflict and disruption in oil supply would be a risk, given China’s significant dependence on Middle East energy. We expect authorities to hold monetary policy in H1, before easing through bank reserve ratio and rate cuts in H2 to secure the government’s 4.5-5.0% growth target for 2026.
BoJ to hike rates by 50bps by December: Japan’s economy faces challenges from elevated oil prices caused by the Middle East conflict, given almost 90% of its crude oil imports come from the Middle East. The oil price spike has contributed to JPY depreciation, with USD/JPY approaching 2024’s 40-year high. PM Takaichi’s plan to cut the food consumption tax for two years has also raised fiscal concerns, weighing on the JPY. FX weakness is likely to fuel imported inflation further – Japan’s core inflation, excluding fresh food and energy, was running at 2.6% in January, above the BoJ’s 2% target. However, the BoJ remains hesitant in hiking rates due to subdued domestic demand.
We expect the BoJ to maintain its policy rate at 0.75% during H1. While Japan’s corporate investments remain robust due to the global AI boom, policymakers remain concerned about muted household spending due to stagnating real incomes. They are likely to wait for the annual spring wage negotiations to assess whether another round of strong wage growth (the leading trade union is demanding at least a 5% wage hike for the third straight year) leads to sustained consumption before advancing further policy normalisation amid the ongoing oil price shock. BoJ policymakers are concerned that most of the wage growth benefits workers at larger firms, widening the gap with the small-scale sector workers. Our core scenario is for the BoJ to eventually raise rates by 50bps in H2, with the policy rate rising to 1.25% by December, as it seeks to prevent further JPY weakness from fuelling inflation expectations.
Fig. 9 Fed to cut rates in H2 to revive stalling job market
US quarterly job creation
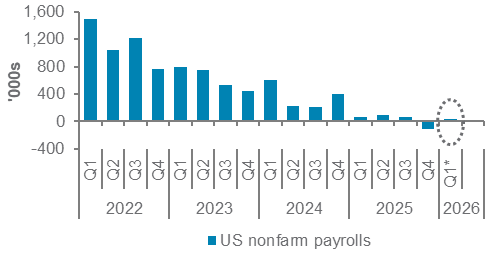
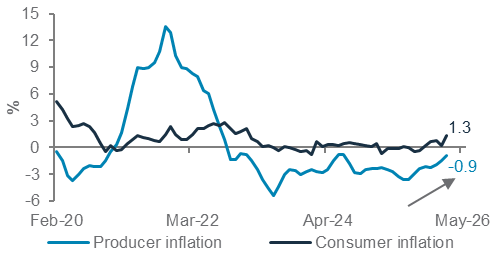
Fig. 10 China’s deflation was easing before the conflict
China’s consumer and producer price inflation
Asset Classes
Fixed Income – at a glance
|
|
||||
|
|
||||
Our view
Foundation: We are Underweight fixed income. Within the asset class, we are Underweight DM government bonds and prefer both EM USD and LCY bonds. Despite the ongoing Middle East conflict, EM countries’ fiscal balances are generally strong, and their bonds offer attractive relative value versus their DM peers. Within DM, we now have a slight Overweight stance on HY bonds due to the recent spread widening. We have also brought our IG corporate bond to a Core holding allocation, driven by still-solid fundamentals and a slight improvement in valuations. Spreads indeed remain tight by historical standards but have room to re-tighten should the Middle East conflict ease as we expect.
Opportunistic ideas: We are bullish (i) European bank AT1 bonds (CoCos1; FX-hedged), (ii) US TIPS, (iii) short-duration US HY bonds and (iv) AAA-rated CLOs. We open two new ideas in (v) US utilities’ corporate hybrids and (vi) AUD corporates.
Key chart
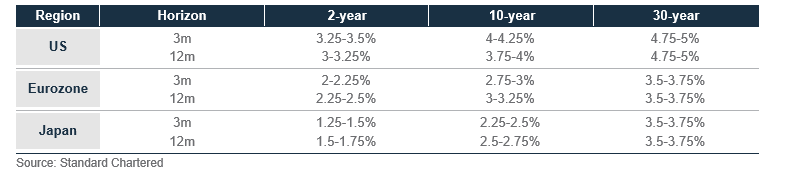
Fig. 11 Summary of rates forecast
Developed Market rates – Underweight
We are Underweight DM IG government bonds. In the US, we expect the term premium (compensation for holding long-duration bonds) to rise on reflation expectations, a growing fiscal burden and concerns over the Fed’s independence. We expect the Fed to cut rates to 3.25% in H2 26, after the resolution of the Middle East conflict. We expect the US curve to bull-steepen as markets start to price for a resumption of Fed rate cuts. We continue to prefer to position around the
belly of the curve (5-7 years) and avoid or underweight the 30-year part of the curve.
Outside of the US, we think higher energy prices will have a greater impact on the Euro area and Japan. As such, the ECB and BoJ may tighten monetary policies, causing their bonds to underperform the US’ (on an FX-hedged basis). In Australia, the RBA hiked rates the second time this year, but the threshold for further hikes has risen as the central bank faces the dilemma of reigning in inflationary pressures and its negative impact on the Australian economy.
Fig. 12 DM IG corp spread widened from extreme tights
Bloomberg Global Agg Corp index, OAS-spread
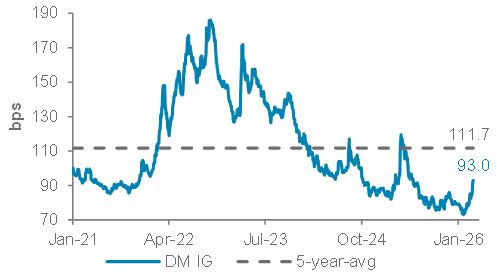
Fig. 13 DM HY corp valuation turns more attractive
Bloomberg Global HY Corp index, OAS-spread
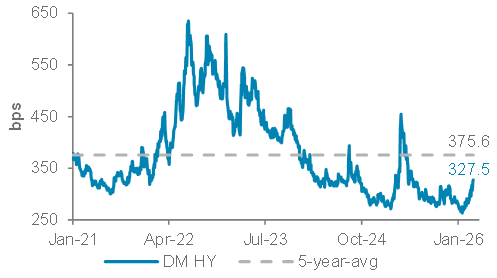
Developed Market corporates – Modest Overweight High Yield bonds
We have shifted to a modest Overweight stance on DM HY corporate bonds, as we see limited spillover risks from private credit. Fundamentals remain supported by expanding earnings, and valuations recently improved with spreads widening from very tight levels. We have a Neutral allocation to DM IG corporate bonds. Valuations have become more attractive following the widening of credit spreads from extremely tight levels. However, in our view, AI capital expenditure (capex)-related supply pressures are likely to remain a longer-term overhang.
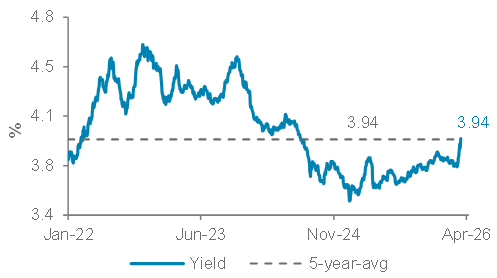
Emerging Market bonds – Overweight
We prefer EM bonds over DM bonds for their attractive yields. We are Overweight both EM USD sovereign bonds and EM LCY government bonds. While some EM assets are susceptible to geopolitical uncertainty, most EM economies have bolstered their fiscal and current accounts in recent years. Their strong external balances and our expectation for a resumption of a weak USD trend should benefit external debt servicing. Additionally, leading EM USD bonds issuers are net oil exporters, which, in our view, should remain resilient, especially after the Middle East conflict concludes and oil exports restart.
Fig. 14 EM USD gov bond spreads remain tight
Bloomberg Global Agg Corp index, OAS-spread
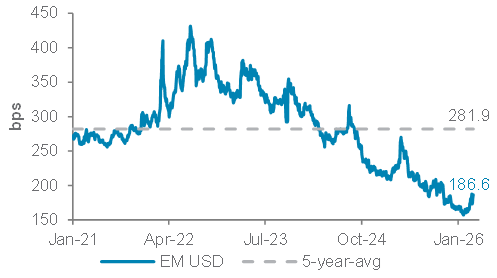
Fig. 15 EM LCY yields returned to five-year average
Bloomberg Global HY Corp index, OAS-spread
Bond opportunistic views
Initiate bullish utilities corporate hybrids
AI capex and related energy demand are poised to continue in the US, benefiting US utilities. While utilities will also need to expand capex, we believe credit fundamentals will remain stable in 2026 as revenues grow. We prefer hybrids over senior bonds for yield enhancement. Hybrids’ non-call risk should remain low, supported by organic cashflows and diversified financing channels.
Initiate bullish AUD corporate bonds
Following two rate hikes, we believe the threshold for further RBA hikes has risen amid higher energy prices’ negative impact on growth. We view AUD yields as attractive, with 1-2 hikes already priced in for 2026.
Bullish US inflation-protected bonds (TIPS)
We believe TIPS offer protection against inflation resulting from fiscal pressure and energy prices. They should benefit from lower yields if the Fed resumes rate cuts in H2 26.
Bullish short-duration US HY bonds
We anticipate HY corporate earnings and cashflows to remain solid in a soft-landing environment.
Bullish EU bank CoCos1 (FX-hedged)
European bank sector fundamentals remain solid, denoted by ample liquidity coverage, strong capital buffers and still-supportive asset quality. We believe contingent convertibles (CoCos) will benefit from the current late-cycle environment.
Bullish AAA-rated CLOs
Private credit spillover concerns are mounting. However, we believe high-quality collateralised loan obligations (CLOs) backed by solid asset portfolio and gaining exposure via rigorous asset manager screening should help navigate the volatility.
Close Asia IG bonds at a return of 0.2% (since inception).
Contingent Convertible (CoCos) are complex financial instruments. Please refer to important disclosures on page 31.
Equity – at a glance
|
|
||||
|
|
||||
Our view
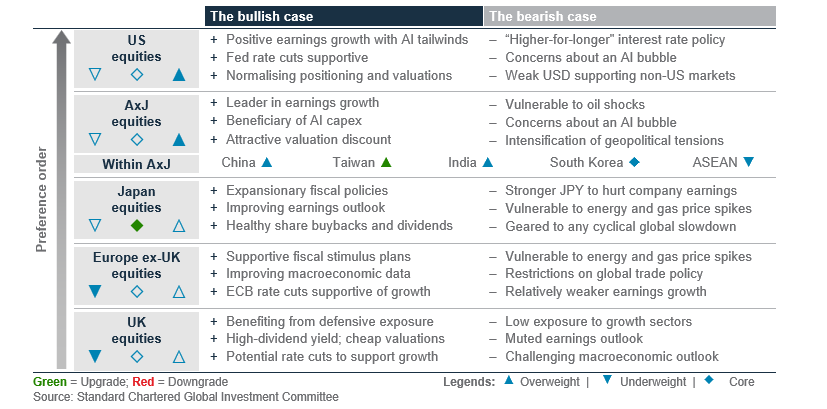
We remain Overweight global equities. While the Middle East conflict is dampening risk sentiment, we expect the conflict to subside in the next 3-4 weeks in our base scenario, allowing investors to refocus on the solid fundamentals for equities. We expect strong earnings growth to drive the market higher, led by our Overweight US and AxJ markets. We expect structural growth in AI capex to sustain US earnings growth and Fed rate cuts in H2 26 to support further growth.
AxJ is also a beneficiary of AI capex, which is likely to drive significant earnings growth in 2026-27. Within AxJ, we upgrade Taiwan to Overweight with semiconductor-driven earnings growth. We remain Overweight China (due to the valuation re-rating potential) and India, which is seeing an improving earnings outlook and more supportive valuations.
We upgrade Japan to a Core allocation, as the Takaichi government’s fiscal plans are improving the country’s growth outlook. We remain Underweight Europe ex-UK and UK equities, which have relatively muted earnings growth.
Key chart
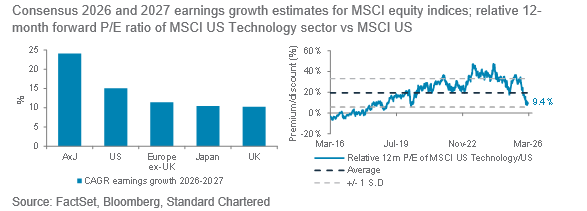
AxJ and US equities are buoyed by AI-driven earnings
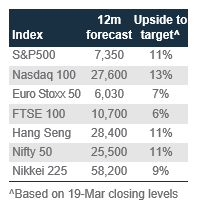
Fig. 16 AxJ and US equities’ forward earnings growth rates are leading other regions’; US tech’s valuation premium has pulled back to a five-year low
US equities – Overweight
We remain Overweight US equities, driven by fundamentally strong earnings growth. AI capex continues to drive strong growth for the US technology sector and the wider economy. We also see some valuation support for the US technology sector now, which is at a five-year low in terms of its P/E valuation premium relative to the broader market. US equities have been outperforming global equities since the Iran conflict began. We expect, when the conflict subsides and risk sentiment improves, the market will refocus on the fundamentals, supporting outperformance of US equities. Furthermore, we anticipate Fed rate cuts later in the year to be supportive of US growth and investor sentiment.
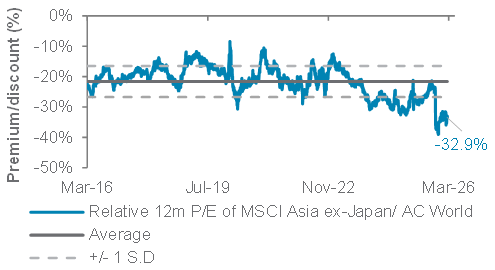
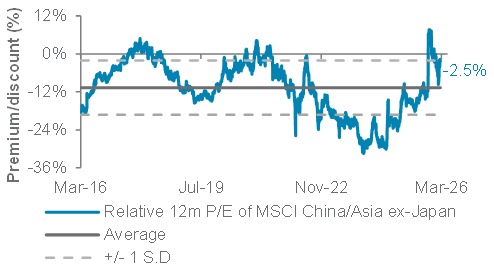
Fig. 17 AxJ equities continue to trade at an attractive valuation discount to global equities
Relative 12-month forward P/E ratio of MSCI Asia ex-Japan vs MSCI AC World
Asia ex-Japan equities – Overweight
We are Overweight AxJ equities, which is expected to have the highest earnings growth in 2026-27 among the major equity markets. AxJ benefits from strong AI capex, with a strong presence in semiconductor manufacturing and memory chips. Despite its outperformance of global equities YTD, AxJ remains at an attractive valuation discount versus global equities. The region also historically performs well in a weak USD environment. While the USD has strengthened since the start of the Middle East conflict, we expect a weaker USD over the next 12 months, which would be a tailwind for AxJ equities.
Within AxJ, we remain Overweight China. We continue to see an attractive valuation re-rating potential as tech innovation in China keeps up with AI developments. We also expect ongoing policy support after the country set a 4.5-5.0% GDP growth target for 2026. Policy initiatives are lifting asset returns for state-owned enterprises (SOEs) and encouraging higher dividends or share buybacks.
We remain Overweight India within AxJ. Valuations should provide some support as the 12-month forward P/E ratio of 19x is now below its five-year average (20x). Following reasonable results in the last earnings season, we expect the earnings trajectory to improve. The oil price spike caused by the Middle
East conflict presents near-term headwinds to the India economy. However, we see the India equity market being driven by earnings and GDP growth over the mid-to-long term, and we see resilient growth supporting the equity market higher.
We upgrade Taiwan to Overweight, as the market is benefiting from strong earnings growth, driven by its strong capabilities in semiconductor manufacturing. Korea equities remain a core holding for us. Although we are also positive on earnings growth in Korea driven by its memory chips industry, its significant outperformance YTD is vulnerable to profit-taking.
Fig. 18 China equities have scope for attractive valuation re-rating amid tech innovation and AI developments
Relative 12-month forward P/E ratio of MSCI China vs. MSCI Asia ex-Japan
We are Underweight ASEAN on a weak earnings per share (EPS) momentum. The region lacks exposure to the technology sector, which we believe would cause it to lag the tech-heavy AxJ market.
Japan equities – Core holding
We upgrade Japan equities to a Neutral allocation. The Takaichi government is set to accelerate both growth investment and crisis-management investment, which could improve the growth outlook for Japan. We expect the cyclical recovery to benefit Japan and foreign investors to continue to have an Underweight allocation to Japan equities.
Europe ex-UK equities – Underweight
We remain Underweight Europe ex-UK equities. The economy is sensitive to energy and gas price spikes, which could weigh on growth. It also has more muted earnings growth compared to our preferred markets of the US and AxJ.
UK equities – Underweight
We are Underweight UK equities. Its defensive composition is likely to underperform the more growth-oriented regions, such as the US and AxJ. The weaker UK economy and rising unemployment are also likely to weigh on the GBP, making returns less attractive for USD-based investors.
Equity opportunistic views
|
|
||||
|
|
||||
Add buyback and semiconductor ideas
- We initiate an opportunistic idea on the global ex-US buyback theme. Firms with disciplined capital allocation and a strong commitment to shareholder returns are set to outperform amid heightened market volatility. The theme is concentrated in financials and energy, benefiting from strong capital and cash-generating businesses.
- We also initiate an opportunistic idea on global semiconductors, following the closure of the US technology idea (loss of 7.5% from 6 November 2025 to 19 March 2026). We expect semiconductor stocks to outperform within tech, supported by robust capex from major hyperscalers and sustained memory chip demand.
- We take profit on US pharmaceuticals, locking in a gain of 14.3% (30 October 2025 to 19 March 2026). We also close our India large- and mid-cap idea (loss of 9.6% from 11 December 2025 to 19 March 2026). While India remains a preferred market within Asia ex-Japan, we trim the degree of favourability as energy cost concerns weigh on near-term sentiment.
Fig. 19 Opportunistic ideas
Ongoing ideas
US utilities: The recent consolidation presents an opportunity to add exposure, despite strong performance in 2026. The sector is a key beneficiary of accelerating capex and rising power demand driven by AI‑related data centre growth. We remain positive on its defensive earnings profile, while lower power prices pose a risk.
US aerospace and defence: Elevated geopolitical tensions are supporting demand for military production, particularly ahead of the November US mid‑term elections, as President Trump is likely to pursue political objectives through foreign policies. De‑escalation in Middle East tensions is a risk.
European banks: Solid Q4 2025 results, alongside a less dovish ECB stance and rising inflation concerns amid higher energy
prices, should support net interest income growth. The sector’s 12‑month forward EPS growth of 7.3% underpins further upside potential. Economic slowdown is a risk.
China non-financial, high-dividend SOEs: Their predominantly domestic exposure positions them to benefit directly from government stimulus. Potential corporate reforms to raise dividend payout ratios are attractive, while non-financial SOEs are less exposed to the stressed property sector. Muted policy support is a risk.
Hang Seng Technology: Tech innovation remains a key priority under China’s 15th Five-year Plan. Potential IPO activity should support investor sentiment, while valuations are reasonable. Adverse regulatory changes are risks.
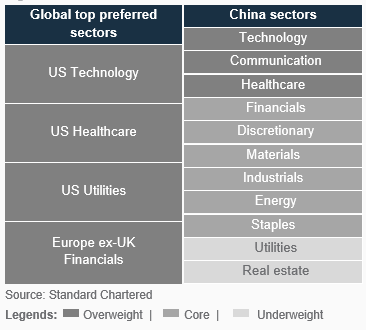
Sector views: A barbell approach
We are evolving our sector views to provide our top preferred sectors globally now. Meanwhile, we continue to provide sector views for China.
We maintain a barbell strategy that balances growth exposure to US technology along with defensive exposure to US healthcare and US utilities. A structural AI theme propels growth in technology, especially within the semiconductor industry. Defensive characteristics across healthcare and utilities enhance portfolio resilience amid macroeconomic volatility. We are also Overweight Europe ex-UK financials, which offer strong balance sheets and earnings growth.
Similarly in China, we adopt a barbell approach with growth exposure to technology and communication and defensive exposure to healthcare.
Fig. 20 Our sector views
Gold, crude oil – at a glance
|
Our view
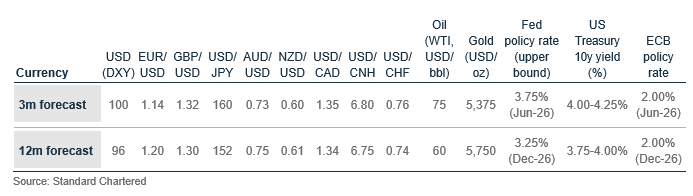
We are Overweight gold and raise our 3- and 12-month gold price targets to USD 5,375/oz and USD 5,750/oz, respectively.
We raise our three-month forecast of WTI oil to USD 75/bbl. Current Middle East disruptions present near-term upside risks to oil prices. However, our base case scenario means prices should ultimately return to a lower range long-term.
Key chart
Fig. 21 Historically, gold’s initial liquidity-driven sell-off during volatility is followed by a strong sustained rally
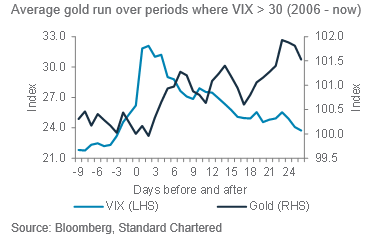
Fig. 23 Strait of Hormuz flows highlight Asia’s reliance on Gulf crude
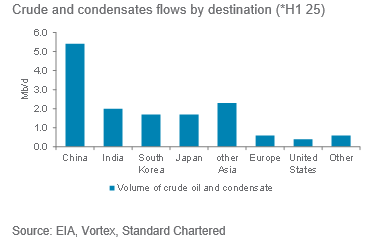
Fig. 22 Money managers’ gold positioning turns bearish amid search for liquidity
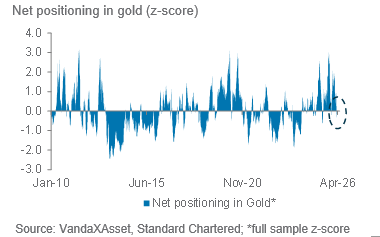
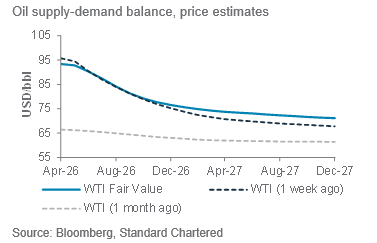
Fig. 24 WTI oil futures indicate near-term tight supplies, but prices are expect to fall by H2 as the conflict eases
Gold outlook: While gold initially benefited from a flight to safety, prices have recently pulled back. This downside is not unusual; during periods of heightened market stress, gold often faces initial pressure as investors seek cash. We expect near-term volatility to persist as the conflict continues and liquidity needs remain. However, the structural factors underpinning our long-term view remain intact, and once the initial derisking phase passes, we expect gold to resume its uptrend.
Oil outlook: Both the International Energy Agency (IEA) and the Energy Information Administration (EIA) highlight at least 10 million barrels per day (Mb/d) of Gulf supply disruptions, driven primarily by ~8Mb/d in Hormuz crude transit disruptions alongside ~3Mb/d in refining outages, against a pre-conflict surplus of ~2Mb/d. In our base case scenario, these disruptions should be temporary. The long term focus is expected to return to an excess supply picture, consistent with the futures curve pricing a decline in oil prices in H2 26.
FX – at a glance
|
|
||||
Our view
We have revised our three-month forecast for the DXY, raising it from 96 to 100 to reflect increased demand for the USD amid heightened global uncertainty. The recent Middle East escalation has significantly intensified geopolitical risks, prompting investors to seek safe-haven assets. The disruptions in energy markets and mounting concerns about economic stability have strengthened the USD’s position and contributed to a more cautious global outlook. Meanwhile, the USD is benefiting from improved terms of trade because of higher oil prices. Although US economic data has softened, the Middle East conflict has exerted a more pronounced influence on markets in the near term. Considering these developments, market expectations for Fed rate cuts have now been postponed.
However, we continue to anticipate a resumption of USD weakness over a 12-month horizon, with the DXY expected to return towards 96. We believe the USD will depreciate once tensions surrounding the Middle East conflict ease, as it is unlikely to be prolonged. The fundamental factors that have underpinned USD strength in recent years, such as robust US economic performance and higher real interest rates, have been gradually fading. Risks to our outlook include the possibility of a renewed spike in inflation, a more hawkish Fed or additional geopolitical shocks that could once again drive demand for the USD.
Key charts
Fig. 25 USD rebounded amid Middle East conflict, but narrowing interest rate differentials likely to drive downside risk on a 12-month-forward basis
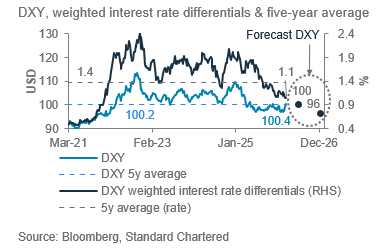
Fig. 27 AUD well-supported by CNH
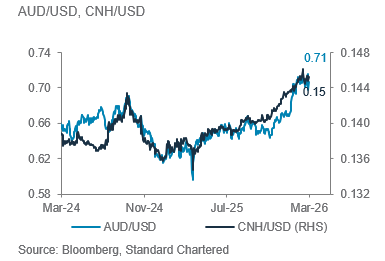
Fig. 26 RBA likely to outpace most central banks in magnitude of rate hikes, supporting AUD
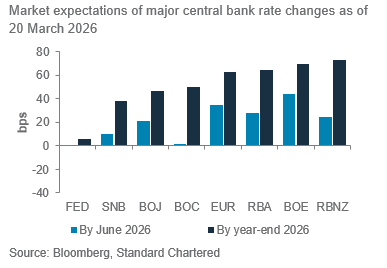
Fig. 28 USD/JPY upside likely capped at 160 due to intervention risk
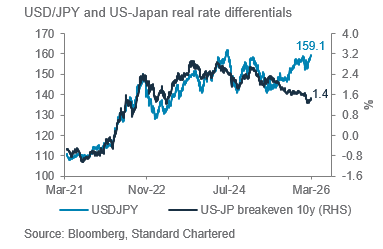
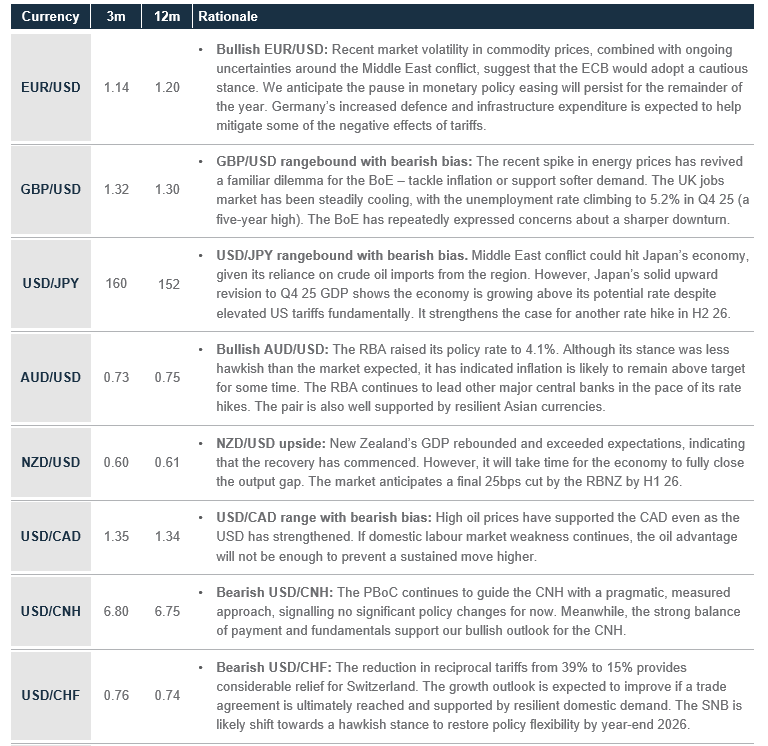
Fig. 38 Summary of currency forecasts and drivers
Additional perspectives
Quant perspective
Bullish equities over both short and long term
|
|
||||
Summary
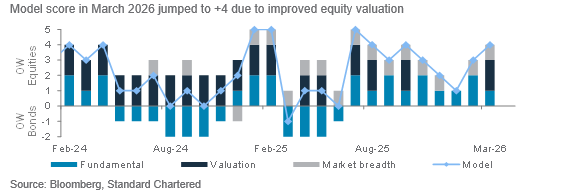
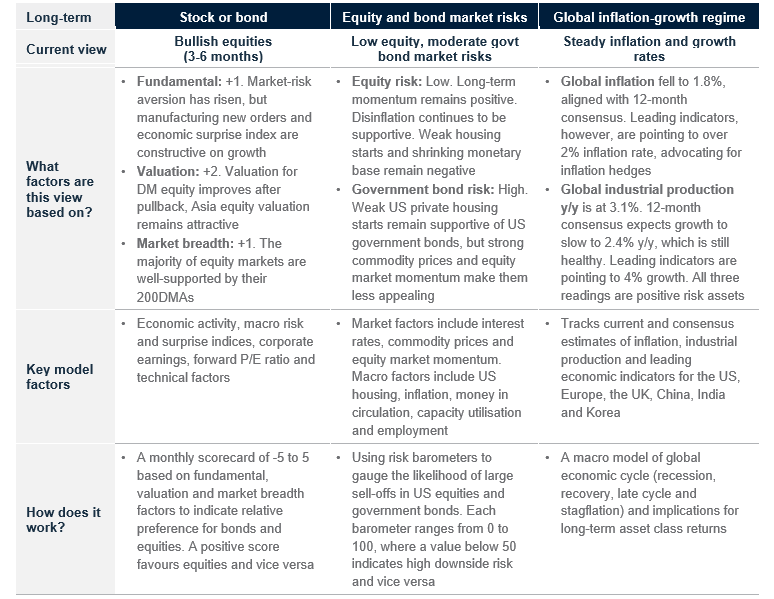
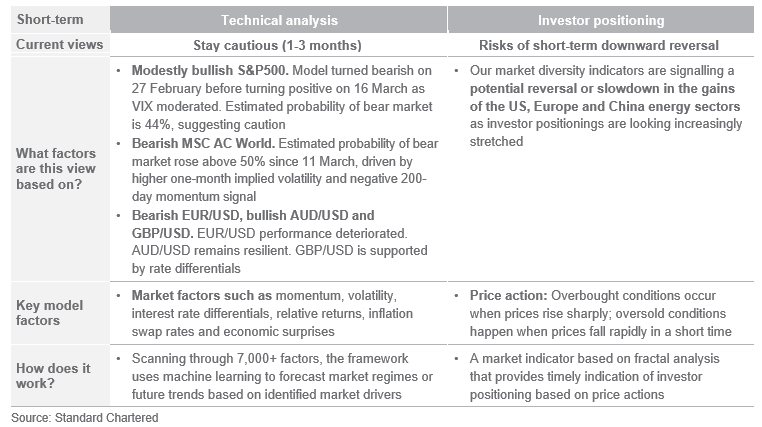
Our stock-bond model (3-6-month view) has increased its Overweight allocation to global equities in March, as the model score rose to +4 (from +3 previously). The valuation score jumped from 0 to +2 as DM equity valuation improved after a recent pullback. Fundamental factors remain supportive of equities as PMI, new orders and the Economic Surprise index are positive. Market technicals are little changed. Net advances in stocks have fallen and are far from signalling stretched positioning, but the majority of equity markets are still well-supported by their 200-day moving averages (DMA).
Our short-term equity models (1-3-month view) are more cautious. Our models were bearish on S&P500 (most of 27 February-19 March) and MSCI AC World since 11 March. The estimated bear market probabilities for both indices exceeded 50% during these periods as several risk indicators, including the volatility index (VIX), rose sharply amid the Middle East conflict. Current estimated bear market probabilities for S&P500 and MSCI AC World have moderated to 44% and 57% but continue to indicate significant risks. For investors seeking to buy the dip, it would be wise to perform dollar-cost averaging to reduce volatility. Risk avoidance has enabled the S&P500 and MSCI AC World models to outperform buy-and-hold by 1.1% and 1.6% YTD.
Our long- and short-term models are inherently reflecting our expectations of a short-lived Middle East conflict, where we see a 70% chance of the conflict to last 3-4 weeks, not months. Near-term market volatility will likely remain elevated as oil prices have risen above USD 100/bbl and the Fed raised its inflation expectation for 2026. Meanwhile, our market diversity indicators are currently flagging stretched investor positioning in US, Europe and China energy sectors. The energy sectors have gained more than 25% YTD, boosted by the conflict. Meanwhile, MSCI AC World recorded -1.6%.
Key chart
Our stock-bond model increased its Overweight allocation to equity in March. The model score rose to +4 from +1 as DM equity valuation improved after a recent pullback
Fig. 30 Breakdown of our stock-bond rotation model’s scores
Short-term models are cautious on both US and MSCI AC World. Significant risks remain as VIX is elevated and could rise quickly, depending on the ongoing Middle East conflict
Fig. 31 Our technical model is cautious on S&P500
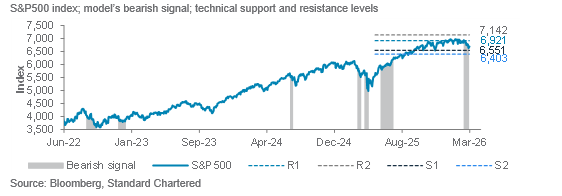
Fig. 32 Long- and short-term quantitative models remain bullish risk assets
Long-term models below have a typical time horizon of 3-6 months, while short-term models have a 1-3-month horizon
Performance review
Foundation: Asset allocation summary
Foundation+: Asset allocation summary
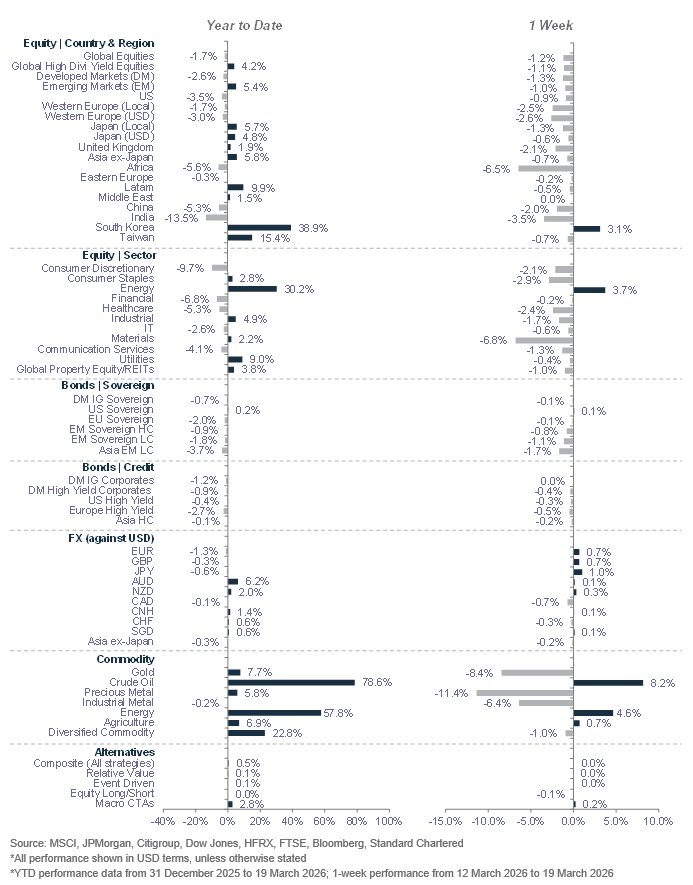
Market performance summary
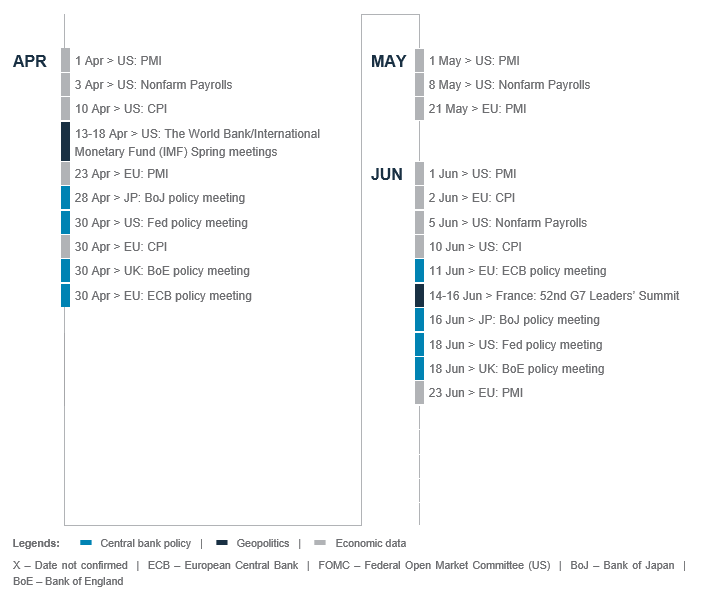
Our key forecasts and calendar events
SC Wealth Select

Explanatory notes
- The figures on page 5 show allocations for a moderately aggressive risk profile only – different risk profiles may produce significantly different asset allocation results. Page 5 is only an example, provided for general information only and they do not constitute investment advice, an offer, recommendation or solicitation. They do not take into account the specific investment objectives, needs or risk tolerances of a particular person or class of persons and they have not been prepared for any particular person or class of persons.
- Contingent Convertibles are complex financial instruments and are not a suitable or appropriate investment for all investors. This document is not an offer to sell or an invitation to buy any securities or any beneficial interests therein. Contingent convertible securities are not intended to be sold and should not be sold to retail clients in the European Economic Area (EEA) (each as defined in the Policy Statement on the Restrictions on the Retail Distribution of Regulatory Capital Instruments (Feedback to CP14/23 and Final Rules) (“Policy Statement”), read together with the Product Intervention (Contingent Convertible Instruments and Mutual Society Shares) Instrument 2015 (“Instrument”, and together with the Policy Statement, the “Permanent Marketing Restrictions”), which were published by the United Kingdom’s Financial Conduct Authority in June 2015), other than in circumstances that do not give rise to a contravention of the Permanent Marketing Restrictions.
Disclosure
This document is confidential and may also be privileged. If you are not the intended recipient, please destroy all copies and notify the sender immediately. This document is being distributed for general information only and is subject to the relevant disclaimers available at our Standard Chartered website under Regulatory disclosures. It is not and does not constitute research material, independent research, an offer, recommendation or solicitation to enter into any transaction or adopt any hedging, trading or investment strategy, in relation to any securities or other financial instruments. This document is for general evaluation only. It does not take into account the specific investment objectives, financial situation or particular needs of any particular person or class of persons and it has not been prepared for any particular person or class of persons. You should not rely on any contents of this document in making any investment decisions. Before making any investment, you should carefully read the relevant offering documents and seek independent legal, tax and regulatory advice. In particular, we recommend you to seek advice regarding the suitability of the investment product, taking into account your specific investment objectives, financial situation or particular needs, before you make a commitment to purchase the investment product. Opinions, projections and estimates are solely those of SC at the date of this document and subject to change without notice. Past performance is not indicative of future results and no representation or warranty is made regarding future performance. The value of investments, and the income from them, can go down as well as up, and you may not recover the amount of your original investment. You are not certain to make a profit and may lose money. Any forecast contained herein as to likely future movements in rates or prices or likely future events or occurrences constitutes an opinion only and is not indicative of actual future movements in rates or prices or actual future events or occurrences (as the case may be). This document must not be forwarded or otherwise made available to any other person without the express written consent of the Standard Chartered Group (as defined below). Standard Chartered Bank is incorporated in England with limited liability by Royal Charter 1853 Reference Number ZC18. The Principal Office of the Company is situated in England at 1 Basinghall Avenue, London, EC2V 5DD. Standard Chartered Bank is authorised by the Prudential Regulation Authority and regulated by the Financial Conduct Authority and Prudential Regulation Authority. Standard Chartered PLC, the ultimate parent company of Standard Chartered Bank, together with its subsidiaries and affiliates (including each branch or representative office), form the Standard Chartered Group. Standard Chartered Private Bank is the private banking division of Standard Chartered. Private banking activities may be carried out internationally by different legal entities and affiliates within the Standard Chartered Group (each an “SC Group Entity”) according to local regulatory requirements. Not all products and services are provided by all branches, subsidiaries and affiliates within the Standard Chartered Group. Some of the SC Group Entities only act as representatives of Standard Chartered Private Bank and may not be able to offer products and services or offer advice to clients.
Copyright © 2026, Accounting Research & Analytics, LLC d/b/a CFRA (and its affiliates, as applicable). Reproduction of content provided by CFRA in any form is prohibited except with the prior written permission of CFRA. CFRA content is not investment advice and a reference to or observation concerning a security or investment provided in the CFRA SERVICES is not a recommendation to buy, sell or hold such investment or security or make any other investment decisions. The CFRA content contains opinions of CFRA based upon publicly-available information that CFRA believes to be reliable and the opinions are subject to change without notice. This analysis has not been submitted to, nor received approval from, the United States Securities and Exchange Commission or any other regulatory body. While CFRA exercised due care in compiling this analysis, CFRA, ITS THIRD-PARTY SUPPLIERS, AND ALL RELATED ENTITIES SPECIFICALLY DISCLAIM ALL WARRANTIES, EXPRESS OR IMPLIED, INCLUDING, BUT NOT LIMITED TO, ANY WARRANTIES OF MERCHANTABILITY OR FITNESS FOR A PARTICULAR PURPOSE OR USE, to the full extent permitted by law, regarding the accuracy, completeness, or usefulness of this information and assumes no liability with respect to the consequences of relying on this information for investment or other purposes. No content provided by CFRA (including ratings, credit-related analyses and data, valuations, model, software or other application or output therefrom) or any part thereof may be modified, reverse engineered, reproduced or distributed in any form by any means, or stored in a database or retrieval system, without the prior written permission of CFRA, and such content shall not be used for any unlawful or unauthorized purposes. CFRA and any third-party providers, as well as their directors, officers, shareholders, employees or agents do not guarantee the accuracy, completeness, timeliness or availability of such content. In no event shall CFRA, its affiliates, or their third-party suppliers be liable for any direct, indirect, special, or consequential damages, costs, expenses, legal fees, or losses (including lost income or lost profit and opportunity costs) in connection with a subscriber’s, subscriber’s customer’s, or other’s use of CFRA’s content.
Market Abuse Regulation (MAR) Disclaimer
Banking activities may be carried out internationally by different branches, subsidiaries and affiliates within the Standard Chartered Group according to local regulatory requirements. Opinions may contain outright “buy”, “sell”, “hold” or other opinions. The time horizon of this opinion is dependent on prevailing market conditions and there is no planned frequency for updates to the opinion. This opinion is not independent of Standard Chartered Group’s trading strategies or positions. Standard Chartered Group and/or its affiliates or its respective officers, directors, employee benefit programmes or employees, including persons involved in the preparation or issuance of this document may at any time, to the extent permitted by applicable law and/or regulation, be long or short any securities or financial instruments referred to in this document or have material interest in any such securities or related investments. Therefore, it is possible, and you should assume, that Standard Chartered Group has a material interest in one or more of the financial instruments mentioned herein. Please refer to our Standard Chartered website under Regulatory disclosures for more detailed disclosures, including past opinions/ recommendations in the last 12 months and conflict of interests, as well as disclaimers. A covering strategist may have a financial interest in the debt or equity securities of this company/issuer. All covering strategist are licensed to provide investment recommendations under Monetary Authority of Singapore or Hong Kong Monetary Authority. This document must not be forwarded or otherwise made available to any other person without the express written consent of Standard Chartered Group.
Sustainable Investments
Any ESG data used or referred to has been provided by Morningstar, Sustainalytics, MSCI or Bloomberg. Refer to 1) Morningstar website under Sustainable Investing, 2) Sustainalytics website under ESG Risk Ratings, 3) MCSI website under ESG Business Involvement Screening Research and 4) Bloomberg green, social & sustainability bonds guide for more information. The ESG data is as at the date of publication based on data provided, is for informational purpose only and is not warranted to be complete, timely, accurate or suitable for a particular purpose, and it may be subject to change. Sustainable Investments (SI): This refers to funds that have been classified as ‘ESG Intentional Investments – Overall’ by Morningstar. SI funds have explicitly stated in their prospectus and regulatory filings that they either incorporate ESG factors into the investment process or have a thematic focus on the environment, gender diversity, low carbon, renewable energy, water or community development. For equity, it refers to shares/stocks issued by companies with Sustainalytics ESG Risk Rating of Low/Negligible. For bonds, it refers to debt instruments issued by issuers with Sustainalytics ESG Risk Rating of Low/Negligible, and/or those being certified green, social, sustainable bonds by Bloomberg. For structured products, it refers to products that are issued by any issuer who has a Sustainable Finance framework that aligns with Standard Chartered’s Green and Sustainable Product Framework, with underlying assets that are part of the Sustainable Investment universe or separately approved by Standard Chartered’s Sustainable Finance Governance Committee. Sustainalytics ESG risk ratings shown are factual and are not an indicator that the product is classified or marketed as “green”, “sustainable” or similar under any particular classification system or framework.
Country/Market Specific Disclosures
Bahrain: This document is being distributed in Bahrain by Standard Chartered Bank, Bahrain Branch, having its address at P.O. 29, Manama, Kingdom of Bahrain, is a branch of Standard Chartered Bank and is licensed by the Central Bank of Bahrain as a conventional retail bank. Botswana: This document is being distributed in Botswana by, and is attributable to, Standard Chartered Bank Botswana Limited which is a financial institution licensed under the Section 6 of the Banking Act CAP 46.04 and is listed in the Botswana Stock Exchange. Brunei Darussalam: This document is being distributed in Brunei Darussalam by, and is attributable to, Standard Chartered Bank (Brunei Branch) | Registration Number RFC/61 and Standard Chartered Securities (B) Sdn Bhd | Registration Number RC20001003. Standard Chartered Bank is incorporated in England with limited liability by Royal Charter 1853 Reference Number ZC18. Standard Chartered Securities (B) Sdn Bhd is a limited liability company registered with the Registry of Companies with Registration Number RC20001003 and licensed by Brunei Darussalam Central Bank as a Capital Markets Service License Holder with License Number BDCB/R/CMU/S3-CL and it is authorised to conduct Islamic investment business through an Islamic window. China Mainland: This document is being distributed in China by, and is attributable to, Standard Chartered Bank (China) Limited which is mainly regulated by National Financial Regulatory Administration (NFRA), State Administration of Foreign Exchange (SAFE), and People’s Bank of China (PBOC). Hong Kong: In Hong Kong, this document, except for any portion advising on or facilitating any decision on futures contracts trading, is distributed by Standard Chartered Bank (Hong Kong) Limited (“SCBHK”), a subsidiary of Standard Chartered PLC. SCBHK has its registered address at 32/F, Standard Chartered Bank Building, 4-4A Des Voeux Road Central, Hong Kong and is regulated by the Hong Kong Monetary Authority and registered with the Securities and Futures Commission (“SFC”) to carry on Type 1 (dealing in securities), Type 4 (advising on securities), Type 6 (advising on corporate finance) and Type 9 (asset management) regulated activity under the Securities and Futures Ordinance (Cap. 571) (“SFO”) (CE No. AJI614). The contents of this document have not been reviewed by any regulatory authority in Hong Kong and you are advised to exercise caution in relation to any offer set out herein. If you are in doubt about any of the contents of this document, you should obtain independent professional advice. Any product named herein may not be offered or sold in Hong Kong by means of any document at any time other than to “professional investors” as defined in the SFO and any rules made under that ordinance. In addition, this document may not be issued or possessed for the purposes of issue, whether in Hong Kong or elsewhere, and any interests may not be disposed of, to any person unless such person is outside Hong Kong or is a “professional investor” as defined in the SFO and any rules made under that ordinance, or as otherwise may be permitted by that ordinance. In Hong Kong, Standard Chartered Private Bank is the private banking division of SCBHK, a subsidiary of Standard Chartered PLC. Ghana: Standard Chartered Bank Ghana Limited accepts no liability and will not be liable for any loss or damage arising directly or indirectly (including special, incidental or consequential loss or damage) from your use of these documents. Past performance is not indicative of future results and no representation or warranty is made regarding future performance. You should seek advice from a financial adviser on the suitability of an investment for you, taking into account these factors before making a commitment to invest in an investment. To unsubscribe from receiving further updates, please send an email to feedback.ghana@sc.com. Please do not reply to this email. Call our Priority Banking on 0302610750 for any questions or service queries. You are advised not to send any confidential and/or important information to Standard Chartered via e-mail, as Standard Chartered makes no representations or warranties as to the security or accuracy of any information transmitted via e-mail. Standard Chartered shall not be responsible for any loss or damage suffered by you arising from your decision to use e-mail to communicate with the Bank. India: This document is being distributed in India by Standard Chartered in its capacity as a distributor of mutual funds and referrer of any other third party financial products. Standard Chartered does not offer any ‘Investment Advice’ as defined in the Securities and Exchange Board of India (Investment Advisers) Regulations, 2013 or otherwise. Services/products related securities business offered by Standard Charted are not intended for any person, who is a resident of any jurisdiction, the laws of which imposes prohibition on soliciting the securities business in that jurisdiction without going through the registration requirements and/or prohibit the use of any information contained in this document. Indonesia: This document is being distributed in Indonesia by Standard Chartered Bank, Indonesia branch, which is a financial institution licensed and supervised by Otoritas Jasa Keuangan (Financial Service Authority) and Bank Indonesia. Jersey: In Jersey, Standard Chartered Private Bank is the Registered Business Name of the Jersey Branch of Standard Chartered Bank. The Jersey Branch of Standard Chartered Bank is regulated by the Jersey Financial Services Commission. Copies of the latest audited accounts of Standard Chartered Bank are available from its principal place of business in Jersey: PO Box 80, 15 Castle Street, St Helier, Jersey JE4 8PT. Standard Chartered Bank is incorporated in England with limited liability by Royal Charter in 1853 Reference Number ZC 18. The Principal Office of the Company is situated in England at 1 Basinghall Avenue, London, EC2V 5DD. Standard Chartered Bank is authorised by the Prudential Regulation Authority and regulated by the Financial Conduct Authority and Prudential Regulation Authority. The Jersey Branch of Standard Chartered Bank is also an authorised financial services provider under license number 44946 issued by the Financial Sector Conduct Authority of the Republic of South Africa. Jersey is not part of the United Kingdom and all business transacted with Standard Chartered Bank, Jersey Branch and other SC Group Entity outside of the United Kingdom, are not subject to some or any of the investor protection and compensation schemes available under United Kingdom law. Kenya: This document is being distributed in Kenya by and is attributable to Standard Chartered Bank Kenya Limited. Investment Products and Services are distributed by Standard Chartered Investment Services Limited, a wholly owned subsidiary of Standard Chartered Bank Kenya Limited that is licensed by the Capital Markets Authority in Kenya, as a Fund Manager. Standard Chartered Bank Kenya Limited is regulated by the Central Bank of Kenya. Malaysia: This document is being distributed in Malaysia by Standard Chartered Bank Malaysia Berhad (“SCBMB”). Recipients in Malaysia should contact SCBMB in relation to any matters arising from, or in connection with, this document. This document has not been reviewed by the Securities Commission Malaysia. The product lodgement, registration, submission or approval by the Securities Commission of Malaysia does not amount to nor indicate recommendation or endorsement of the product, service or promotional activity. Investment products are not deposits and are not obligations of, not guaranteed by, and not protected by SCBMB or any of the affiliates or subsidiaries, or by Perbadanan Insurans Deposit Malaysia, any government or insurance agency. Investment products are subject to investment risks, including the possible loss of the principal amount invested. SCBMB expressly disclaim any liability and responsibility for any loss arising directly or indirectly (including special, incidental or consequential loss or damage) arising from the financial losses of the Investment Products due to market condition. Nigeria: This document is being distributed in Nigeria by Standard Chartered Bank Nigeria Limited (SCB Nigeria), a bank duly licensed and regulated by the Central Bank of Nigeria. SCB Nigeria accepts no liability for any loss or damage arising directly or indirectly (including special, incidental or consequential loss or damage) from your use of these documents. You should seek advice from a financial adviser on the suitability of an investment for you, taking into account these factors before making a commitment to invest in an investment. To unsubscribe from receiving further updates, please send an email to clientcare.ng@sc.com requesting to be removed from our mailing list. Please do not reply to this email. Call our Priority Banking on 02 012772514 for any questions or service queries. SCB Nigeria shall not be responsible for any loss or damage arising from your decision to send confidential and/or important information to Standard Chartered via e-mail. SCB Nigeria makes no representations or warranties as to the security or accuracy of any information transmitted via e-mail. Pakistan: This document is being distributed in Pakistan by, and attributable to Standard Chartered Bank (Pakistan) Limited having its registered office at PO Box 5556, I.I Chundrigar Road Karachi, which is a banking company registered with State Bank of Pakistan under Banking Companies Ordinance 1962 and is also having licensed issued by Securities & Exchange Commission of Pakistan for Security Advisors. Standard Chartered Bank (Pakistan) Limited acts as a distributor of mutual funds and referrer of other third-party financial products. Singapore: This document is being distributed in Singapore by, and is attributable to, Standard Chartered Bank (Singapore) Limited (Registration No. 201224747C/ GST Group Registration No. MR-8500053-0, “SCBSL”). Recipients in Singapore should contact SCBSL in relation to any matters arising from, or in connection with, this document. SCBSL is an indirect wholly owned subsidiary of Standard Chartered Bank and is licensed to conduct banking business in Singapore under the Singapore Banking Act, 1970. Standard Chartered Private Bank is the private banking division of SCBSL. IN RELATION TO ANY SECURITY OR SECURITIES-BASED DERIVATIVES CONTRACT REFERRED TO IN THIS DOCUMENT, THIS DOCUMENT, TOGETHER WITH THE ISSUER DOCUMENTATION, SHALL BE DEEMED AN INFORMATION MEMORANDUM (AS DEFINED IN SECTION 275 OF THE SECURITIES AND FUTURES ACT, 2001 (“SFA”)). THIS DOCUMENT IS INTENDED FOR DISTRIBUTION TO ACCREDITED INVESTORS, AS DEFINED IN SECTION 4A(1)(a) OF THE SFA, OR ON THE BASIS THAT THE SECURITY OR SECURITIES-BASED DERIVATIVES CONTRACT MAY ONLY BE ACQUIRED AT A CONSIDERATION OF NOT LESS THAN S$200,000 (OR ITS EQUIVALENT IN A FOREIGN CURRENCY) FOR EACH TRANSACTION. Further, in relation to any security or securities-based derivatives contract, neither this document nor the Issuer Documentation has been registered as a prospectus with the Monetary Authority of Singapore under the SFA. Accordingly, this document and any other document or material in connection with the offer or sale, or invitation for subscription or purchase, of the product may not be circulated or distributed, nor may the product be offered or sold, or be made the subject of an invitation for subscription or purchase, whether directly or indirectly, to persons other than a relevant person pursuant to section 275(1) of the SFA, or any person pursuant to section 275(1A) of the SFA, and in accordance with the conditions specified in section 275 of the SFA, or pursuant to, and in accordance with the conditions of, any other applicable provision of the SFA. In relation to any collective investment schemes referred to in this document, this document is for general information purposes only and is not an offering document or prospectus (as defined in the SFA). This document is not, nor is it intended to be (i) an offer or solicitation of an offer to buy or sell any capital markets product; or (ii) an advertisement of an offer or intended offer of any capital markets product. Deposit Insurance Scheme: Singapore dollar deposits of non-bank depositors are insured by the Singapore Deposit Insurance Corporation, for up to S$100,000 in aggregate per depositor per Scheme member by law. Foreign currency deposits, dual currency investments, structured deposits and other investment products are not insured. This advertisement has not been reviewed by the Monetary Authority of Singapore. Taiwan: SC Group Entity or Standard Chartered Bank (Taiwan) Limited (“SCB (Taiwan)”) may be involved in the financial instruments contained herein or other related financial instruments. The author of this document may have discussed the information contained herein with other employees or agents of SC or SCB (Taiwan). The author and the above-mentioned employees of SC or SCB (Taiwan) may have taken related actions in respect of the information involved (including communication with customers of SC or SCB (Taiwan) as to the information contained herein). The opinions contained in this document may change, or differ from the opinions of employees of SC or SCB (Taiwan). SC and SCB (Taiwan) will not provide any notice of any changes to or differences between the above-mentioned opinions. This document may cover companies with which SC or SCB (Taiwan) seeks to do business at times and issuers of financial instruments. Therefore, investors should understand that the information contained herein may serve as specific purposes as a result of conflict of interests of SC or SCB (Taiwan). SC, SCB (Taiwan), the employees (including those who have discussions with the author) or customers of SC or SCB (Taiwan) may have an interest in the products, related financial instruments or related derivative financial products contained herein; invest in those products at various prices and on different market conditions; have different or conflicting interests in those products. The potential impacts include market makers’ related activities, such as dealing, investment, acting as agents, or performing financial or consulting services in relation to any of the products referred to in this document. UAE: DIFC – Standard Chartered Bank is incorporated in England with limited liability by Royal Charter 1853 Reference Number ZC18.The Principal Office of the Company is situated in England at 1 Basinghall Avenue, London, EC2V 5DD. Standard Chartered Bank is authorised by the Prudential Regulation Authority and regulated by the Financial Conduct Authority and Prudential Regulation Authority. Standard Chartered Bank, Dubai International Financial Centre having its offices at Dubai International Financial Centre, Building 1, Gate Precinct, P.O. Box 999, Dubai, UAE is a branch of Standard Chartered Bank and is regulated by the Dubai Financial Services Authority (“DFSA”). This document is intended for use only by Professional Clients and is not directed at Retail Clients as defined by the DFSA Rulebook. In the DIFC we are authorised to provide financial services only to clients who qualify as Professional Clients and Market Counterparties and not to Retail Clients. As a Professional Client you will not be given the higher retail client protection and compensation rights and if you use your right to be classified as a Retail Client we will be unable to provide financial services and products to you as we do not hold the required license to undertake such activities. For Islamic transactions, we are acting under the supervision of our Shariah Supervisory Committee. Relevant information on our Shariah Supervisory Committee is currently available on the Standard Chartered Bank website in the Islamic banking section. For residents of the UAE – Standard Chartered UAE (“SC UAE”) is licensed by the Central Bank of the U.A.E. SC UAE is licensed by Securities and Commodities Authority to practice Promotion Activity. SC UAE does not provide financial analysis or consultation services in or into the UAE within the meaning of UAE Securities and Commodities Authority Decision No. 48/r of 2008 concerning financial consultation and financial analysis. Uganda: Our Investment products and services are distributed by Standard Chartered Bank Uganda Limited, which is licensed by the Capital Markets Authority as an investment adviser. United Kingdom: In the UK, Standard Chartered Bank is authorised by the Prudential Regulation Authority and regulated by the Financial Conduct Authority and Prudential Regulation Authority. This communication has been approved by Standard Chartered Bank for the purposes of Section 21 (2) (b) of the United Kingdom’s Financial Services and Markets Act 2000 (“FSMA”) as amended in 2010 and 2012 only. Standard Chartered Bank (trading as Standard Chartered Private Bank) is also an authorised financial services provider (license number 45747) in terms of the South African Financial Advisory and Intermediary Services Act, 2002. The Materials have not been prepared in accordance with UK legal requirements designed to promote the independence of investment research, and that it is not subject to any prohibition on dealing ahead of the dissemination of investment research. Vietnam: This document is being distributed in Vietnam by, and is attributable to, Standard Chartered Bank (Vietnam) Limited which is mainly regulated by State Bank of Vietnam (SBV). Recipients in Vietnam should contact Standard Chartered Bank (Vietnam) Limited for any queries regarding any content of this document. Zambia: This document is distributed by Standard Chartered Bank Zambia Plc, a company incorporated in Zambia and registered as a commercial bank and licensed by the Bank of Zambia under the Banking and Financial Services Act Chapter 387 of the Laws of Zambia.