

1 November 2024
Global Market Outlook
Global Market Outlook
Balancing election risks with soft-landing prospects
Financial markets have thus far been unfazed by US election risks. We continue to believe elections can create opportunities amid short-term volatility, but our soft-landing macro view points to medium-term outperformance of risk assets.
The recent rebound in US government bond yields presents an opportunity to lock in an attractive income as major central banks continue to cut rates, lowering returns on cash. Additionally, we remain Overweight gold relative to other major asset classes as strong geopolitical tailwinds remain intact.
Within equities, we continue to prefer the US over other major regions. Within Asia, Chinese equities have room to benefit from any further policy stimulus near term, but significant fiscal support is likely necessary for sustained gains. Instead, we retain an Overweight on Indian equities given greater growth visibility over the longer term.
Where are the opportunities around the US elections?
US elections: A fork in the road?
Are quantitative models still bullish on equities?
Strategy
Investment strategy and key themes
|
|
||||
|
|
||||

Our top preferences
Foundation Allocations
- OW gold, N equities/bonds
- In equities: OW US
Opportunistic Allocations
Equity BUY ideas
- US technology, communication, healthcare sectors, large banks
- India large cap equities
- China non-financial divi SOEs
- Hang Seng technology sector
Bond BUY ideas
- Europe govt. bonds (FX-hedged)
- INR local currency bonds
- US Agency MBS
- Global convertible bonds
- US 20-year+ government bond
FX views
- Modestly stronger USD
Elections risks vs. soft-landing prospects
- Financial markets have thus far been unfazed by US election risks. We continue to believe elections can create opportunities amid short-term volatility, but our soft-landing macro view points to medium-term outperformance of risk assets.
- The recent rebound in US government bond yields presents an opportunity to lock in an attractive income as major central banks continue to cut rates, lowering returns on cash. Additionally, we remain Overweight gold relative to other major asset classes as strong geopolitical tailwinds remain intact.
- Within equities, we continue to prefer the US over other major regions. Within Asia, Chinese equities have room to benefit from any further policy stimulus near term, but significant fiscal support is likely necessary for sustained gains. Instead, we retain an Overweight on Indian equities given greater long-term growth visibility.
It’s the festive season for markets
While much has been written about the risks posed by the US election, the S&P500 has remained unfazed and maintained an uptrend, buoyed by persistent expectations that the US economy will achieve a soft-landing. This has been matched by higher US bond yields, a rise that appears driven by higher real yields rather than rising inflation worries. The October-to-December period tends to be a seasonally positive period for equities and current trends suggest a potential repeat this year, though US elections may introduce volatility.
Placing US election event risk in context
How concerned should investors be about the risk posed by US elections? We’ve written previously that elections, whether in the US or elsewhere, can lead to short-term volatility in the lead up to the event. Such volatility can offer opportunities for short-term opportunistic trades (See bonds, equity and FX sections for more details).
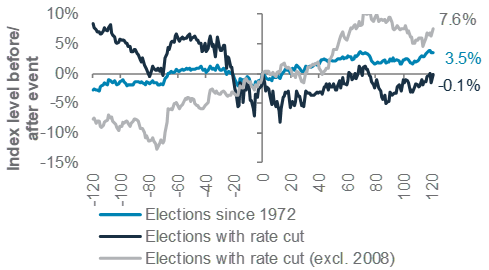
However, history suggests this volatility tends to be short-lived. Therefore, we believe longer-term Foundation allocations are better-driven by a focus on the underlying fundamental backdrop, which remains positive. US macro data thus far remain consistent with a soft-landing, supported by further Fed rate cuts. This is why we remain Overweight US equities within a broader core allocation of global stocks.
Fig. 1 US elections have historically tended to have a short-lived impact on markets
S&P500 returns days before/after US Presidential elections
Can gold keep rising?
Last month, we argued gold prices had room to rise further. This was a view driven by both ongoing central bank demand and a longer-term move lower in bond yields.
This view appears to be playing out as expected, with gold rising more than 4% over the past month. Interestingly, gold has continued to rise despite US bond yields moving higher, indicating price gains are fuelled by a combination of central bank buying and safe-haven demand. While a significant escalation in geopolitical tensions has been avoided thus far, risks remain high. Therefore, we retain our Overweight view on gold (relative to stocks, bonds and cash).
Taking advantage of the yield rebound
We believe the rebound in US bond yields offers an opportunity to add exposure. We previously noted that yields rising above 4% would represent an opportunity to add, an outcome that has now materialised.
In the near term, we view this as a chance to lock in an attractive income. Although yields have room to soften, we believe a sharp decline is unlikely over the next 1-3 months. Longer-term, though, yields can still move significantly lower as Fed rate cuts continue into 2025. We see bonds as a core holding in Foundation allocations. For Opportunistic allocations, we also recently opened a new buy idea for 20-year US government bonds (see Weekly Market View, published on 25 October 2024 for more details).
Within fixed income, the opportunity to lock in an income remains compelling, in our view, as cash yields are likely to continue moving lower following Fed rate cuts, resulting in the underperformance of cash relative to high-quality bonds.
This income opportunity can also extend to corporate and Emerging Market (EM) bonds, which have also benefited from the rebound in US government bond yields. However, the yield premium that these bonds offer over US government bonds remains tight and, thus, offers little value.
Fig. 2 We see the US bond yield rebound as an opportunity to lock in attractive income
US 2-year and 10-year government bond yields

Consequently, this leaves us with a neutral view across major fixed income asset classes. Given this, we see the opportunity in bonds today, driven primarily by moves in US government bond yields.
US over non-US equities
We prefer US equites over other regions, given this is where the soft-landing narrative remains most pronounced. However, non-US markets offer a range of opportunities.
In Asia, further policy support from China could lead to renewed equity market gains in the short term. Nevertheless, we believe more sustained long-term gains are likely to require greater fiscal stimulus. Chinese equites are also arguably most vulnerable if Republican candidate Trump wins the presidential election, as he has proposed higher tariffs on Chinese imports. We, therefore, favour maintaining a core holding (neutral) view on Chinese equities within Asia.
Instead, we maintain an Overweight view on Indian equities. Gains in this market have paused, with foreign investor outflows being one key driver (likely driven by a combination of a stronger USD and a rotation within Asia towards China). Nevertheless, we remain more confident in the long term economic and earnings growth outlook in relative terms.
Japanese equities have seen some support returning given a softer JPY in recent weeks. We believe JPY weakness can persist over a 1-3 month horizon amid increased political uncertainty, after the ruling coalition lost its majority in the snap lower house elections. However, any JPY losses are likely to reverse over the 6-12 month horizon. From a foreign investor’s point of view, though, JPY strength and equity weakness are likely to offset each other. Our preference is to maintain a core holding based on expectations that rising wages and shareholder-friendly policies support sustained gains, independent of the currency.
Europe arguably faces the weakest growth outlook relative to other regions, causing us to maintain our Underweight view.
Foundation asset allocation models
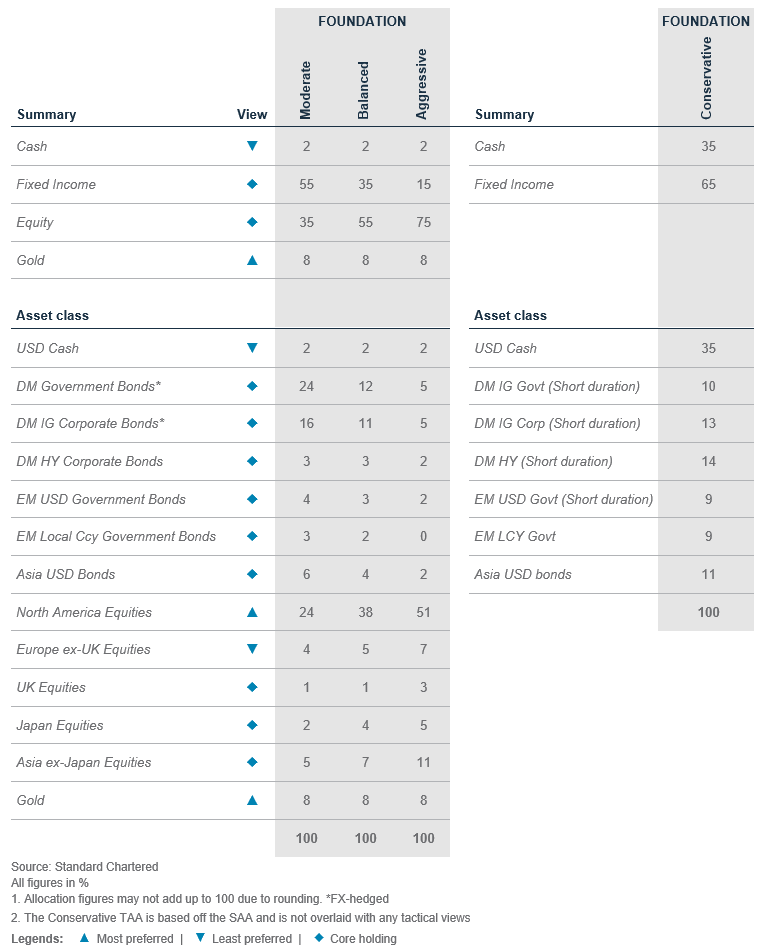
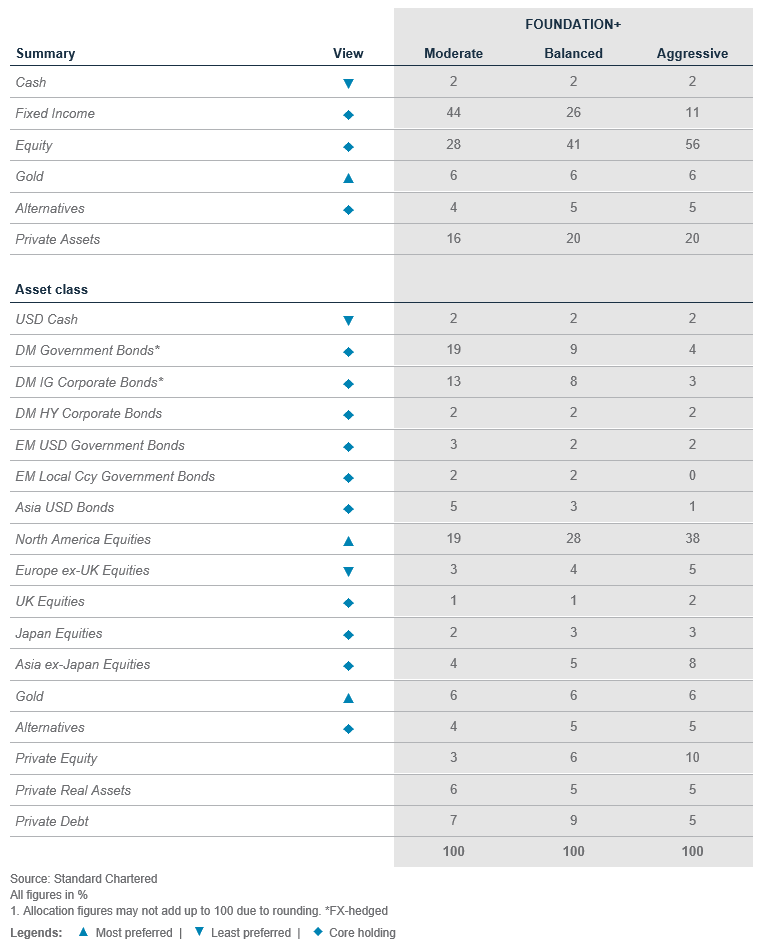
The Foundation and Foundation+ models are allocations that you can use as the starting point for building a diversified investment portfolio. The Foundation model showcases a set of allocations focusing on traditional asset classes that are accessible to most investors, while the Foundation+ model includes allocations to private assets that may be accessible to investors in some jurisdictions, but not others.
Fig. 3 Foundation asset allocation for a balanced risk profile

Fig. 4 Foundation+ asset allocation for a balanced risk profile

Fig. 5 Multi-asset income allocation for a moderate risk profile

Foundation: Our tactical asset allocation views
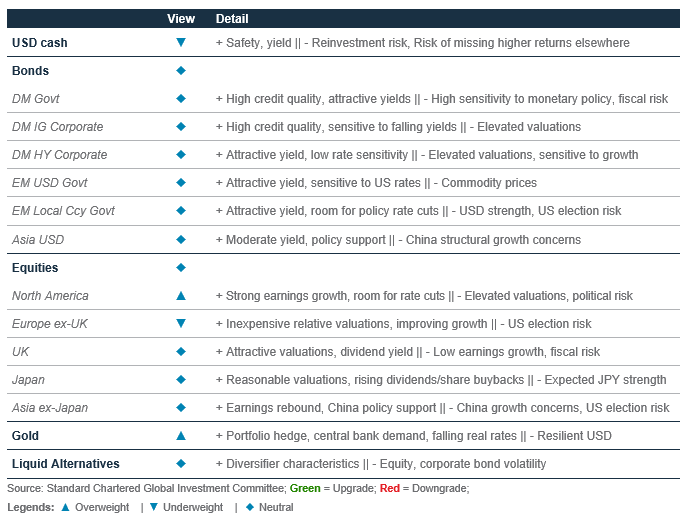
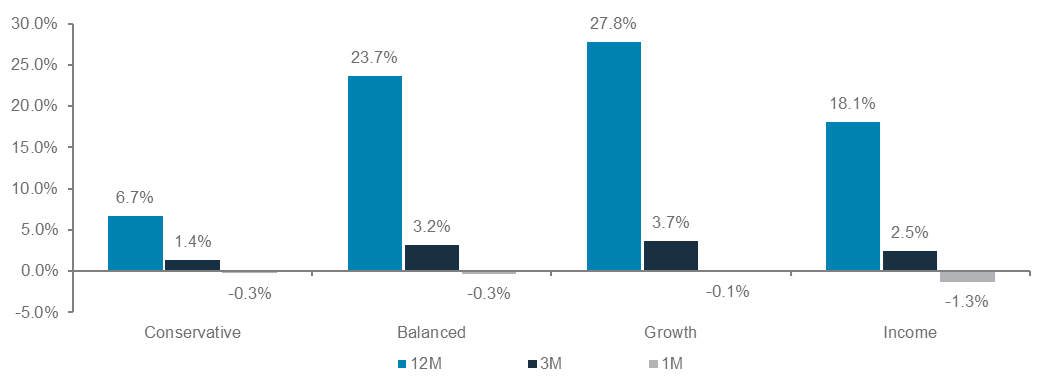
Fig. 6 Performance of our Foundation Allocations*
Perspectives on key client questions
|
|
||||
As the countdown to the US elections begins, where are the opportunities for investors?
Betting markets are favouring former President Trump as we head into the final week of the 2024 US election campaign, giving him an estimated 60% chance of winning the White House. However, opinion polls show that Trump and Democrat candidate Harris are locked in a tight race, within the margin of error. Uncertainty around the outcome thus remains high. Against this backdrop, how should investors position their portfolio to navigate the likely volatility heading into and out of the elections?
Polls have decent track record this close to the elections
Unlike betting markets, polling averages paint a less optimistic outlook of a Trump victory. Historically, polls tend to be fairly accurate this close to election day. In 12 of the 14 previous presidential elections, the candidate leading in the polls one week before election day has gone on to become the winner. However, given the narrow race, and small lead any candidate may garner, investors should not take the polling results for granted, as the 2024 election may well be decided by a few hundred votes, as was the case in 2000.
We may not get a clear winner on election night
The election night of 5 November may not yield an immediate winner due to the close nature of the race. If history is any guide, as seen in 2016 and 2020, Trump may deliver a victory speech early in the morning, but this does not mean results are final. Close races, especially those within the margin of error, mean a higher number of actual ballots will need to be counted before a winner is officially declared. Legal challenges are also possible, adding further delays to the declaration of the winner.
A Trump victory appears well-priced in some financial assets
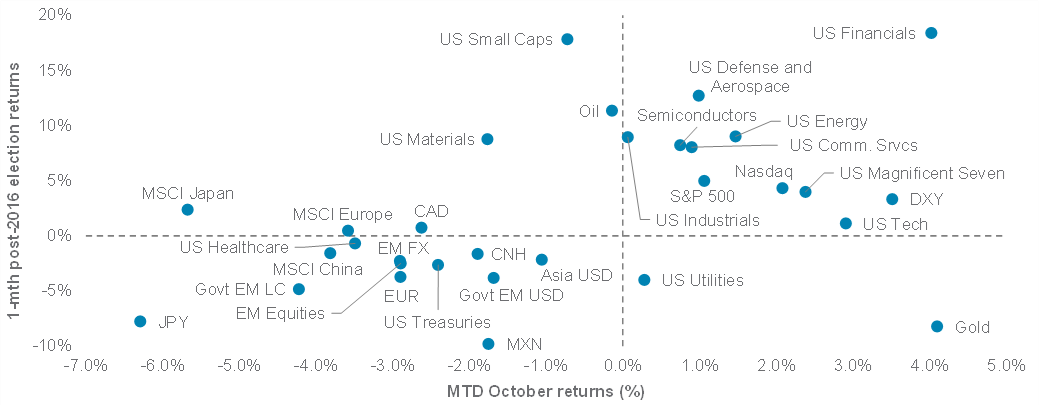
Unlike the polls, financial markets appear to be more in line with betting markets, pricing a Trump victory in certain asset classes. The so-called ‘Trump trade’ winners and losers have moved in ways similar to 2016 (Fig. 10). For example, US regional banks appear well-priced amid expectations that Trump may ease capital regulations for smaller banks. US government bond yields and the USD have

Fig. 7 Trump’s odds have been steadily improving in polling averages and betting markets
Average Trump lead in betting markets and polls
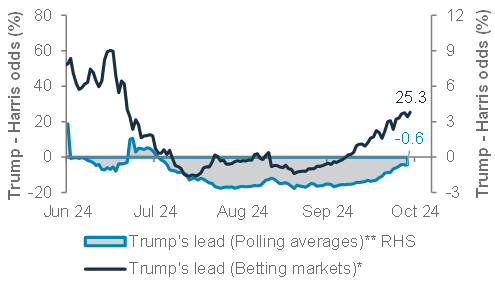
Fig. 8 Polls have a decent track record of predicting winners, especially this close to the elections
Polling average 1 week before elections and eventual winner
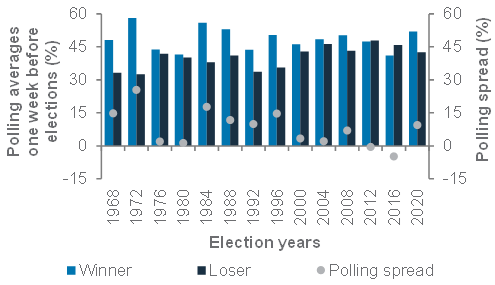
*Average of Trump victory odds from Polymarket, PredictIt and Kalshi. As of 29 October 2024. **Average of Trump victory odds from 538 and RealClearPolitics. As of 28 October 2024. Polling averages one week before elections based on 538 polling data only.
also strengthened, partly in anticipation of higher inflation and fiscal deficit as a result of Trump’s protectionist trade policies and pro-growth domestic agenda. Meanwhile, EM currencies and equities, which weakened under the previous Trump administration, have also softened in October. These assets are partly priced for a Trump presidency, but are also most at risk of a reversal should such expectations fail to materialise.
Opportunities in oil, US small caps, industrials
Although some assets have priced in a potential Trump victory, other sectors still offer room for gains. Oil and energy stocks stand out, especially after a sharp reversal in October amid easing Middle East tensions. Trump’s plan to reverse regulations on fossil fuels and to reimpose sanctions on Iran would likely boost the energy sector. Likewise, small cap and industrial stocks, which saw October declines, could benefit from his pro-growth policies, such as tax cuts and onshoring.
US Treasuries a hedge against a Harris win
US government bond yields have risen, partly because of Trump’s perceived inflationary policies. However, recent yield gains have improved the risk/reward dynamics of the asset class, making US government bonds a potential beneficiary of a Harris victory. The bonds have lost 2.3% in October, not far from the 2.6% loss following the 2016 elections.
Gold could consolidate but long-term drivers intact
Gold appears at risk of a reversal post-election, especially if political uncertainty eases, given its strong rally in recent months. However, gold remains relevant as a hedge against a contested election. If the election takes days to finalise, gold could offer portfolio diversification during the prolonged market volatility. Over a longer horizon, gold also remains well-positioned as a hedge against Trump’s inflationary policies and geopolitical uncertainty. Gold gained nearly 50% during Trump’s previous term (2016-2020), for instance. Any
pullback in prices following the election thus represents an opportunity to add exposure.
US equities set to benefit, regardless of outcome
US equities are positioned to benefit, whichever candidate prevails, in our view. They do not appear overpriced for a Trump victory, and seasonality also favours equities at year end, especially following strong year-to-date returns (Fig. 9). Historically, US stocks have performed well during election years with strong January-to-October gains, posting positive returns in 12 of the last 13 election years through November and December.
Keeping perspective amid election volatility
While election volatility can shake markets, these effects tend to be short-lived. Investors should keep their focus on long-term goals and the broader economic outlook. Fundamentals, such as corporate earnings, inflation and interest rates, will remain the primary drivers for financial markets beyond election day. There, the outlook remains constructive.
Fig. 9 US equities have historically done well in the final months of the year, especially when returns in earlier months have been strong
S&P 500 returns (Jan – Oct vs Nov – Dec)
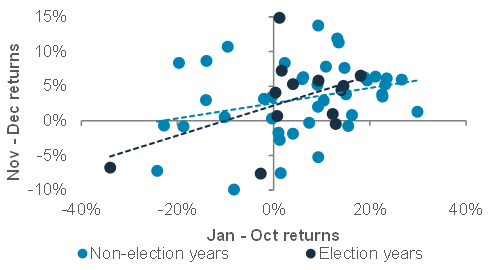
Fig. 10 Financial markets have begun pricing in a Republican win
October MTD returns vs post-2016 election returns
Macro overview at a glance
Our macroeconomic outlook and key questions
|
|
||||
Key themes
Strong US data, Fed rate cuts to support soft-landing: Recent US data have surprised on the upside. A resilient job market and continued disinflation are helping sustain consumption-driven growth. We expect the Fed to cut rates by another 50bps by year-end, easing financial conditions. However, a potential Trump win, alongside a divided Congress, presents a risk as his agenda of import tariffs and immigration curbs could reignite stagflation concerns.
ECB to ease further; BoJ on hold: Euro area growth remains weak, with the industrial sector continuing to contract amid weak EM demand. We expect the ECB to cut rates by another 25bps this year as inflation cools. Meanwhile, the BoJ is likely to stay on hold amid political uncertainty after Japan’s ruling coalition lost its majority in the lower house elections.
China NPC meeting in focus: China has recently unveiled measures to stabilise growth and the property market. We expect more comprehensive fiscal and monetary policy easing after the 4-8 November National People’s Congress (NPC) Standing Committee meeting aimed at overcoming deflation and promoting sustainable economic growth.
Key chart
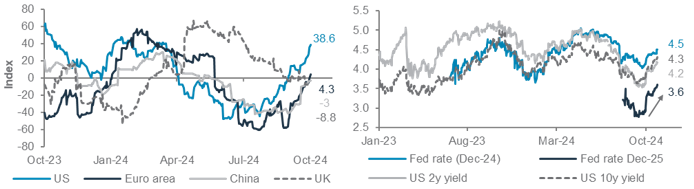
The latest run of stronger-than-expected US data has raised the prospects of an economic soft-landing. The upcoming US elections are a key risk to the outlook, especially in the event of a Trump victory, with a divided Congress
Fig. 11 Strong US economic data have eased recession concerns, lifting bond yields
Economic surprise indices; US government bond yields, expected* Fed rates for Dec ’24, ’25
A fork in the road?
The global economy is arguably on track to settle towards a soft-landing, with continued disinflation and monetary policy easing in the US and Europe, alongside China’s incremental efforts to stabilise growth and fight deflation. The International Monetary Fund, in its latest update, maintained its April forecast for global growth at 3.2% for both 2024 and 2025.
Diverging trends: Despite the stable outlook, the IMF upgraded US growth estimates, while downgrading forecasts for major Euro area, Latin America and Emerging Europe economies and keeping China and India unchanged. This divergence is also reflected in recent economic data, with the US delivering positive surprises, leading markets to price in fewer Fed rate cuts over the coming year. Policymakers, especially in the US, face the challenge of calibrating monetary easing when service sector inflation remains well above the 2% target. Meanwhile, fiscal policy remains overly accommodative, given the advanced stage of the business cycle – highlighting the need for the US to build fiscal buffers ahead of the next downturn.
US elections and the geopolitical fork in the road: Against this macro backdrop, the US elections portends significant uncertainty. If Harris were to win, we are likely to see policy continuity, though targeted trade restrictions against China remains a risk. Conversely, a Trump presidency, particularly with a spilt Congress, could lead to significant changes. Trump’s tariff policies and immigration curbs may reignite inflationary pressures, while dampening global growth prospects, as his tax cut plans fall through. A Republican ‘clean sweep’ would raise the risk of surging fiscal deficits and rising bond yields, somewhat offset by potential tax cuts. However, a Democrat ‘clean sweep’ seems the least likely, given the high probability of Republicans gaining the Senate.
China’s policy easing to stabilise growth: Any NPC decision, coming just after the US elections, holds great significance for the global growth outlook. Independent estimates show China needs to implement fiscal stimulus to the tune of almost 10% of GDP over the coming years to sustainably offset deflationary pressures and revive growth.
Asset Classes
Bonds – at a glance
|
|
||||
|
Key themes
We maintain a balanced allocation between government bonds (rates) and corporate and Emerging Market (EM) USD bonds (credits). Higher rates volatility, in our view, has presented opportunities to raise exposure to bonds as yields have surged.
Developed Market Investment Grade (DM IG) government bonds remain a core holding (Neutral). We believe concerns over the Fed easing less than initially expected and US fiscal deficits are overstated, enhancing the asset class’s risk-reward appeal. However, given the near-term upside risks to yields, we have adjusted our 3-month target for the US 10-year yield to 4.00-4.25%.
DM IG corporate bonds remain a core holding (Neutral) alongside DM High Yield (HY) corporate bonds. Although yield premiums are close to historically tight levels, strong fundamentals and our expectation of a US economic soft-landing support their valuations, in our view.
EM assets, such as EM USD and local currency government bonds and Asia USD bonds, are core holdings (Neutral). We believe rising geopolitical risks ahead of the US election and potential declines in global industrial commodity prices are balanced by supportive fundamentals. Additionally, we have a balanced view between Asia IG and HY bonds.
Key chart
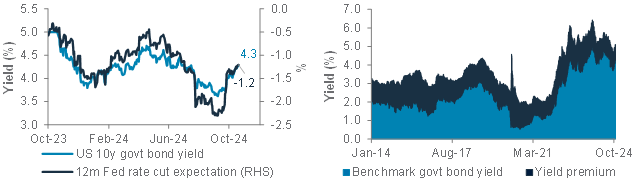
The recent reversal in Fed rate cut expectations and elevated short-term event risks have driven both nominal and real yields higher, offering an opportunity to lock long-term yields via adding exposure to bonds
Fig. 12 US government bond yields have risen as Fed rate cut expectations receded; Tight yield premium suggests less appealing valuation for corporate bonds over rates
Money market estimate of Fed rate cuts over next 12 months; US 10y government bond yield; US aggregate corporate bond yield premium and benchmark government bond yield
Keep tactical buy: US 20Y+ government bonds
We initiated this tactical idea on 25 Oct 2024(see Weekly Market View). Longer maturity US government bonds have underperformed shorter tenors YTD. We believe the former offers relative value, with catch up room, as the Fed continues to ease. Shallower-than-expected Fed rate cuts are a risk.
Keep tactical buy: Global convertible bonds
A US economic soft-landing scenario is likely beneficial for risky assets, such as convertible bonds, which we expect to align more closely with equity markets due to high correlation. Technicals are also supportive, with Asian issuers providing higher new issue premium. A hard-landing scenario is a risk.
Keep tactical buy: US Agency MBS
This asset class continues to offer an attractive yield pick-up over comparable US government bonds. We expect resilience
in the US housing market ahead of anticipated Fed rate cuts. Significant mortgage refinancing at low rates during the pandemic is keeping average mortgage rates contained. Risks include a significant housing market slowdown.
Keep tactical buy: EUR government bonds
We retain our tactical buy on EUR government bonds (FX-hedged). We expect the ECB to cut rates further amid soft growth and contained inflation. The retreat in Fed rate cut expectations could fuel relative outperformance of the bonds. Risks include a reversal of dovish ECB expectations.
Keep tactical buy: INR bonds
INR bonds continue to offer attractive absolute yields. While certain bond tenors have been excluded from foreign investors, overall liquidity remains attractive, especially given expectations of a stable INR.
Equity – at a glance
|
|
||||
|
|
||||
Key themes
We retain a core holding (Neutral) on global equities and anticipate they will perform in line with bonds while outperforming cash. We are Overweight US equities, underpinned by our expectation that Fed rate cuts will lead to a soft-landing for the US economy. Earnings growth remains robust, and macro data remain healthy. However, near-term risks include a cooling labour market and the US elections in November.
UK equities are also a core holding (Neutral), with an attractive dividend yield and valuation discount, alongside improving economic data. While UK equities offer a defensive sector composition, the lack of growth sectors could limit outperformance. We are Underweight Europe ex-UK equities given a deteriorating earnings outlook, despite their cheap valuations.
Asia ex-Japan equities are a core holding (Neutral). Within the region, we are Overweight India equities. Domestic investors have continued to add exposure, even as foreign investors have partly reallocated into China. We believe Indian equities will continue to demonstrate strong earnings and robust economic growth over the medium term. China equities are a core holding (Neutral), with ongoing policy easing measures likely to help mitigate concerns about economic growth. Japan equities are also a core holding (Neutral), supported by improving share buybacks and a reflationary environment, although they face the risk of a stronger JPY due to a potential unwinding of the so-called carry trade.
Key chart
Strong data supporting soft-landing narrative in the US
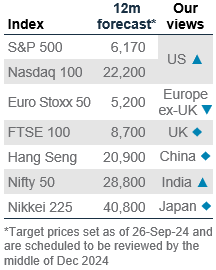
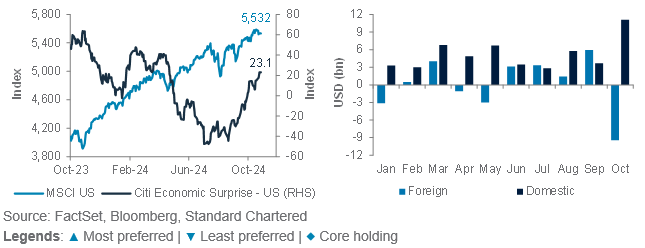
Fig. 13 Strong US data supporting the soft-landing narrative, boosting equities; Indian equities are well supported by domestic demand
US economic surprise indicator vs. MSCI US index; Indian equities are well supported by domestic flows
Long-term growth from AI-related investments
A confluence of catalysts is supporting US equities. Consensus estimate for 2025 earnings growth, at 15%, is the highest among major equity markets. On the macro front, expectations of further Fed rate cuts in 2024-2025 should lower borrowing costs for consumers and corporates, spurring consumption and investments. In the Q3 2024 earnings season, S&P500 earnings is expected to grow by 4.3%, led by the technology sector at 14.9%. Several large companies in the global semiconductor sector, which serve as bellwether for overall technology sector growth, have reported solid Q3 earnings amid strong demand for advanced semiconductor chips. Capacity remains constrained amid strong AI-related demand.
While the US technology sector stands out, other technology-focused markets appear to be less attractive. Within Asia ex-Japan, we hold a Neutral stance on Taiwan equities as we expect the market to consolidate after a strong rally since the start of the year. While we see further opportunities as the AI-theme plays out near term, the longer-term outlook is largely clouded by geopolitical tensions and high valuations. We are Underweight Korea equites, expecting them to underperform the broader market. Price momentum has remained unappealing over the past two months amid a lack of sustained catalysts and foreign net outflows from the market since August.
Equity opportunistic views
|
Tactical opportunity in China
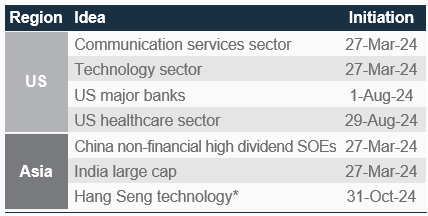
- We target positive absolute returns in our Opportunistic buy ideas. This month, we close Japan banks and Europe healthcare, while opening a new idea on the Hang Seng technology index.
Changes to our buy Ideas
Closing Japan banks: We close this idea after 4 months (20-Jun to 31-Oct) for a 0.8% gain. Although we expect the BoJ to raise interest rates further, benefiting banks’ profitability, the transition to a new government and increased JPY volatility mean we prefer to stay on the sideline for now.
Closing Europe healthcare: We close this idea after 2 months (29-Aug to 31-Oct) for a 10.0% loss. The sector has been weak amid concerns about slower-than-expected sales of weight-loss drugs, intensifying competition and disappointing results from a cancer drug trial.
Opening Hang Seng technology: The index rose sharply in September and consolidated in October. We expect it to rise further as policymakers unveil more stimulus details that can support a valuation re-rating. Over 90% of the index comprises of our Overweight sectors of China communication services, consumer discretionary and technology, which offer superior earnings growth versus the broader market. This sector has also raised share buybacks this year with strong cashflows. Weaker-than-expected policy support is a risk.
Existing buy ideas
US technology: We look for an acceleration in earnings growth to drive the sector higher as rate cuts ease valuation concerns. We believe AI applications remain in the early stages, while technology software offers resilient growth. Any weakness in AI spending is a risk.
US communication services: Digital advertising, online entertainment and AI applications continue to drive robust growth. A downturn in digital advertising is a risk.
US major banks: Even as US interest rates fall, we expect a steeper yield curve to mitigate the negative impact on banks’ interest income. Recovering capital market activities should also support investment banking and fee income growth. A potential Republican ‘clean-sweep’ could offer deregulation tailwinds. A sharp slowdown in the US economy is a risk.
US healthcare: The sector has been weak amid higher-than-expected costs, but we expect performance to improve with stable earnings growth, supported by pharma companies’ robust drugs pipeline. Adverse regulations are a risk.
China non-financial high dividend SOEs: We continue to like the income stability here, alongside growth offered by the
Hang Seng technology sector (barbell approach). Non-financial state-owned enterprises (SOEs) are less exposed to the troubled property sector. Adverse regulations are a risk.
India large cap stocks: We expect strong domestic inflows, resilient earnings growth and policy continuity to support further gains ahead. A risk is weaker-than-expected growth.
Fig. 14 Opportunistic buy ideas
Sector views: Healthcare & technology barbell
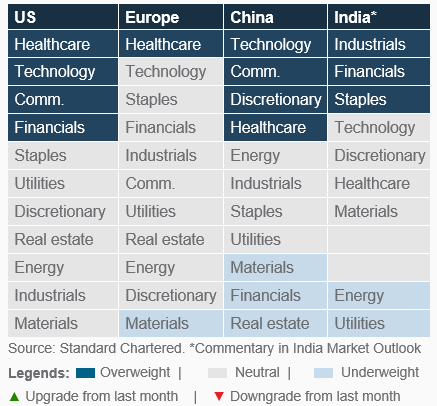
Our barbell approach continues in the US, with favoured growth sectors of technology and communication balanced by the defensive healthcare. We expect US financials to outperform in a soft-landing scenario. In Europe, we still expect healthcare to outperform the broader market even as we close our buy idea. In China, we prefer technology, communication and consumer discretionary, which are tied to improving consumption. We are also Overweight healthcare, where valuation and growth are bottoming, in our view.
Fig. 15 Our sector views by region
FX – at a glance
|
Key themes
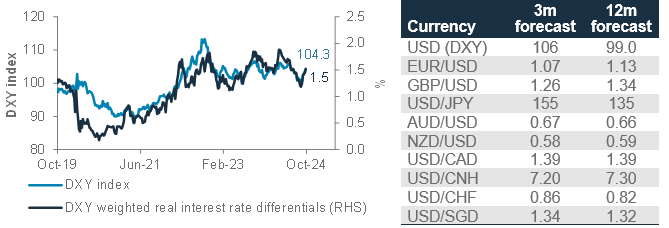
We are modestly bullish on the USD, targeting 106 over the next 1-3 months. The market is closely watching the US election as both candidates’ policies present risks to the USD. Harris’s proposed taxation and energy policies could dampen investment in US assets and stoke inflationary pressures, while Trump’s tariff-centric approach may disrupt global supply chains and hurt US exports, thereby reducing foreign demand for the USD. For now, we expect the USD index to rise alongside US government bond yields, especially if US economic data continue to surprise to the upside, potentially limiting further dovish actions by the Fed. We believe the EUR is likely to trade around 1.07 over a 3-month horizon amid a firmer greenback and lower ECB policy rates. The GBP is also likely to face a downside bias, underpinned by BoE rate cut expectations over the next 3 months. However, the Labour government’s first budget, which ramped up borrowing for investment, should limit significant downside risks.
The USD/JPY is likely to consolidate around 155 in the near term, though political uncertainty could weigh. USD/CHF is likely to stabilise over the next 1-3 months. With markets pricing a 25bps cut by the Swiss National Bank (SNB) through year-end, any strong rebound in the pair to July highs would likely need a fresh catalyst. The AUD is expected to be well-supported at 0.67, buoyed by strong gold prices and an anticipated RBA rate hold through year-end. Meanwhile, pressure for rate cuts is rising in New Zealand, which may push the NZD to test its Q3 low at 0.58. We see CAD and CNH stabilising amid cooling commodity prices, with markets awaiting further details on China fiscal stimulus and US election results. USD/SGD may edge towards 1.34 amid softening Singapore inflation, with the MAS (Singapore’s central bank) holding the SGD’s nominal effective exchange rate band steady.
Key chart
Real interest rate differentials suggest the USD is at its fair value. A further uptick of the USD’s real interest rate differentials versus other major economies in the near term is likely to support the USD
Fig. 16 Real interest rate differentials have been a key driver of the USD
USD index (DXY), US interest rate differentials vs. other DXY members*; Table of forecasts
*Derived using 10-year inflation-linked government bonds; As of 28 October 2024
What is the FX outlook in the upcoming eventful political month?
Political and event risks in the US, UK, Japan and China are in focus. In the US, Trump’s proposed tax cuts without spending reductions, could inflate the fiscal deficit, potentially driving government bond yields higher and initially boosting the USD due to higher returns on dollar-denominated assets.
Meanwhile, the UK Labour party’s initial budget, which raised taxes and ramped up borrowing for investment amid still-high inflation, has raised concerns. However, dovish remarks from Bank of England Governor Andrew Bailey have fueled expectations of a further 25bps cuts in both November and December. This would weigh on the GBP/USD, potentially pushing the pair towards 1.26.
In Asia, Japan’s ruling coalition recently lost its majority, adding to policy uncertainty. However, a gauge measuring the extent of USD/JPY’s move from its lowest traded level over the past 28 days has reached a 2-year high. Historically, such sharp moves has triggered BoJ-intervention risk. Whenever the reading reaches the threshold of 9.4, the USD/JPY pair has seen an average 7% correction. Therefore, we believe the recent rapid move has increased the likelihood of an official intervention in the near term. Meanwhile, China’s NPC meeting in early November could provide details of the anticipated stimulus. We expect USD/CNH to trade at 7.20, given a widening US-China bond yield spread amid China’s soft economic backdrop.
Gold, crude oil – at a glance
|
Key themes
We raise our 3-month gold forecast to USD 2,800/oz, while maintaining gold at Overweight relative to other major asset classes. Gold extended its rally in October, breaking above USD 2,700/oz to fresh record-highs, as investors piled into the yellow metal amid the heightened geopolitical risk backdrop. The rebound in both real and nominal bond yields amid hawkish repricing of Fed rate expectations did little to drag down the precious metal – this suggests that gold has several tailwinds and the underlying inflows remain strong, in our view. Tactical positioning is crowded, but it is supported by an increasingly positive sentiment towards gold. Gold ETF holdings have risen substantially in recent weeks, but remain well below their peak. Based on these trends, we expect further upside for gold in the coming months.
We see more upside risk for oil prices following the recent plunge. Reports suggesting rising prospects of a ceasefire in the Middle East conflict and the avoidance of significant escalation amid tit-for-tat strikes across the region helped unwind the geopolitical risk premium for crude oil prices. Meanwhile, tactical positioning hovers near a record short level. The combination of near-record short positioning and depressed prices raises the odds of a reversal. Moreover, OPEC+ may delay its output tapering plan a second time, especially after the recent price slump. Technically, prices close to USD 67/bbl have been a strong support level on several occasions in the past two years. Thus, we raise our 3-month WTI oil forecast to USD 75/bbl. In the longer term, we expect the demand-supply balance to shift to a surplus (details below), exerting downward pressure on oil prices.
Key chart
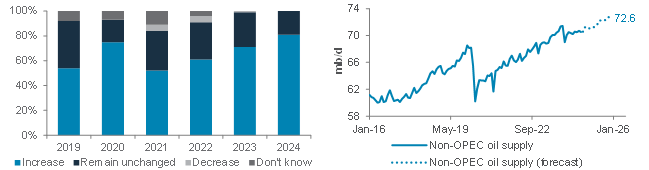
Global central banks view gold favourably as a reserve asset.
Robust non-OPEC crude oil supply growth is likely to extend
Fig. 17 Global central banks likely to increase their gold holdings over the next 12 months; Non-OPEC oil supply growth is expected to accelerate next year
Central banks’ expectations of gold holdings in the next 12 months; Non-OPEC crude oil supply
Central bank gold demand to sustain in 2025
A question we often get is whether strong central bank gold demand could sustain going forward, especially as gold prices continue to scale fresh record-highs. While a slowdown in central bank gold purchases is possible in the near term, we believe that the buying interest is likely to stay robust on a cyclical horizon due to three reasons: 1) diversification of USD reserves; 2) hedging demand against geopolitical uncertainty; 3) still-low allocation to gold, especially by EM central banks.
The latest survey conducted by the World Gold Council across 70 central banks corroborated our expectations of continued official sector demand. Among the respondents, 81% expect global central bank gold holdings to rise in the next 12 months, whereas 29% intend to raise their own gold holdings over the same period. Both responses are the highest on record.
Non-OPEC oil supply boom to continue
Rising non-OPEC oil supply (about 60% of global oil production) has been a key driver of crude oil price weakness this year. The US, Canada, and Brazil have accounted for the bulk of this year’s output gains. The EIA expects non-OPEC supply to grow 630kb/d this year, of which 560kb/d will be from the US. The IEA sees a 990kb/d rise in supply. A likely reason is technological advancement has improved production efficiency, boosting supply. Moreover, non-OPEC producers are generally price takers, which means they tend to produce at or near full capacity. Looking ahead, consensus expects the non-OPEC supply boom to continue in 2025, with estimates of supply growth ranging from just under 1mb/d to nearly 2mb/d. Coupled with an unwinding of OPEC+ output cuts, oil markets are likely to see a surplus in 2025, weighing on prices.
Additional perspectives
Quant perspective
Maintaining a tilt towards equities
|
|
||||
Summary
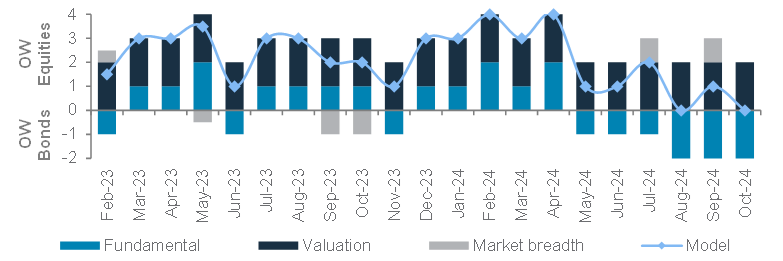
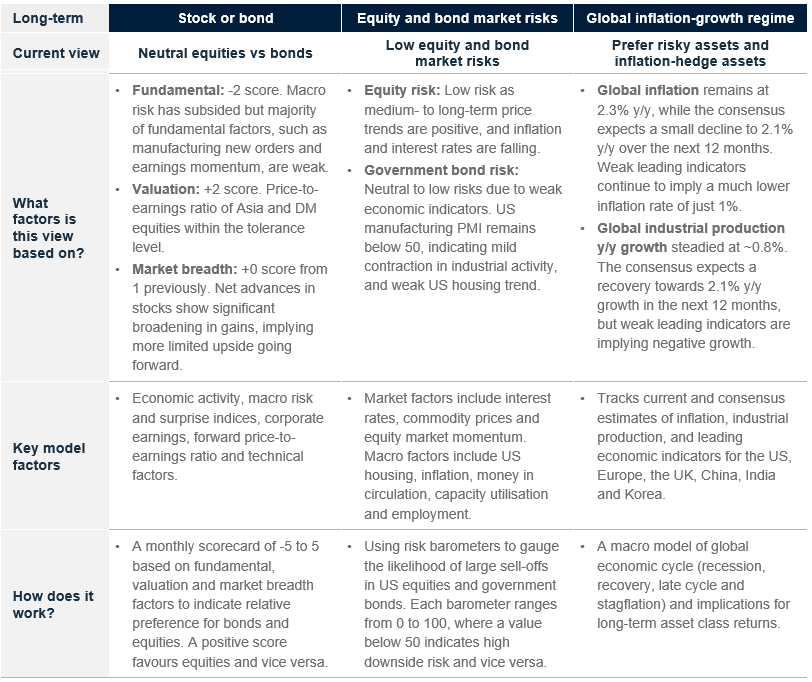
Our stock-bond model’s preliminary month-to-date score is now Neutral equities. The model has outperformed the 60-40 equity-bond portfolio by 3.2% YTD and recorded an absolute return of 14% YTD. The model’s slight Overweight to equities helped as global bonds underperformed global equities in October. Looking ahead, the model’s preliminary score in October turned Neutral on equities as our market breadth factors are now signalling lower upside to equities. Fundamental factors, such as manufacturing activity and earnings momentum, remain weak and negative for equities, but they are offset by our valuation factors that remain supportive of equities.
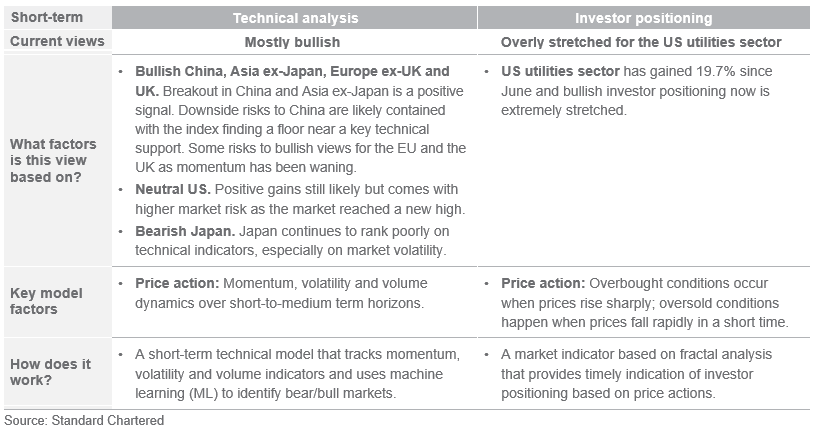
Our technical models are positive on equity regions, with the exception of Japan equities. Our technical models have turned bullish on MSCI China and MSCI Asia ex-Japan indices after their breakout in mid-September. Both markets saw some profit taking in recent weeks after hitting resistance levels, but China appears to have found a floor near a key technical support and looks relatively more attractive than Asia ex-Japan. Meanwhile, our model maintains a rangebound signal for the S&P500 index, which has historically been positive for returns, albeit with higher volatility. Our models for Europe ex-UK and UK equities also remain bullish, but there are is risk of a shift towards a bearish regime as momentum for these markets have been waning.
Our market diversity indicator cautions against chasing the rally in US utilities sector. Many interest-rate sensitive assets, such as DM High Yield bonds, EM local currency bonds and the US real estate sector experienced a pullback. We had flagged risks of stretched positioning last month. The only exception is the US utilities sector, which continues to look stretched according to our indicator. The sector has gained almost 20% since June and may be at risk of a pullback.
Key chart
Our stock-bond model’s preliminary MTD score dropped back to 0 in October as market breadth factors signal lower equity upside
Fig. 18 Breakdown of our stock-bond rotation model’s scores since inception in Feb 2023
Model scores are based on the total of fundamental, valuation and market breadth factors
Historically, the S&P500 index has generated positive returns under the model’s rangebound regime, but this comes with higher market risks
Fig. 19 Our technical model is in a rangebound mode for S&P500
Positive returns are still likely, but they come with higher risks
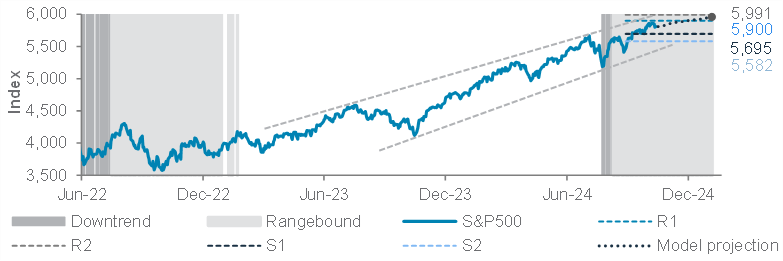
Fig. 20 Long- and short-term quantitative models are bullish risky assets
Long-term models below have a typical time horizon of 3–6 months, while short-term models have a 1–3 month horizon
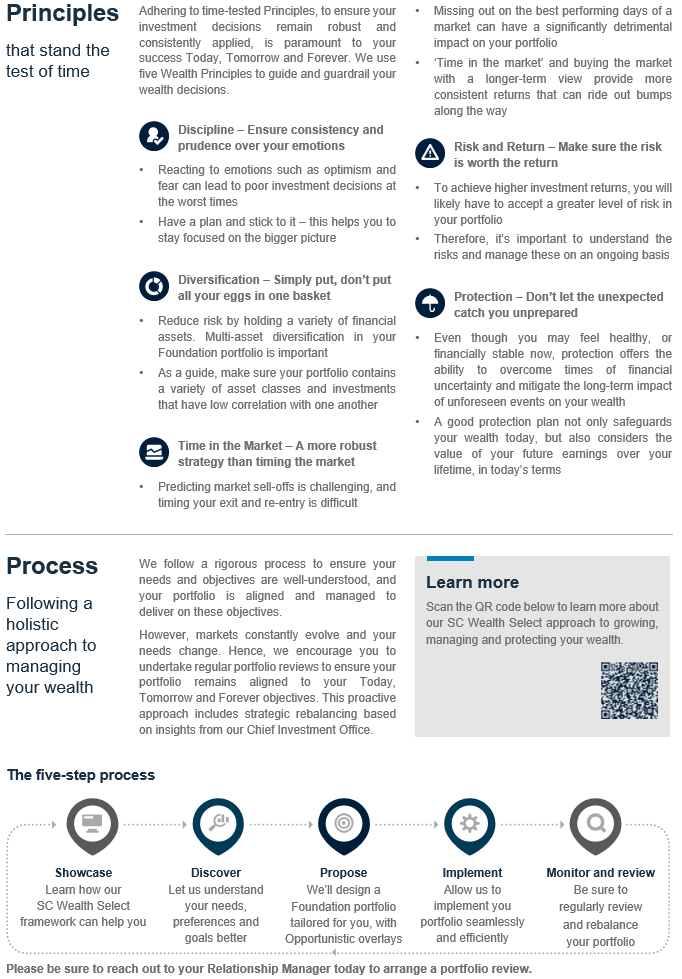
Today, Tomorrow and Forever

Performance Review
Foundation: Asset allocation summary
Foundation+: Asset allocation summary
Market performance summary
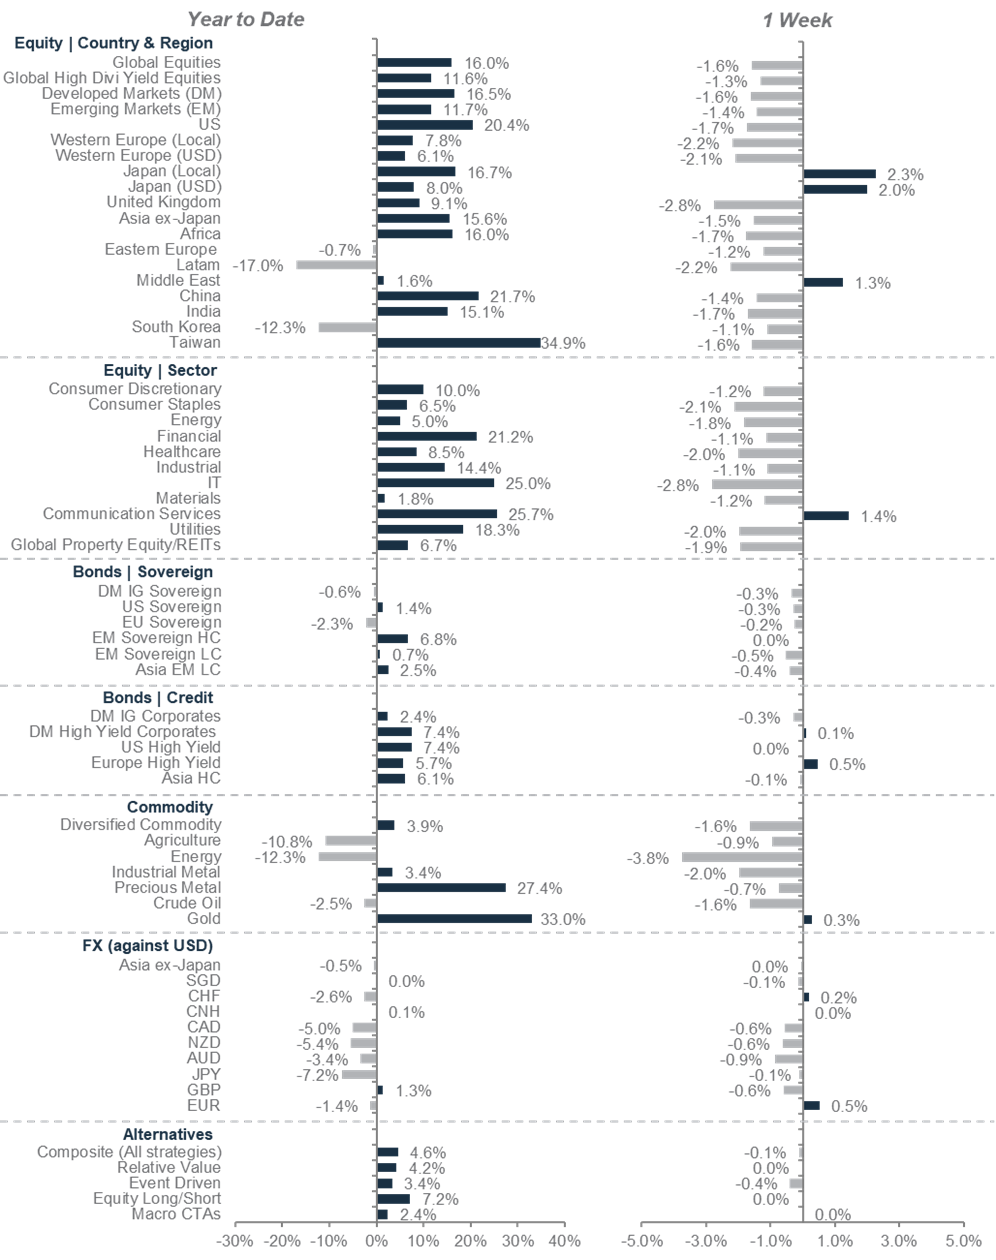
*All performance shown in USD terms, unless otherwise stated
*YTD performance data from 31 December 2023 to 31 October 2024; 1-week performance from 24 October 2024 to 31 October 2024
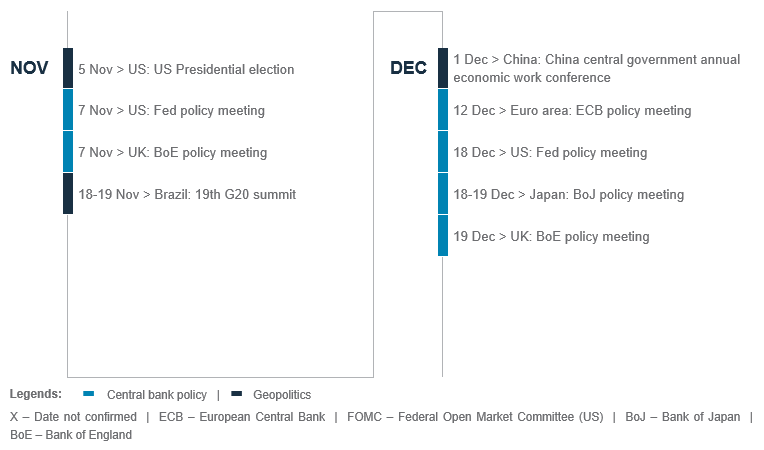
Our key forecasts and calendar events
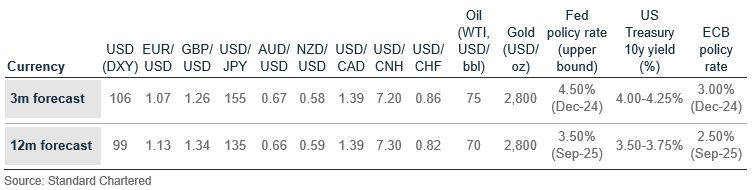

Explanatory notes
1. The figures on page 5 show allocations for a moderately aggressive risk profile only – different risk profiles may produce significantly different asset allocation results. Page 5 is only an example, provided for general information only and they do not constitute investment advice, an offer, recommendation or solicitation. They do not take into account the specific investment objectives, needs or risk tolerances of a particular person or class of persons and they have not been prepared for any particular person or class of persons.
2. Contingent Convertibles are complex financial instruments and are not a suitable or appropriate investment for all investors. This document is not an offer to sell or an invitation to buy any securities or any beneficial interests therein. Contingent convertible securities are not intended to be sold and should not be sold to retail clients in the European Economic Area (EEA) (each as defined in the Policy Statement on the Restrictions on the Retail Distribution of Regulatory Capital Instruments (Feedback to CP14/23 and Final Rules) (“Policy Statement”), read together with the Product Intervention (Contingent Convertible Instruments and Mutual Society Shares) Instrument 2015 (“Instrument”, and together with the Policy Statement, the “Permanent Marketing Restrictions”), which were published by the United Kingdom’s Financial Conduct Authority in June 2015), other than in circumstances that do not give rise to a contravention of the Permanent Marketing Restrictions.
Disclosure
This document is confidential and may also be privileged. If you are not the intended recipient, please destroy all copies and notify the sender immediately. This document is being distributed for general information only and is subject to the relevant disclaimers available at our Standard Chartered website under Regulatory disclosures. It is not and does not constitute research material, independent research, an offer, recommendation or solicitation to enter into any transaction or adopt any hedging, trading or investment strategy, in relation to any securities or other financial instruments. This document is for general evaluation only. It does not take into account the specific investment objectives, financial situation or particular needs of any particular person or class of persons and it has not been prepared for any particular person or class of persons. You should not rely on any contents of this document in making any investment decisions. Before making any investment, you should carefully read the relevant offering documents and seek independent legal, tax and regulatory advice. In particular, we recommend you to seek advice regarding the suitability of the investment product, taking into account your specific investment objectives, financial situation or particular needs, before you make a commitment to purchase the investment product. Opinions, projections and estimates are solely those of SC at the date of this document and subject to change without notice. Past performance is not indicative of future results and no representation or warranty is made regarding future performance. The value of investments, and the income from them, can go down as well as up, and you may not recover the amount of your original investment. You are not certain to make a profit and may lose money. Any forecast contained herein as to likely future movements in rates or prices or likely future events or occurrences constitutes an opinion only and is not indicative of actual future movements in rates or prices or actual future events or occurrences (as the case may be). This document must not be forwarded or otherwise made available to any other person without the express written consent of the Standard Chartered Group (as defined below). Standard Chartered Bank is incorporated in England with limited liability by Royal Charter 1853 Reference Number ZC18. The Principal Office of the Company is situated in England at 1 Basinghall Avenue, London, EC2V 5DD. Standard Chartered Bank is authorised by the Prudential Regulation Authority and regulated by the Financial Conduct Authority and Prudential Regulation Authority. Standard Chartered PLC, the ultimate parent company of Standard Chartered Bank, together with its subsidiaries and affiliates (including each branch or representative office), form the Standard Chartered Group. Standard Chartered Global Private Bank is the private banking division of Standard Chartered. Private banking activities may be carried out internationally by different legal entities and affiliates within the Standard Chartered Group (each an “SC Group Entity”) according to local regulatory requirements. Not all products and services are provided by all branches, subsidiaries and affiliates within the Standard Chartered Group. Some of the SC Group Entities only act as representatives of Standard Chartered Global Private Bank and may not be able to offer products and services or offer advice to clients.
Copyright © 2026, Accounting Research & Analytics, LLC d/b/a CFRA (and its affiliates, as applicable). Reproduction of content provided by CFRA in any form is prohibited except with the prior written permission of CFRA. CFRA content is not investment advice and a reference to or observation concerning a security or investment provided in the CFRA SERVICES is not a recommendation to buy, sell or hold such investment or security or make any other investment decisions. The CFRA content contains opinions of CFRA based upon publicly-available information that CFRA believes to be reliable and the opinions are subject to change without notice. This analysis has not been submitted to, nor received approval from, the United States Securities and Exchange Commission or any other regulatory body. While CFRA exercised due care in compiling this analysis, CFRA, ITS THIRD-PARTY SUPPLIERS, AND ALL RELATED ENTITIES SPECIFICALLY DISCLAIM ALL WARRANTIES, EXPRESS OR IMPLIED, INCLUDING, BUT NOT LIMITED TO, ANY WARRANTIES OF MERCHANTABILITY OR FITNESS FOR A PARTICULAR PURPOSE OR USE, to the full extent permitted by law, regarding the accuracy, completeness, or usefulness of this information and assumes no liability with respect to the consequences of relying on this information for investment or other purposes. No content provided by CFRA (including ratings, credit-related analyses and data, valuations, model, software or other application or output therefrom) or any part thereof may be modified, reverse engineered, reproduced or distributed in any form by any means, or stored in a database or retrieval system, without the prior written permission of CFRA, and such content shall not be used for any unlawful or unauthorized purposes. CFRA and any third-party providers, as well as their directors, officers, shareholders, employees or agents do not guarantee the accuracy, completeness, timeliness or availability of such content. In no event shall CFRA, its affiliates, or their third-party suppliers be liable for any direct, indirect, special, or consequential damages, costs, expenses, legal fees, or losses (including lost income or lost profit and opportunity costs) in connection with a subscriber’s, subscriber’s customer’s, or other’s use of CFRA’s content.
Market Abuse Regulation (MAR) Disclaimer
Banking activities may be carried out internationally by different branches, subsidiaries and affiliates within the Standard Chartered Group according to local regulatory requirements. Opinions may contain outright “buy”, “sell”, “hold” or other opinions. The time horizon of this opinion is dependent on prevailing market conditions and there is no planned frequency for updates to the opinion. This opinion is not independent of Standard Chartered Group’s trading strategies or positions. Standard Chartered Group and/or its affiliates or its respective officers, directors, employee benefit programmes or employees, including persons involved in the preparation or issuance of this document may at any time, to the extent permitted by applicable law and/or regulation, be long or short any securities or financial instruments referred to in this document or have material interest in any such securities or related investments. Therefore, it is possible, and you should assume, that Standard Chartered Group has a material interest in one or more of the financial instruments mentioned herein. Please refer to our Standard Chartered website under Regulatory disclosures for more detailed disclosures, including past opinions/ recommendations in the last 12 months and conflict of interests, as well as disclaimers. A covering strategist may have a financial interest in the debt or equity securities of this company/issuer. All covering strategist are licensed to provide investment recommendations under Monetary Authority of Singapore or Hong Kong Monetary Authority. This document must not be forwarded or otherwise made available to any other person without the express written consent of Standard Chartered Group.
Sustainable Investments
Any ESG data used or referred to has been provided by Morningstar, Sustainalytics, MSCI or Bloomberg. Refer to 1) Morningstar website under Sustainable Investing, 2) Sustainalytics website under ESG Risk Ratings, 3) MCSI website under ESG Business Involvement Screening Research and 4) Bloomberg green, social & sustainability bonds guide for more information. The ESG data is as at the date of publication based on data provided, is for informational purpose only and is not warranted to be complete, timely, accurate or suitable for a particular purpose, and it may be subject to change. The ESG data providers may not provide data coverage of all companies or securities in our Sustainable Investment Universe or Fund Select funds. As a result, a small subset of companies or securities will not be in scope for exclusionary screening. Sustainable Investments (SI): This refers to funds that have been classified as ‘ESG Intentional Investments – Overall’ by Morningstar. SI funds have explicitly stated in their prospectus and regulatory filings that they either incorporate ESG factors into the investment process or have a thematic focus on the environment, gender diversity, low carbon, renewable energy, water or community development. For equity, it refers to shares/stocks issued by companies with Sustainalytics ESG Risk Rating of Low/Negligible. For bonds, it refers to debt instruments issued by issuers with Sustainalytics ESG Risk Rating of Low/Negligible, and/or those being certified green, social, sustainable bonds by Bloomberg. For structured products, it refers to products that are issued by any issuer who has a Sustainable Finance framework that aligns with Standard Chartered’s Green and Sustainable Product Framework, with underlying assets that are part of the Sustainable Investment universe or separately approved by Standard Chartered’s Sustainable Finance Governance Committee. Sustainalytics ESG risk ratings shown are factual and are not an indicator that the product is classified or marketed as “green”, “sustainable” or similar under any particular classification system or framework.
Shariah (“Shariah Compliant or Shariah Compliance”)
For any reason to enter only into transactions which comply or are consistent with the principles of the Shariah, the client certifies that he/she/it has made his /her/its own investigation into and satisfied itself as to the Shariah compliance of the Islamic security and all necessary action to confirm that the Islamic security is Shariah compliant has been taken (including the obtaining of a fatwa, where required) and the Client will not claim any dispute on the grounds of any lack of Shariah compliance of these investments. The Client has not relied on Standard Chartered Group or any written declaration, fatwa, opinion or other documents prepared by, on behalf or at the request of Standard Chartered Group for the purposes of a determination or confirmation that these instruments are Shariah compliant.
Country/Market Specific Disclosures
Bahrain: This document is being distributed in Bahrain by Standard Chartered Bank, Bahrain Branch, having its address at P.O. 29, Manama, Kingdom of Bahrain, is a branch of Standard Chartered Bank and is licensed by the Central Bank of Bahrain as a conventional retail bank. Botswana: This document is being distributed in Botswana by, and is attributable to, Standard Chartered Bank Botswana Limited which is a financial institution licensed under the Section 6 of the Banking Act CAP 46.04 and is listed in the Botswana Stock Exchange. Brunei Darussalam: This document is being distributed in Brunei Darussalam by, and is attributable to, Standard Chartered Bank (Brunei Branch) | Registration Number RFC/61 and Standard Chartered Securities (B) Sdn Bhd | Registration Number RC20001003. Standard Chartered Bank is incorporated in England with limited liability by Royal Charter 1853 Reference Number ZC18. Standard Chartered Securities (B) Sdn Bhd is a limited liability company registered with the Registry of Companies with Registration Number RC20001003 and licensed by Brunei Darussalam Central Bank as a Capital Markets Service License Holder with License Number BDCB/R/CMU/S3-CL and it is authorised to conduct Islamic investment business through an Islamic window. China Mainland: This document is being distributed in China by, and is attributable to, Standard Chartered Bank (China) Limited which is mainly regulated by National Financial Regulatory Administration (NFRA), State Administration of Foreign Exchange (SAFE), and People’s Bank of China (PBOC). Hong Kong: In Hong Kong, this document, except for any portion advising on or facilitating any decision on futures contracts trading, is distributed by Standard Chartered Bank (Hong Kong) Limited (“SCBHK”), a subsidiary of Standard Chartered PLC. SCBHK has its registered address at 32/F, Standard Chartered Bank Building, 4-4A Des Voeux Road Central, Hong Kong and is regulated by the Hong Kong Monetary Authority and registered with the Securities and Futures Commission (“SFC”) to carry on Type 1 (dealing in securities), Type 4 (advising on securities), Type 6 (advising on corporate finance) and Type 9 (asset management) regulated activity under the Securities and Futures Ordinance (Cap. 571) (“SFO”) (CE No. AJI614). The contents of this document have not been reviewed by any regulatory authority in Hong Kong and you are advised to exercise caution in relation to any offer set out herein. If you are in doubt about any of the contents of this document, you should obtain independent professional advice. Any product named herein may not be offered or sold in Hong Kong by means of any document at any time other than to “professional investors” as defined in the SFO and any rules made under that ordinance. In addition, this document may not be issued or possessed for the purposes of issue, whether in Hong Kong or elsewhere, and any interests may not be disposed of, to any person unless such person is outside Hong Kong or is a “professional investor” as defined in the SFO and any rules made under that ordinance, or as otherwise may be permitted by that ordinance. In Hong Kong, Standard Chartered Global Private Bank is the private banking division of SCBHK, a subsidiary of Standard Chartered PLC. Ghana: Standard Chartered Bank Ghana Limited accepts no liability and will not be liable for any loss or damage arising directly or indirectly (including special, incidental or consequential loss or damage) from your use of these documents. Past performance is not indicative of future results and no representation or warranty is made regarding future performance. You should seek advice from a financial adviser on the suitability of an investment for you, taking into account these factors before making a commitment to invest in an investment. To unsubscribe from receiving further updates, please send an email to feedback.ghana@sc.com. Please do not reply to this email. Call our Priority Banking on 0302610750 for any questions or service queries. You are advised not to send any confidential and/or important information to Standard Chartered via e-mail, as Standard Chartered makes no representations or warranties as to the security or accuracy of any information transmitted via e-mail. Standard Chartered shall not be responsible for any loss or damage suffered by you arising from your decision to use e-mail to communicate with the Bank. India: This document is being distributed in India by Standard Chartered in its capacity as a distributor of mutual funds and referrer of any other third party financial products. Standard Chartered does not offer any ‘Investment Advice’ as defined in the Securities and Exchange Board of India (Investment Advisers) Regulations, 2013 or otherwise. Services/products related securities business offered by Standard Charted are not intended for any person, who is a resident of any jurisdiction, the laws of which imposes prohibition on soliciting the securities business in that jurisdiction without going through the registration requirements and/or prohibit the use of any information contained in this document. Indonesia: This document is being distributed in Indonesia by Standard Chartered Bank, Indonesia branch, which is a financial institution licensed and supervised by Otoritas Jasa Keuangan (Financial Service Authority) and Bank Indonesia. Jersey: In Jersey, Standard Chartered Global Private Bank is the Registered Business Name of the Jersey Branch of Standard Chartered Bank. The Jersey Branch of Standard Chartered Bank is regulated by the Jersey Financial Services Commission. Copies of the latest audited accounts of Standard Chartered Bank are available from its principal place of business in Jersey: PO Box 80, 15 Castle Street, St Helier, Jersey JE4 8PT. Standard Chartered Bank is incorporated in England with limited liability by Royal Charter in 1853 Reference Number ZC 18. The Principal Office of the Company is situated in England at 1 Basinghall Avenue, London, EC2V 5DD. Standard Chartered Bank is authorised by the Prudential Regulation Authority and regulated by the Financial Conduct Authority and Prudential Regulation Authority. The Jersey Branch of Standard Chartered Bank is also an authorised financial services provider under license number 44946 issued by the Financial Sector Conduct Authority of the Republic of South Africa. Jersey is not part of the United Kingdom and all business transacted with Standard Chartered Bank, Jersey Branch and other SC Group Entity outside of the United Kingdom, are not subject to some or any of the investor protection and compensation schemes available under United Kingdom law. Kenya: This document is being distributed in Kenya by and is attributable to Standard Chartered Bank Kenya Limited. Investment Products and Services are distributed by Standard Chartered Investment Services Limited, a wholly owned subsidiary of Standard Chartered Bank Kenya Limited that is licensed by the Capital Markets Authority in Kenya, as a Fund Manager. Standard Chartered Bank Kenya Limited is regulated by the Central Bank of Kenya. Malaysia: This document is being distributed in Malaysia by Standard Chartered Bank Malaysia Berhad (“SCBMB”). Recipients in Malaysia should contact SCBMB in relation to any matters arising from, or in connection with, this document. This document has not been reviewed by the Securities Commission Malaysia. The product lodgement, registration, submission or approval by the Securities Commission of Malaysia does not amount to nor indicate recommendation or endorsement of the product, service or promotional activity. Investment products are not deposits and are not obligations of, not guaranteed by, and not protected by SCBMB or any of the affiliates or subsidiaries, or by Perbadanan Insurans Deposit Malaysia, any government or insurance agency. Investment products are subject to investment risks, including the possible loss of the principal amount invested. SCBMB expressly disclaim any liability and responsibility for any loss arising directly or indirectly (including special, incidental or consequential loss or damage) arising from the financial losses of the Investment Products due to market condition. Nigeria: This document is being distributed in Nigeria by Standard Chartered Bank Nigeria Limited (SCB Nigeria), a bank duly licensed and regulated by the Central Bank of Nigeria. SCB Nigeria accepts no liability for any loss or damage arising directly or indirectly (including special, incidental or consequential loss or damage) from your use of these documents. You should seek advice from a financial adviser on the suitability of an investment for you, taking into account these factors before making a commitment to invest in an investment. To unsubscribe from receiving further updates, please send an email to clientcare.ng@sc.com requesting to be removed from our mailing list. Please do not reply to this email. Call our Priority Banking on 02 012772514 for any questions or service queries. SCB Nigeria shall not be responsible for any loss or damage arising from your decision to send confidential and/or important information to Standard Chartered via e-mail. SCB Nigeria makes no representations or warranties as to the security or accuracy of any information transmitted via e-mail. Pakistan: This document is being distributed in Pakistan by, and attributable to Standard Chartered Bank (Pakistan) Limited having its registered office at PO Box 5556, I.I Chundrigar Road Karachi, which is a banking company registered with State Bank of Pakistan under Banking Companies Ordinance 1962 and is also having licensed issued by Securities & Exchange Commission of Pakistan for Security Advisors. Standard Chartered Bank (Pakistan) Limited acts as a distributor of mutual funds and referrer of other third-party financial products. Singapore: This document is being distributed in Singapore by, and is attributable to, Standard Chartered Bank (Singapore) Limited (Registration No. 201224747C/ GST Group Registration No. MR-8500053-0, “SCBSL”). Recipients in Singapore should contact SCBSL in relation to any matters arising from, or in connection with, this document. SCBSL is an indirect wholly owned subsidiary of Standard Chartered Bank and is licensed to conduct banking business in Singapore under the Singapore Banking Act, 1970. Standard Chartered Global Private Bank is the private banking division of SCBSL. IN RELATION TO ANY SECURITY OR SECURITIES-BASED DERIVATIVES CONTRACT REFERRED TO IN THIS DOCUMENT, THIS DOCUMENT, TOGETHER WITH THE ISSUER DOCUMENTATION, SHALL BE DEEMED AN INFORMATION MEMORANDUM (AS DEFINED IN SECTION 275 OF THE SECURITIES AND FUTURES ACT, 2001 (“SFA”)). THIS DOCUMENT IS INTENDED FOR DISTRIBUTION TO ACCREDITED INVESTORS, AS DEFINED IN SECTION 4A(1)(a) OF THE SFA, OR ON THE BASIS THAT THE SECURITY OR SECURITIES-BASED DERIVATIVES CONTRACT MAY ONLY BE ACQUIRED AT A CONSIDERATION OF NOT LESS THAN S$200,000 (OR ITS EQUIVALENT IN A FOREIGN CURRENCY) FOR EACH TRANSACTION. Further, in relation to any security or securities-based derivatives contract, neither this document nor the Issuer Documentation has been registered as a prospectus with the Monetary Authority of Singapore under the SFA. Accordingly, this document and any other document or material in connection with the offer or sale, or invitation for subscription or purchase, of the product may not be circulated or distributed, nor may the product be offered or sold, or be made the subject of an invitation for subscription or purchase, whether directly or indirectly, to persons other than a relevant person pursuant to section 275(1) of the SFA, or any person pursuant to section 275(1A) of the SFA, and in accordance with the conditions specified in section 275 of the SFA, or pursuant to, and in accordance with the conditions of, any other applicable provision of the SFA. In relation to any collective investment schemes referred to in this document, this document is for general information purposes only and is not an offering document or prospectus (as defined in the SFA). This document is not, nor is it intended to be (i) an offer or solicitation of an offer to buy or sell any capital markets product; or (ii) an advertisement of an offer or intended offer of any capital markets product. Deposit Insurance Scheme: Singapore dollar deposits of non-bank depositors are insured by the Singapore Deposit Insurance Corporation, for up to S$100,000 in aggregate per depositor per Scheme member by law. Foreign currency deposits, dual currency investments, structured deposits and other investment products are not insured. This advertisement has not been reviewed by the Monetary Authority of Singapore. Taiwan: SC Group Entity or Standard Chartered Bank (Taiwan) Limited (“SCB (Taiwan)”) may be involved in the financial instruments contained herein or other related financial instruments. The author of this document may have discussed the information contained herein with other employees or agents of SC or SCB (Taiwan). The author and the above-mentioned employees of SC or SCB (Taiwan) may have taken related actions in respect of the information involved (including communication with customers of SC or SCB (Taiwan) as to the information contained herein). The opinions contained in this document may change, or differ from the opinions of employees of SC or SCB (Taiwan). SC and SCB (Taiwan) will not provide any notice of any changes to or differences between the above-mentioned opinions. This document may cover companies with which SC or SCB (Taiwan) seeks to do business at times and issuers of financial instruments. Therefore, investors should understand that the information contained herein may serve as specific purposes as a result of conflict of interests of SC or SCB (Taiwan). SC, SCB (Taiwan), the employees (including those who have discussions with the author) or customers of SC or SCB (Taiwan) may have an interest in the products, related financial instruments or related derivative financial products contained herein; invest in those products at various prices and on different market conditions; have different or conflicting interests in those products. The potential impacts include market makers’ related activities, such as dealing, investment, acting as agents, or performing financial or consulting services in relation to any of the products referred to in this document. UAE: DIFC – Standard Chartered Bank is incorporated in England with limited liability by Royal Charter 1853 Reference Number ZC18.The Principal Office of the Company is situated in England at 1 Basinghall Avenue, London, EC2V 5DD. Standard Chartered Bank is authorised by the Prudential Regulation Authority and regulated by the Financial Conduct Authority and Prudential Regulation Authority. Standard Chartered Bank, Dubai International Financial Centre having its offices at Dubai International Financial Centre, Building 1, Gate Precinct, P.O. Box 999, Dubai, UAE is a branch of Standard Chartered Bank and is regulated by the Dubai Financial Services Authority (“DFSA”). This document is intended for use only by Professional Clients and is not directed at Retail Clients as defined by the DFSA Rulebook. In the DIFC we are authorised to provide financial services only to clients who qualify as Professional Clients and Market Counterparties and not to Retail Clients. As a Professional Client you will not be given the higher retail client protection and compensation rights and if you use your right to be classified as a Retail Client we will be unable to provide financial services and products to you as we do not hold the required license to undertake such activities. For Islamic transactions, we are acting under the supervision of our Shariah Supervisory Committee. Relevant information on our Shariah Supervisory Committee is currently available on the Standard Chartered Bank website in the Islamic banking section. For residents of the UAE – Standard Chartered UAE (“SC UAE”) is licensed by the Central Bank of the U.A.E. SC UAE is licensed by Securities and Commodities Authority to practice Promotion Activity. SC UAE does not provide financial analysis or consultation services in or into the UAE within the meaning of UAE Securities and Commodities Authority Decision No. 48/r of 2008 concerning financial consultation and financial analysis. Uganda: Our Investment products and services are distributed by Standard Chartered Bank Uganda Limited, which is licensed by the Capital Markets Authority as an investment adviser. United Kingdom: In the UK, Standard Chartered Bank is authorised by the Prudential Regulation Authority and regulated by the Financial Conduct Authority and Prudential Regulation Authority. This communication has been approved by Standard Chartered Bank for the purposes of Section 21 (2) (b) of the United Kingdom’s Financial Services and Markets Act 2000 (“FSMA”) as amended in 2010 and 2012 only. Standard Chartered Bank (trading as Standard Chartered Global Private Bank) is also an authorised financial services provider (license number 45747) in terms of the South African Financial Advisory and Intermediary Services Act, 2002. The Materials have not been prepared in accordance with UK legal requirements designed to promote the independence of investment research, and that it is not subject to any prohibition on dealing ahead of the dissemination of investment research. Vietnam: This document is being distributed in Vietnam by, and is attributable to, Standard Chartered Bank (Vietnam) Limited which is mainly regulated by State Bank of Vietnam (SBV). Recipients in Vietnam should contact Standard Chartered Bank (Vietnam) Limited for any queries regarding any content of this document. Zambia: This document is distributed by Standard Chartered Bank Zambia Plc, a company incorporated in Zambia and registered as a commercial bank and licensed by the Bank of Zambia under the Banking and Financial Services Act Chapter 387 of the Laws of Zambia.