

27 September 2024
Global Market Outlook
Global Market Outlook
Strategies for a world of falling rates
The start of the Fed rate cutting cycle supports our view of the US economy achieving a soft-landing. Gold is likely to be a key winner, while cash could be the biggest loser from lower rates. China’s policy easing measures also brighten the outlook for the economy and markets.
We would add to high quality bonds in Foundation allocations on any rebound in US government bond yields towards 4%. Equities, particularly in the US, should also do well in a soft-landing environment.
In Opportunistic allocations, we like European government, Indian local currency and global convertible bonds and US mortgage-backed securities. Our equity ideas remain unchanged, with India large-cap and China high-dividend state-owned enterprise (SOE) equities offering focused exposure to these two markets.
How to position ahead of Fed rate cuts?
Why do you expect a US economic soft-landing?
Are quantitative models projecting a soft-landing?
Strategy
Investment strategy and key themes
|
|
||||
|

Our top preferences
Foundation Allocations
- OW gold, N equities/bonds
- In equities: OW US
Opportunistic Allocations
Equity BUY ideas
- US technology, communication, healthcare sectors, large banks
- India large cap equities
- China non-financial divi SOEs
- Japanese banks
- Europe healthcare
Bond BUY ideas
- Europe govt. bonds (FX-hedged)
- INR local currency bonds
- US Agency MBS
- Global convertible bonds
FX views
- Modestly weaker USD
Strategies for a world of falling rates
- The start of the Fed rate cutting cycle supports our view of the US economy achieving a soft-landing. Gold is likely to be a key winner, while cash could be the biggest loser from lower rates. China’s monetary policy easing measures also brighten the outlook for the economy and markets.
- We would add to high quality bonds in Foundation allocations on any rebound in US government bond yields towards 4%. Equities, particularly in the US, should also do well in a soft-landing environment.
- In Opportunistic allocations, we like European government, Indian local currency and global convertible bonds and US mortgage-backed securities. Our equity ideas remain unchanged, with India large-cap and China high-dividend state owned enterprise (SOE) equities offering focused exposure to these two markets.
Beating seasonality
Equity markets have been more resilient than the average trend in September. Global equities have thus far delivered quarter-to-date (QTD) gains of 6.5% as confidence in the soft-landing outlook was reinforced by a Fed rate cut. Global bonds gained 6.8% QTD as rate cut expectations pushed bond yields lower.
Life after the rate cut
With the Fed now joining other major central banks in cutting rates, we believe a ‘soft-landing’ for the US economy remains plausible, as it did in the mid-1990s. We see a 60% chance of this environment continuing for another 6-12 months, albeit balanced by a not-insignificant 25% risk of a recessionary outcome – a risk we believe warrants ongoing monitoring.
While the US economic outlook remains key for most financial markets globally, we would also keep a close watch on three other macro and market drivers: (i) policy stimulus in China – we believe the latest boost improves the chances of the economy achieving its growth targets, (ii) nascent signs of exuberance in Indian small-cap and IPO markets – though we believe these are too narrow to hurt broader equity market gains given still-strong earnings growth, and (iii) geopolitics and oil prices – we expect oil to stay in a tight range around USD 70/bbl, limiting risks to the global economy.
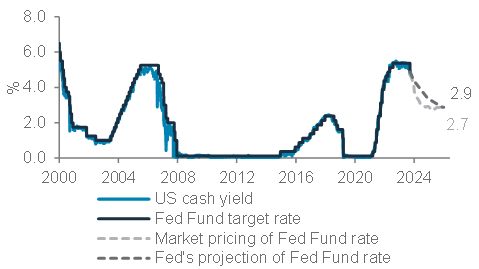
Fig. 1 Last two years have been unusually attractive for cash. This is unlikely to last as the Fed cuts rates
US cash yield vs market/Fed projections of Fed Funds rate
Bonds – buy the rebound in yields
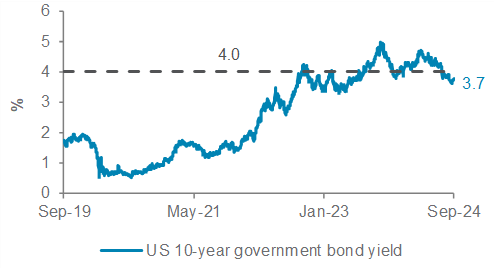
In the bigger picture, we have previously highlighted that bond yields historically move lower as the Fed kicks off a rate cutting cycle. While such a bond market rally has been much delayed in this cycle, the gains appear to be finally noticeable. The opportunity today, in our view, is to add exposure on any rebound in US bond yields towards 4% on expectations that Fed rates and bond yields will continue to fall.
While this view would be more directly positive for government bonds, corporate and EM bonds should also benefit. This, in turn, should help offset corporate and EM bonds’ lack of value due to relatively tight yield premiums over government bonds. Separately, in our Foundation allocations, we close our Overweight to EM USD government bonds after what have been strong gains both on full-year and quarter-to-date periods. Overall, this leaves us with a balanced view across major bond asset classes.
Strong gains this quarter have led us to close several Opportunistic bond ideas as well. We close our 20-year US government bond idea after strong performance over just about a month. We also close our China USD bond idea given we no longer see value.
Equities backed by soft-landing narrative
Our soft-landing macroeconomic outlook for the US economy is supportive of equities. In our view, the avoidance of recession will help keep earnings growth well-supported and, hence, support further equity market gains.
This arguably remains a US-focused argument. The US is where the earnings outlook remains strong, where rates have significantly further room to fall and where sector composition remains relatively more rate sensitive than peers. Therefore, we retain our Overweight view on US equities.
The UK warrants a highlight. Performance has been robust despite a relatively defensive sector composition and a high degree of sensitivity to international earnings, with GBP strength acting as a drag. While the domestic growth outlook may be less weak than initially feared, we continue to believe a core holding (neutral) allocation remains the best way to balance risk and reward. We similarly retain a
Fig. 2 Any rebound in US government bond yield is likely to be limited as the Fed cuts rates
US 10-year government bond yield, with key resistance
core holding view on Japanese equities, where near-term pressure from a stronger JPY is likely to be ultimately offset by stronger domestic growth and shareholder-friendly reforms. Euro area equities is the only region where we maintain our Underweight view – while a rising tide lifts all boats, we expect the region’s equities to lag amid still-soft regional growth despite ECB cuts.
In Asia, the growth outlook remains most robust in India. While signs of froth in pockets of the market (such as the extent of IPO over-subscriptions and level of small/mid cap valuations) keeps us on watch for excess exuberance, broader market valuations remain below their peak. Therefore, we remain Overweight relative to Asia ex-Japan.
In China, meanwhile, recent policy support raises the chances of achieving the government’s 5% economic growth target. While we maintain our core holding view on Chinese equities, further near-term equity momentum is likely given reasonable valuations and uncrowded positioning. Any follow-up policy support should help offset deflationary and geopolitical worries, improving the longer 6-12 month view.
Cash yields now at risk
Yields on cash over the past two years have been among the highest in over two decades. However, this period is now coming to an end. Money markets and the Fed’s own projections argue cash yields are likely to move significantly lower over the coming 6-12 months. This is the reason we continue to expect equities and bonds to outperform cash.
Can gold keep rising?
In our view, gold prices have room to rise further. Bond yields remain one driver of this – if the rebound in bond yields remains relatively short-lived, as we expect, the opportunity cost of holding the non-yielding metal will continue to fall, supporting gold prices. Central bank demand remains the other key factor supporting prices. Here, both purchase data and the macro and geopolitical environment argue the recent environment has room to continue. This is the reason, on balance, we retain our Overweight view on gold and revise our 12-month price expectations higher to USD 2,800/oz.
Foundation asset allocation models
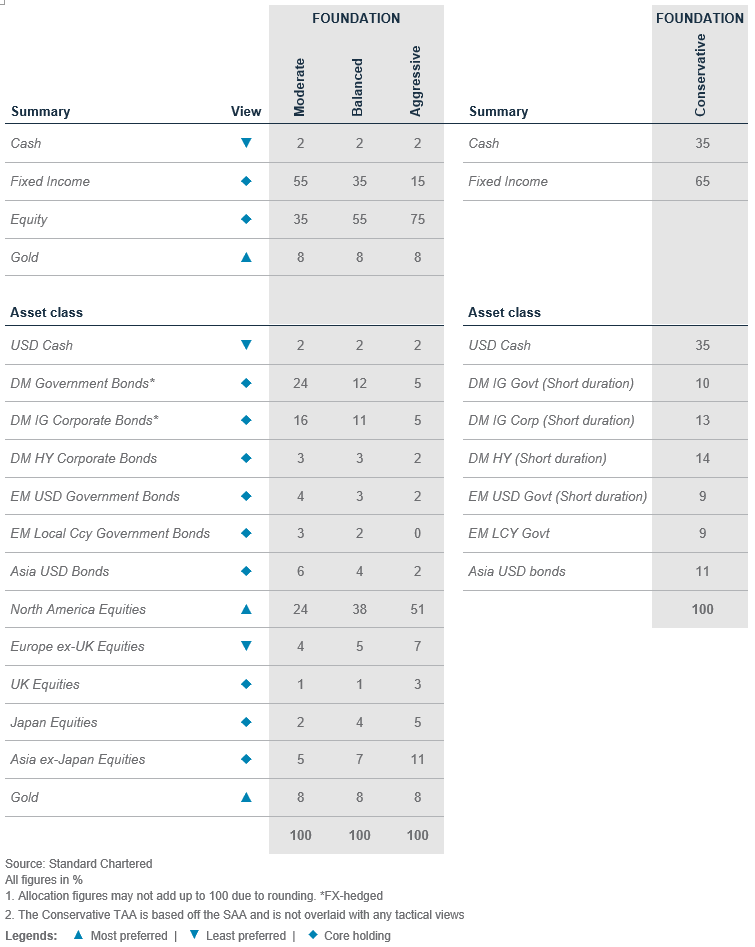
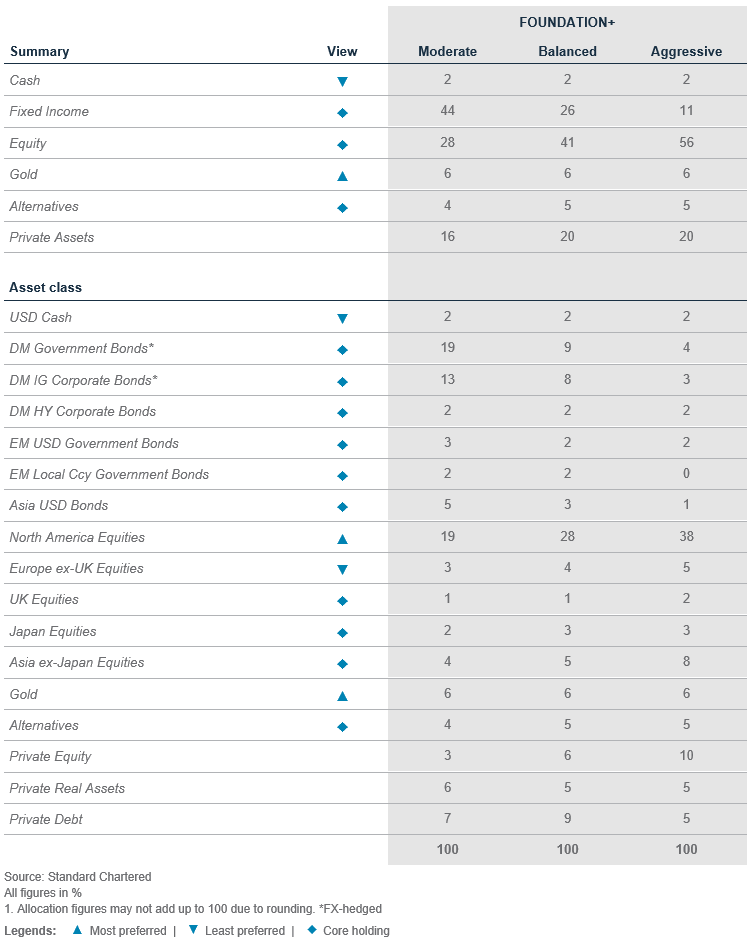
The Foundation and Foundation+ models are allocations that you can use as the starting point for building a diversified investment portfolio. The Foundation model showcases a set of allocations focusing on traditional asset classes that are accessible to most investors, while the Foundation+ model includes allocations to private assets that may be accessible to investors in some jurisdictions, but not others.
Fig. 3 Foundation asset allocation for a balanced risk profile
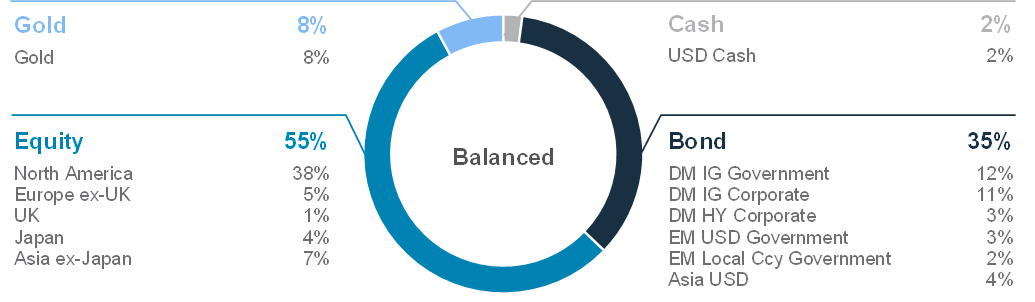
Fig. 4 Foundation+ asset allocation for a balanced risk profile
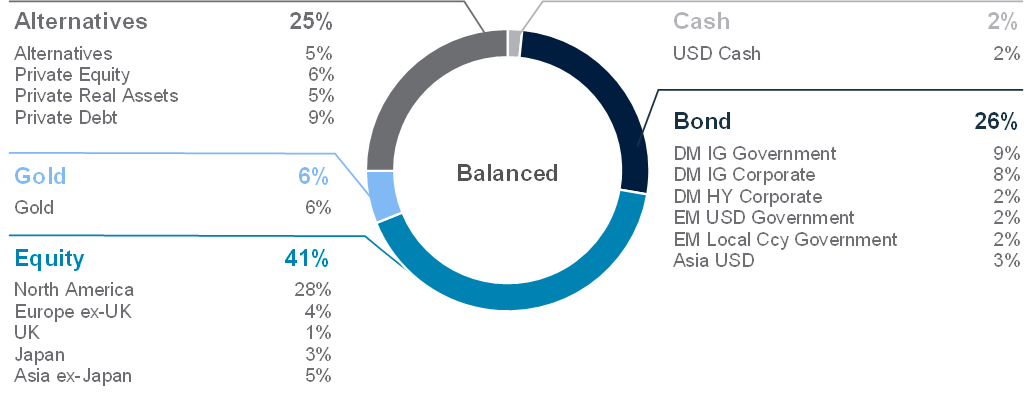
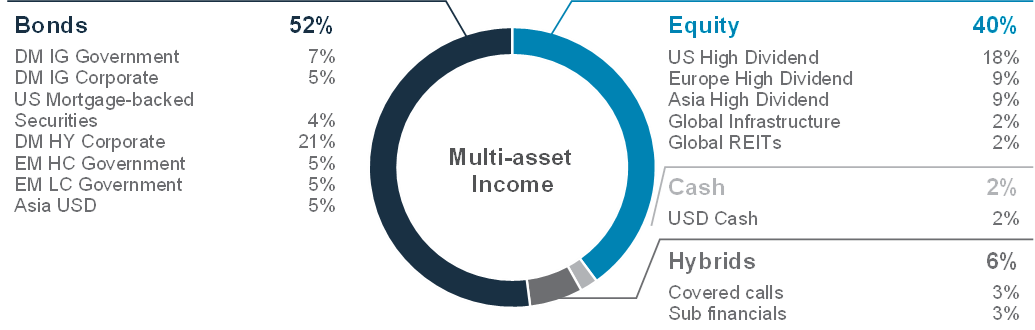
Fig. 5 Multi-asset income allocation for a moderate risk profile
Foundation: Our tactical asset allocation views
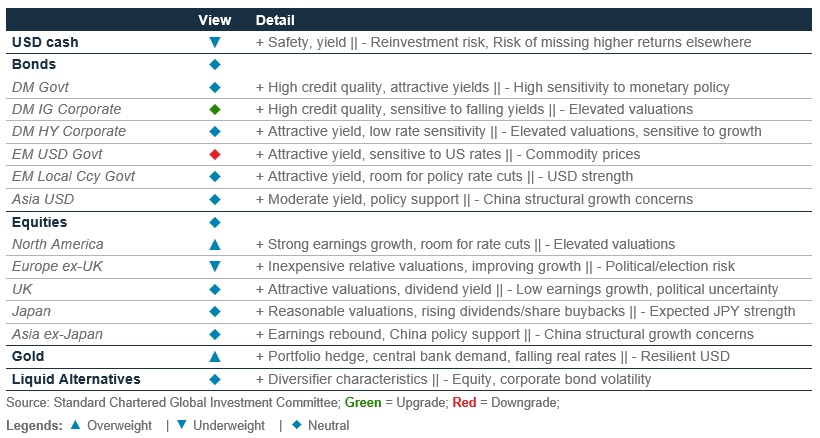
Fig. 6 Performance of our Foundation Allocations*

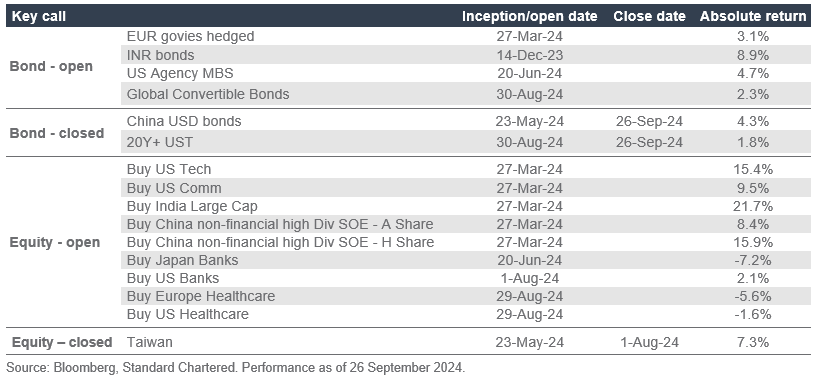
Fig. 7 Opportunistic ideas performance
Foundation: Multi-asset income strategies
|
|
||||
Key themes
Our Multi-Asset Income (MAI) strategy has delivered strong returns of 5.8% over the most recent three months ended 26 September 2024. Returns picked up since the start of the third quarter on the back of Fed’s easing expectations, driving a broad-based rally in both bond and equity markets. The performance of high-dividend equities caught up, after languishing for much of the year behind global equities, as investors grew more confident of a soft-landing to broaden out from tech-heavy global equities into high-dividend equities.
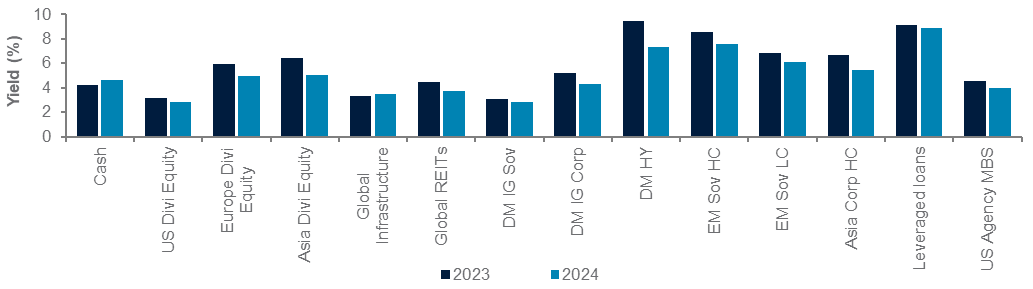
MAI yield down slightly (5.6% as of 31 August 2024), but total return prospects still compelling against cash. The Fed’s recent outsized 50bps cut should help the case for a US economic soft-landing, benefitting dividend equities and rate-sensitive assets such as infrastructure equities, REITs and bonds within the MAI strategy. Historically, easing cycles during soft-landing episodes tend to be supportive of both credit and bonds. The MAI strategy, with an almost 60% allocation to rate sensitive assets, is well-positioned to benefit from the Fed easing cycle. With cash yields likely to continue declining (see page 9), income strategies can offer an attractive alternative given their better return and yield potential.
Key chart
Our diversified income portfolio remains in a sweet spot to benefit from Fed easing and a soft-landing in the US economy
Fig. 8 Multi-asset income portfolios typically perform well after the Fed begins easing
Average returns of the MAI portfolio after the first Fed rate cut*
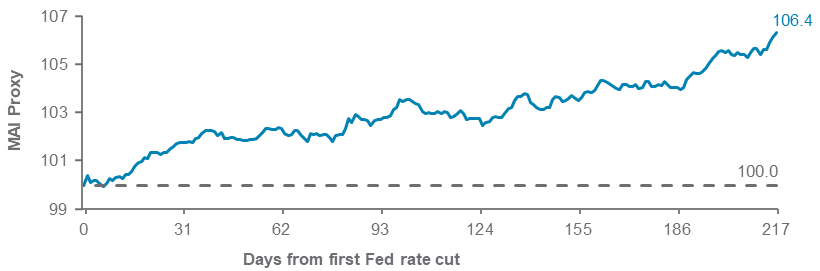
MAI proxied by 2% cash, 20% DM HY, 35% global bonds and 43% global high-dividend equities
Fed rate cuts in 1995, 1998, 2001, 2007 and 2019
Fig. 9 Yields have likely peaked and are beginning to decline
Yield to worst/dividend yield (%)
Contingent Convertibles (CoCos) are complex financial instruments. (Refer to Important Information on page 31 for further details)
Income strategies in sweet spot during easing
Performance of our MAI strategy accelerated in Q3 as Fed easing expectations ramped up. High-dividend equities have seen double-digit returns year to date, with the performance rebounding after the sharp sell-off in early August. Dividend equities continued to benefit from a broadening rally, as investors shifted from growth equity style equities into high-dividend and value style equities as economic data remained resilient, contributing to the soft-landing narrative.
Bonds delivered positive returns across the board in Q3, with Developed Market (DM) Investment Grade (IG) and Emerging Market (EM) local currency (LCY) bonds particularly benefitting from the Fed easing. Market expectations of Fed policy rates declined by over 80bps since July this year to around 4% by the December 2024 Fed policy meeting.
We prefer clipping the higher coupons available in sub-financials and DM High Yield (HY) bonds, with a slight relative preference for the former. While yields on DM HY are high in absolute terms, spreads have tightened considerably to c.370bps, well below its long-term average. As such, returns are likely to be limited. Though yields on sub-financials are lower than DM HY, we believe the former is attractive from a total returns perspective. Banks in Europe are generally well-capitalised, with low risks of either equity conversion or capital write-downs over the next 12 months.
DM HY still preferred over leveraged loans. Given leveraged loans have floating interest rates, they historically tend to benefit less during periods of Fed easing. All things being equal, DM HY bonds with fixed interest rates and a maturity of c.3.5 years tend to outperform leveraged loans in a declining interest rate environment.
Finally, we remain neutral between dividend equities and covered calls within the equity sleeve. They are expected to deliver approximately comparable total returns as a soft-landing powers further equity gains. Covered calls remain an attractive source of income given their high yields and correlation to some equity upside, while dividend equities can do well if a recessionary scenario is avoided.
Let the cuts begin
As the Fed kicked off its easing with a larger-than-expected 50bps cut,we look to history for insights on how assets within our income allocation performed during Fed easing cycles.
Fed easing benefitted both credit and dividend equities during periods of economic soft-landing in 1995 and 1998. Unsurprisingly, bonds delivered positive returns after the first Fed rate cut. Notably, credit assets such as DM HY and EM USD bonds were also strong performers, on average delivering over 15% and 26%, respectively, in the 12 months after the first cut. In these instances, the resilience of the US economy helped in supporting riskier credit assets.
Similarly, the performance of dividend equities was also positive, holding up better than DM HY and global bonds even from the onset of the cuts. If our base case of an economic soft-landing does pan out, the MAI portfolio should perform well, in our view.
Fig. 10 Income assets generate the bulk of positive performance early in the easing cycle
Average returns after the first Fed rate cut during past soft-landing episodes*
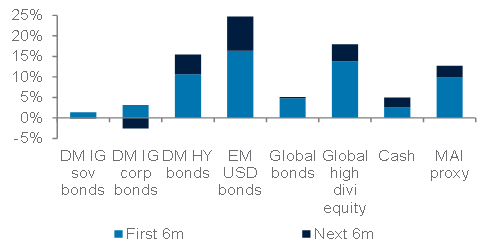
Fed rate cuts in 1995 and 1998 resulted in an economic soft-landing
Fed cuts amid a recession, however, tend to see both dividend equities and credit assets delivering negative returns. During these episodes, DM HY and global dividend equities have struggled. Although initially outperforming, they subsequently underperformed cash and other high-quality bonds such as DM IG sovereign and corporate bonds as recessions unfold. Broadly, the slowdown in economic activity (and eventually fall into a recession) led to markedly wider credit spreads and lower equity prices.
Fig. 11 A recession scenario recorded poorer performance for credit and dividend equities
Average returns after the first Fed rate cut during past recessionary episodes*
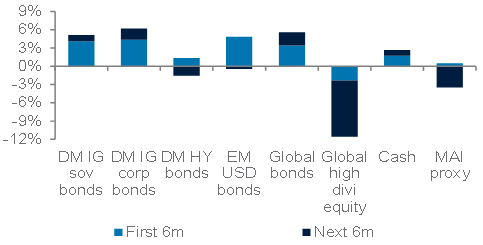
Fed rate cuts in 2001, 2007 and 2019 failed to prevent recessions
As cash yields decline given global central banks are on the path of easing, we believe investors will be increasingly pressed to seek better yielding alternatives for their cash and bonds investments. Income strategies with a mix of both dividend equities and credit exposure, should be well-poised to benefit in this environment.
Perspectives on key client questions
|
|
||||
Rethinking cash as the Fed cuts rates
The opportunity to earn over 5% in a virtually risk-free money market fund or cash deposit is undeniably tempting. With ongoing market volatility, and economic and geopolitical uncertainties, holding cash may seem to be a safe bet. However, with inflation easing, and the Fed now embarking on a rate cutting cycle, the days of high returns on cash are likely numbered, and it may be time to redeploy your cash.
Tweaking cash allocation as conditions change is essential
Cash and cash equivalents, such as bank deposits and money market funds, are often viewed as safe-havens from market volatility and bond alternatives. However, cash is a distinct asset class, with its own risks and benefits, requiring as much careful management as other investments. Cash is susceptible to reinvestment risks, underperforms equities during favourable economic conditions, and typically offers less protection than quality bonds during recessions. Holding too much cash, therefore, can be costly. Adjusting cash allocations in response to changes in economic conditions is essential – especially now, in our opinion.
Fed rate cuts heighten cash reinvestment risk
In September, the Fed cut rates for the first time in over four years, ending the post-COVID hiking cycle that brought policy rates to the highest since 2007. This shift bears important implications for cash. Cash yields, like those on US 1–3-month Treasury bills, tend to follow Fed rates closely, and as markets expect policy rates to decline to below 3% by end-2025, cash yields will likely follow (Fig 12). For short-term securities such as cash, this means the same level of yield will no longer be available once the securities mature and the reinvestment of matured assets will likely return less than before. This is known as reinvestment risk. It is thus imperative to address this risk before yields fall, not after when it is too late.
A steepening yield curve reduces cash appeal
An inverted yield curve – where short-term yields exceed long-term ones – often occurs toward the end of a Fed hiking cycle. In such a scenario, cash may seem

Fig. 12 Cash yields, which closely track the Fed Funds rate, are now expected to fall as the Fed cuts rates
US cash yield vs market and Fed’s projections of Fed Funds rate*
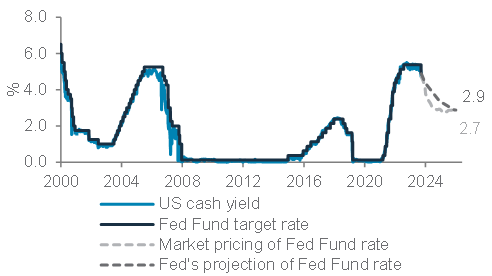
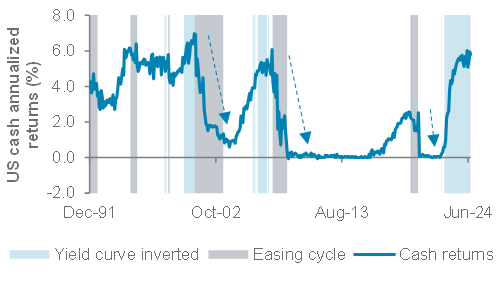
Fig. 13 Cash returns tend to decline sharply after the yield curve “dis-inverts” and as the Fed cuts rates
US cash annualized total returns during periods of yield curve inversions and Fed easing cycles
*Yields and returns based on the Bloomberg US 1-3-month Treasury Bill Total Returns Index. Market pricing of Fed Funds rate based on Fed Fund futures as of 20 September 2024. Source: Bloomberg, Federal Reserve Summary of Economic Projections, Standard Chartered
attractive due to the higher yields on offer than those from longer-dated securities. However, tighter financial conditions will also eventually weigh on economic activity, leading the Fed to cut rates and short-term yields to fall. Reinvestment risk is particularly pronounced during this period, as the yield curve ‘dis-inverts’ and cash starts to lose its appeal against longer-dated securities. It is thus no surprise that cash returns tend to fall sharply shortly after the yield curve ‘dis-inverts’ and steepens while the Fed cuts rates, as we are seeing currently.
Cash a drag on returns most of the time
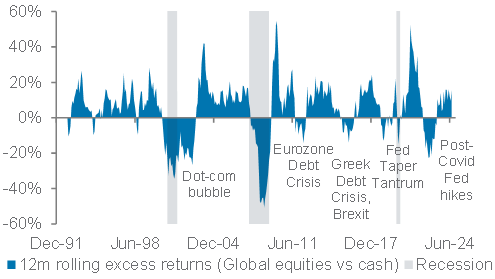
Holding on to too much cash weakens long-term wealth preservation. Outside of recessionary periods or major financial risks, equities typically outperform cash. Since 1991, global equities have outperformed cash almost 70% of the time on a 12-month rolling basis (Fig 14). Particularly for the US, extended periods of stock market weakness outside of recessions and Fed hiking cycles are rare (Fig 15). Given an economic soft landing remains our base case scenario (see page 11), an outsized allocation to cash may be costly.
Fig. 14 Equities outperform cash about 70% of the time
Global equities excess returns vs cash
Bonds are better diversifiers when inflation subsides
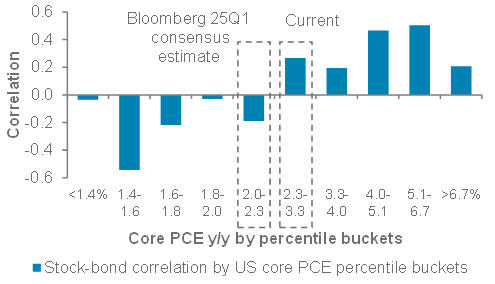
If the US enters a recession, against market expectations of a soft-landing, holding too much cash would also mean missing out on important gains in government bonds. Cash offers declining returns during Fed easing cycles and does not appreciate during a recession, whereas government bonds gain, providing more protection against losses in riskier assets in the portfolio. Having an outsized allocation to cash makes sense during periods of Fed hikes or inflation surges, when other asset classes typically struggle. However, with inflation easing, the negative stock-bond correlation (bonds gain when equities decline and vice versa) is likely to reassert, allowing bonds to resume their role as portfolio diversifiers (Fig 16).
Consider a diversified allocation; gold remains overweight
How should investors deploy cash in today’s market? A diversified portfolio, with a mix of equities, bonds and gold, is an optimal approach, striking a balance between income, capital gains and protection against market drawdowns. Meanwhile, structural tailwinds for gold, such as EM central
bank purchases, are also expected to persist. This is why we favour an overweight allocation to gold, which should also benefit from the current Fed easing cycle, within such a diversified portfolio (Page 26).
Fig. 15 US equities tend to trend upwards outside of recessionary and Fed hiking periods
Days since the S&P500 last posted an all-time high
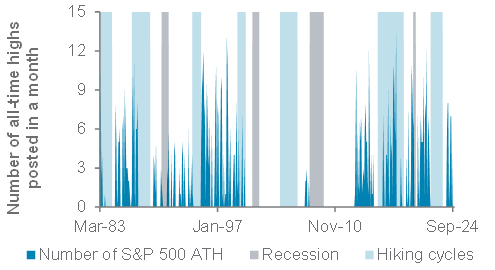
Fig. 16 Bonds offer better protection during a recession
US Treasuries excess returns vs cash
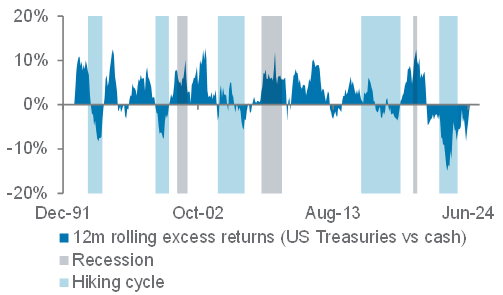
Fig. 17 Stock-bond correlation to soon turn negative, benefitting bonds as portfolio diversifiers
Stock-bond correlation by US core PCE inflation percentile buckets
Macro overview at a glance
Our macroeconomic outlook and key questions
|
|
||||
Key themes
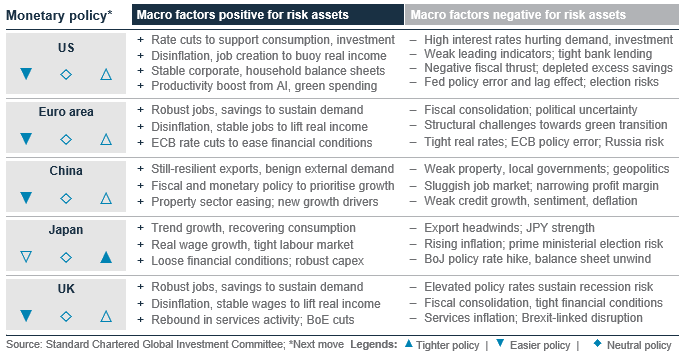
Rate cuts amid cooling inflation help the case for an economic soft-landing. We expect rate cuts by the Fed and other major central banks in the coming months to stabilise growth. The Fed, after delivering an outsized 50bps rate cut in September, is likely to cut its policy rate by another 150bps over the next 12 months, sustaining consumption and reviving business investment. Therefore, we see a 60% chance of a US economic soft-landing and a 15% chance of a no-landing in the next 12 months. Risk scenario: Apart from the US election uncertainty, Fed policy remains too tight, given cooling inflation. The Fed could ease too little, too late, leading to overly tight financial conditions. Therefore, we assign a 25% probability to a hard-landing scenario.
Europe, China to ease policy further. An upturn in global manufacturing is fading, clouding the prospects of the two export-oriented economies. The Euro area also faces structurally higher energy costs, challenges in its ‘green transition’, while Germany’s strict budget rules limit the scope of fiscal easing. Against this backdrop, we expect the ECB to cut rates by another 100bps over the next 12 months to support growth as inflation cools. Meanwhile, China’s latest policy stimulus raise the chance of economic growth meeting the government’s 5% target this year. We expect further monetary and fiscal easing in the coming months to revive business confidence. Risks: A sharper US growth slowdown and/or trade protectionism would impact Europe and China the most.
Key chart
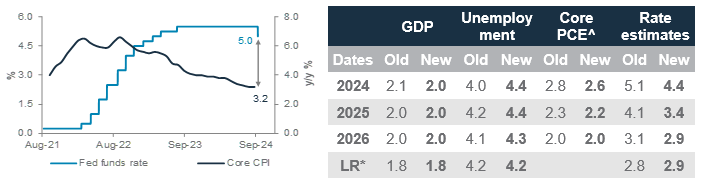
A sustained decline in inflation over the past couple of years means the Fed has substantial scope to cut rates as it shifts its focus towards supporting growth. We expect the Fed to cut its policy rate by another 150bps over the next 12 months
Fig. 18 The Fed has ample scope to cut rates and revive growth as inflation cools
Fed Funds target rate (upper end), US core inflation; Fed’s September economic projections*
Top macro questions
Why do you expect a US economic soft-landing? We assign a 60% probability to a US economic soft-landing over the next 12 months. The likely drivers are: i) Fed rate cuts, by lowering borrowing costs, are likely to sustain consumption and revive business investments; ii) continued disinflation to boost household real disposable incomes, helping to drive consumption, as excess savings built during the pandemic fade; iii) supply of new workers as a result of the immigration boost of the past couple of years to sustain job markets and consumption (although the pace of immigration has slowed in recent months); iv) robust balance sheets shielding companies against two-decade high interest rates to sustain profit margins and support investment; v) robust household finances (mainly among high income earners), thanks to house price and equity gains and low-cost, long-term fixed-rate mortgages locked in during the pandemic, to sustain spending; and vi) productivity boost from AI and green spending.
Of the above, the Fed’s latest policy pivot, with the 50bps starting rate cut of the cycle in September, has the potential to revive consumer and business sentiment. It was the first policy easing since the pandemic in 2020 and the biggest starting rate cut since 2007. We believe the Fed has ample capacity to ease further as the policy rate (5.0%) is still more than 150bps higher than core inflation.
Fed Chair Powell’s comments suggest the central bank is conscious of not falling behind the curve and is keen to lower rates to its estimated long-term neutral (2.9%) as soon as possible. Therefore, we expect the Fed to cut its policy rate by another 50bps by December and a further 100bps to 3.5% by the end of Q3 25. Fed rate cuts should help sustain job creation and consumption and keep the unemployment rate from rising significantly higher from current levels.
A sustained decline in inflation is likely to support a series of Fed rate cuts. US core and supercore (core services inflation excluding shelter) inflation have already fallen close to the Fed’s 2% inflation target on a 3-month annualised basis. Although core inflation accelerated in August to 0.3% on a monthly basis, the rise was primarily driven by shelter inflation. Based on falling market rents, we expect official shelter inflation to resume a downturn in the coming months.
Meanwhile, the US job market is cooling, with average job creation in the past three months slowing to 116,000. We believe forward-looking job market indicators such as the job openings, hiring and quits rates increase the urgency for the Fed to ease policy to ensure an economic soft-landing.
Risk: We assign a 25% probability of a US recession over the next 12 months. The leading index of 10 forward-looking indicators and a re-steepening of the 10-year against 2-year US government bond yield curve signal elevated risks of a downturn. Since 1990, a US recession started 2-6 months after the 10-year vs. 2-year yield curve turned positive again.
Also, a contraction in the US manufacturing PMI and a renewed slump in new orders-to-inventory ratio are signalling increased recession risks, as is a key metric in the job market – the unemployment rate of permanent job losers. When the 3-month moving average of this rate has risen more than 20bps from the past 12-month’s low, a recession has historically started. The indicator rose to 21bps in August.
Is the ECB falling behind the curve? Euro area growth has started to fade on the back of a renewed downturn in global manufacturing and a slowdown in China. The latest PMI data showed the services sector is close to stagnation after a brief upturn boosted by the Paris Olympics. With German fiscal policy constrained by strict spending laws, the ECB is likely to play a key role in supporting growth (despite its core mandate of restraining inflation). We expect sustained disinflation to help the ECB to cut its deposit rate by another 100bps over the next 12 months. Risk: A sharper downturn in US/China or higher US tariffs could cause more rate cuts.
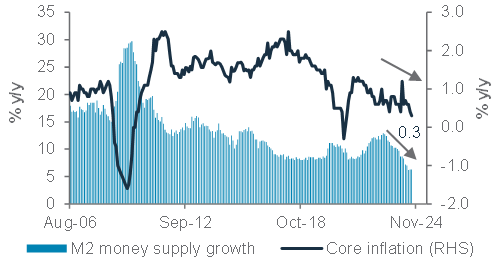
Do you expect more policy easing in China? China has taken the boldest steps since the pandemic to stabilise growth after activity indicators showed a sharp downturn in Q3. The latest cuts in key policy rates and bank reserve requirements, and the liquidity boost to revive bank lending, equity and property markets are likely to help the economy achieve the government’s 5% growth target this year. The start of the Fed’s rate cuts should enable the PBoC to ease further. We also expect fiscal policy easing to revive consumer/business confidence. Risk: Escalating trade tensions, especially after the US elections, could worsen business sentiment, lead to more aggressive stimulus.
Fig. 19 ECB to cut rates as Euro area’s brief upturn fades
Euro area manufacturing and services PMIs and core inflation
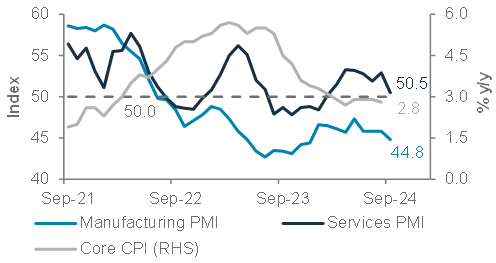
Fig. 20 China to ease policy further to avoid deflation
China M2 money supply growth, core inflation
Asset Classes
Bonds – at a glance
|
|
||||
Key themes
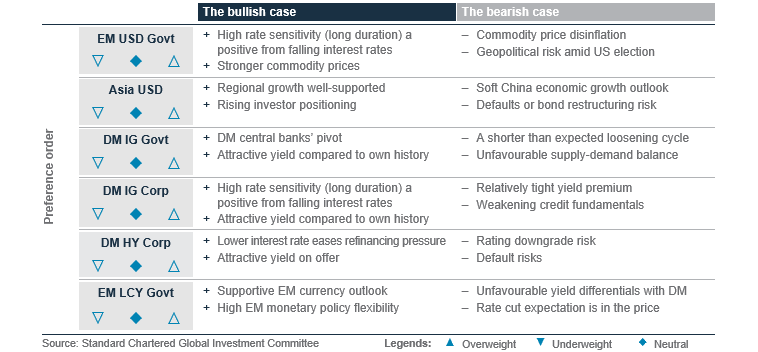
We maintain a balanced allocation between government bonds (rates) and corporate/Emerging Market bonds (credits). We anticipate the Fed will further cut rates over the next 12 months, providing potential for capital gains from softer yields.
Developed Market (DM) Investment Grade (IG) government bonds remain a core holding (Neutral). We expect the US 10-year government bond yield to be range-bound between 3.50-3.75%, albeit with a rise towards 4% possible in the short term.
DM IG corporate bonds are now a core holding (Neutral) alongside DM High Yield (HY) corporate bonds. Although yield premiums are tight from a historical perspective, strong fundamentals and our expectation of a US soft-landing support their valuations, in our view.
EM USD government bonds are reduced to a core holding (Neutral) alongside EM local currency government bonds. Rising geopolitical risks ahead of the US election, and the risk of falling industrial commodity prices, are balanced by supportive fiscal and external fundamentals and fair valuations relative to history.
We maintain a core holding (Neutral) view on Asia USD bonds, with a balanced view between Asia IG and HY.
Key chart
We believe risk-reward across major bond asset classes are balanced.
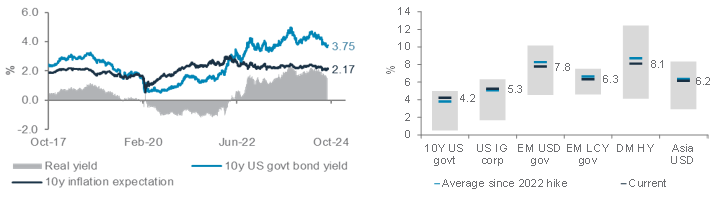
Yields across several major bond asset classes are below the level when the Fed first started to hike in 2022.
Fig. 21 Real (net-of-inflation) yield diminishing as nominal rates fall; Yields of major bond asset classes have returned to their recent averages
US 10-year inflation expectation, nominal and real yield; Current yield and average yield since the 2022 hike (grey area denotes maximum and minimum yields for the past 20 years)
Neutral DM IG government bonds
We maintain a core holding (Neutral) view on DM IG government bonds. In our view, rate cut expectations for the rest of the year now look fully priced in US government bonds, with the 75bps cut expectation indicated by money markets slightly ahead of the 50bps cut indicated by the Fed projections. We continue to assign 60% odds of the US economy achieving a soft-landing and, hence believe the rate cut estimates are justified. As such, we see US 10-year government bond staying within a 3.50–3.75% range over the next three months. We believe rate-cut prospects for most of 2025 are relaetivley well priced as well, which is why our 12-month target is also a range of 3.50–3.75%.
Neutral DM IG and HY corporate bonds
DM IG and HY corporate bonds yield premiums remain at the tighter end of their historical average, offering little value. However, fundamentals remain strong. Quarterly earnings remain supportive and we anticipate highly leveraged corporates to benefit from falling rates. Additionally, a soft-landing scenario should keep default rates relatively contained. In addition, DM HY corporates are not facing significant refinancing pressures this year, which should support performance. Therefore, we retain a core holding (Neutral) view on both the bond asset classes.
Neutral EM USD government bonds
EM USD government bonds rallied in August. We believe sufficient good news is now priced after these gains, hence we close our Overweight view on EM USD government bonds and move to a core holding (Neutral). EM foreign reserves and external debt balances remain largely healthy and yield premiums look fair compared with their own history. However, we are wary of idiosyncratic risks arising from political uncertainty in several EMs. Geopolitical risks ahead of US elections and the potential for falling industrial commodity prices amid weaker global growth are also key risks.
Neutral Asia USD bonds, with a balanced view between IG and HY
In EM Asia, we retain our core holding (Neutral) view on Asia USD bonds. Like DM IG corporate bonds, yield premiums offered by Asia IG bonds are tight relative to history, but this is arguably justified by their strong fundamentals and strong refinancing track record in the capital market year-to-date. Meanwhile, Asia HY bonds continued to deliver consistent returns as China property bond defaults slowed and South-Asian HY corporates successfully refinanced their short-term liabilities. However, a soft China economic outlook and weak industrial commodity prices are risks. We have an equal preference for Asia IG and HY bonds given relatively similar risk/reward at current valuations.
Maintain buy: US Agency MBS
Our view of a moderately weaker USD over the next 12 months is supportive of EM currencies. However, we see the risk-reward for this bond asset class as fair with market rate cut expectations of EM central banks largely priced in.
Maintain buy: EUR government bonds
We believe a US soft-landing scenario suggests reduced chances of a significant move lower in long-maturity yields from here. Also, we believe Fed rate cut expectations are now largely priced in by markets. When combined with a still-flat yield curve, we believe risk-reward favours a Neutral (5-7 year) average maturity profile in USD bond allocations.
Maintain buy INR bonds
A soft-landing scenario is likely beneficial for risky assets, such as convertible bonds. We expect a catch-up with equity markets given their high correlation in this scenario. Technicals are also supportive, driven by higher new issue premium by Asian issuers. A recession scenario is a risk.
Maintain buy: US Agency MBS
The asset class continues to offer an attractive yield pick-up over US government bonds. We expect the US housing market to stay resilient ahead of Fed rate cuts and repayment risks remain low. A hard-landing scenario is a risk.
Maintain buy: EUR government bonds
We retain our tactical buy on EUR government bonds (FX-hedged). We expect the ECB to remain on the policy loosening track amid soft growth and contained inflation. Stronger-than-expected inflation is a risk.
Maintain buy INR bonds
We continue to see INR bonds offering an attractive yield relative to other EM bonds. While the exclusion of some bond tenors from foreign investor eligibility raised some concerns, we believe overall liquidity remains ample, especially given expectations of a stable INR. Weaker-than-expected growth and capital outflows are risks.
Close buy idea: US 20Y+ government bonds
The super-long maturity US government bonds have outperformed the rest of the curve in recent weeks. We close the idea as we assess the risk-reward valuation as fairer than before. Since inception, the idea delivered a return of 1.8%.
Close buy idea: China offshore USD bonds
While the onshore/offshore rate differential persists, we close the idea as investment value has eroded. Since inception, the idea delivered a return of 4.3%.
Equity – at a glance
|
|
||||
|
|
||||
Key themes
We retain a core holding (Neutral) on global equities and expect them to perform in line with bonds and outperform cash. We are Overweight US equities, underpinned by our expectation that Fed rate cuts will achieve a soft-landing for the US economy. We expect US outperformance to be driven by its accelerating earnings growth heading in 2025. A cooling labour market and the US elections in November are near-term risks to the market.
We see UK equities as a core holding (Neutral) with an attractive dividend yield and valuation discount, alongside improving economic data. UK equities offer a defensive sector composition but the lack of growth sectors could limit outperformance. We are Underweight Europe ex-UK equities amid a deteriorating earnings outlook, despite cheap valuations.
Asia ex-Japan equities are a core holding (Neutral). Within the region, we are Overweight India equities, supported by rapid economic growth and robust net inflows from foreign investors. China equities are a core holding (Neutral) for us with ongoing policy easing measures likely to help moderate concerns about economic growth in China. We downgrade South Korea equities to Underweight as price momentum has been poor amid market concerns about its significant exposure to weak demand for memory semiconductor chips. Japan equities are a core holding (Neutral). We are encouraged by improving share buybacks and the reflationary environment, although the transition to a new prime minister could result in some uncertainty.
Key chart
Equities supported with falling inflation and Fed pivot
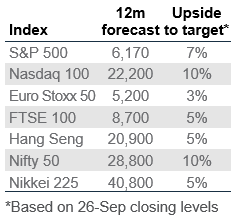
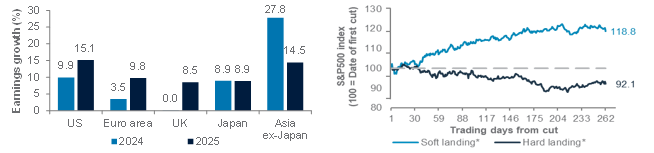
Fig. 22 US equities’ consensus earnings growth in 2025 is expected to be the highest among major markets; US equities typically perform well in a post-rate-cut soft-landing
Earnings growth across key regions in 2024 and 2025; S&P500 12m trend after past Fed rate cuts*
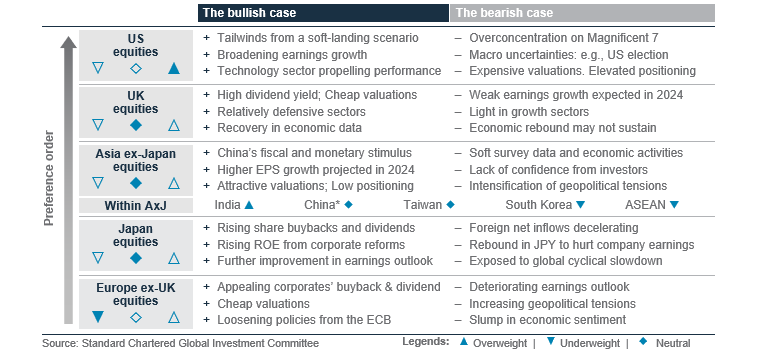
Neutral (core holding) global equities
Policy rate cuts across major central banks, especially the Fed, support our expectations of a soft-landing in the US economy. This would sustain positive earnings growth projections across corporates. While we are positive on a 12-month horizon, we anticipate uncertainties for global equities heading into Q4, ahead of the US presidential election and potential geopolitical tensions. We see global equities as a core holding (Neutral) relative to bonds and expect them to outperform cash.
Overweight US equities
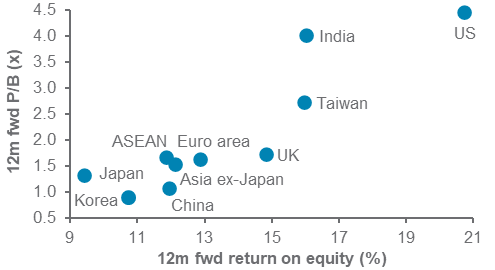
We are Overweight US equities. Expectations of further rate cuts in 2024-2025 should support the valuation of growth stocks by raising the value of discounted future earnings. In addition, we believe a lowering of borrowing costs for consumers and corporates is likely to boost consumption and investments, a tailwind for corporate earnings. In our view, US equities’ elevated return on equity (ROE) justifies its high valuation premium. The consensus EPS growth of 9.9% in 2024 and 15.1% in 2025 is also ahead of other developed markets (DMs).
Fig. 23 US and India equities are expensive, but arguably justified by their high return on equity
12m fwd P/B vs. ROE
Neutral (core holding) Japan equities
Japan equities remain a core holding. We continue to see positive catalysts including rising share buybacks and dividends. Domestic inflows from the Nippon Individual Savings Account (NISA) are also supportive, and robust cash savings offer significant potential for further inflows. Further appreciation of the JPY may dampen earnings projections for Japan corporates, given their exposure to foreign earnings. However, this would be mitigated by a stronger JPY for USD based investors, as is evident from recent share price movements. We also expect potential volatility and uncertainty with Japan’s transition to a new prime minister. Following a rapid re-rating in late 2023, we expect Japan equities to perform in line with global equities now.
Neutral (core holding) Asia ex-Japan equities
We see Asia ex-Japan equities as a core holding. On the positive side, the region’s earnings growth remains elevated
at 27.8% in 2024. However, US-China geopolitical tensions could intensify, triggering near-term headwinds.
We are Overweight India equities within the region. We see the robust share price momentum driven by India’s strong economic and earnings growth justifying the region’s valuation premium. We favour large-cap equities amid less stretched valuations compared with small/mid-caps.
We are Neutral Taiwan equities as we expect consolidation after a strong rally since the start of the year. We downgrade Korea to Underweight as price momentum has been poor amid market concerns about its significant exposure to weak demand for memory semiconductor chips.
We view China equities as a core holding. The latest cuts in key policy rates and bank reserve requirements are expected to improve consumer sentiment and support the stock market. However, we believe property sector issues to continue to weigh on corporate earnings revisions, especially with ongoing disinflation worries. Geopolitical concerns in the run-up to US elections are also a headwind for offshore China equities. We are Underweight ASEAN as we believe it is overly defensive, and lower rates could weigh on the financial sector, which is the largest sector in ASEAN.
Neutral UK Equities (core holding)
UK equities remain a core holding. Receding price pressures, alongside the BoE’s initiation of a rate cutting cycle, are expected to support continued economic growth and improve investor confidence. In addition, valuations are attractive, with the MSCI UK index trading at a 12m forward P/E of 11.7x, below its long-term average. A dividend yield of 3.9% is also the highest across major equity markets. That said, the defensive nature of UK equities would likely limit its upside as global macro conditions remain resilient, in our view.
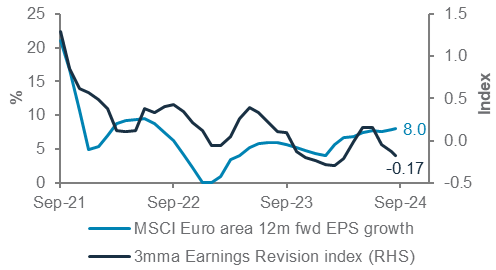
Fig. 24 Euro area equities are facing more earnings downgrades than upgrades
12m fwd EPS growth and Earnings Revision index of MSCI Euro area index
Underweight Europe ex-UK equities
We are Underweight Europe ex-UK equities. Its cyclicality makes it vulnerable to a potential slowdown in macro conditions. Continued fiscal tightening in Germany and lingering political concerns in France are also expected to weigh on equity returns.
Equity opportunistic views
|
Stay invested and diversified
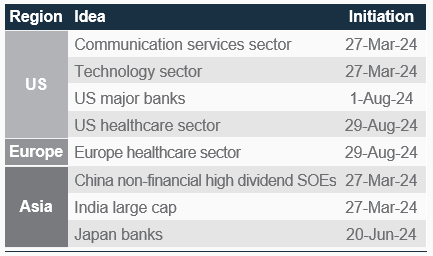
- We target positive absolute returns in our Opportunistic buy ideas. We have no changes this month, keeping our existing eight ideas open.
Ideas in the US and Europe
US technology: The start of rate cuts should ease valuation concerns on this growth sector and we look for an acceleration in earnings growth to drive the sector higher. We believe AI applications remain in the early stages while tech software offers resilient growth. Any weakness in AI spending is a risk.
US communication services: The sector’s valuation would also be supported by lower rates, while digital advertising and online entertainment drive a robust growth story. A downturn in digital advertising is a risk.
US major banks: Even as US interest rates fall, we expect a steeper yield curve to mitigate the negative impact on banks’ interest income. Major US banks also enjoy fee income growth from investment banking and capital markets. A potential Republican president could also offer deregulation tailwinds. A sharp slowdown in the US economy is a risk.
US healthcare: The sector provides defensive exposure with less volatile earnings compared with the broader market. Earnings growth remains supported by pharma companies’ robust drugs pipeline. We expect headline risks from the US election to be manageable. Adverse regulations are a risk.
Europe healthcare: The sector is similarly defensive with steady earnings growth that has historically been positive through the economic cycle. We see strong growth currently driven by oncology and obesity products, while valuation remains reasonable. Adverse regulations are a risk.
Ideas in Asia
China non-financial high dividend SOEs: We continue to prefer the income stability, amid subdued risk sentiment in China. Non-financial state-owned enterprises (SOEs) are also less likely to be impacted by the troubled property sector. Adverse regulatory changes are a risk.
India large cap stocks: These have delivered the highest absolute return among all our opportunistic buy ideas this year. We expect strong domestic growth, resilient earnings and policy continuity to continue to support further gains ahead. A risk is weaker-than-expected growth.
Japan banks: The transition to a new prime minister in Japan presents some uncertainty but we expect the independent Bank of Japan to respond to inflationary pressures by raising interest rates from a near zero level. Higher rates underpin our buy idea here as they support higher interest income for banks. A slowdown in Japan’s economic recovery is a risk.
Fig. 25 Opportunistic buy ideas
Sector views: Healthcare & technology barbell
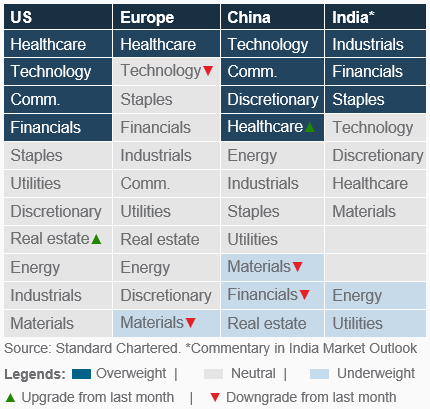
Our barbell approach continues in the US, with favoured growth sectors of technology and communication balanced by defensive healthcare. We expect US financials to outperform as a soft landing plays out. We upgrade US real estate to Neutral amid signs that rate cuts are supporting the sector’s performance. In Europe, we downgrade technology to Neutral as uncertain demand from memory chipmakers could impact the sector. We upgrade China healthcare to Overweight amid bottoming valuation, low investor positioning and a growth recovery. We downgrade materials in China and Europe to Underweight amid demand headwinds from weak construction activity. We downgrade China financials to Underweight after its outperformance and vulnerability to a peak in earnings.
Fig. 26 Our sector views by region
FX – at a glance
|
Key themes
We expect the USD index (DXY) to be largely flat over the next three months and move modestly lower over 12 months. Safe-haven demand (amid geopolitical tensions) and the US election drawing near are likely to provide near-term support to the greenback. Meanwhile, the Fed is likely to cut rates gradually until the US unemployment rate returns to neutral, which should narrow the USD yield advantage in the longer term. FX volatility remains around the 5-year average and we do not see any significant catalyst for it to rise for now.
EUR/USD likely to stabilise at 1.13 on both 3-month and 12-month horizons amid ECB-Fed policy convergence. GBP/USD is likely to edge higher to 1.35 over the next three months, underpinned by UK economic resilience.
The JPY has the most potential to strengthen further in the short and long term, with the Bank of Japan likely to continue its rate hiking cycle in sharp contrast to most other major central banks. The Swiss National Bank continued to cut rates, but significant CHF strength causing USD/CHF to break below the December 2023 low of 0.83 will likely need a fresh catalyst.
For commodity currencies, the AUD is likely to remain well-supported by a relatively more hawkish central bank and higher gold prices. Meanwhile, the NZD is likely exposed to more downside risk with the RBNZ turning dovish after its last rate cut. Gradual CAD weakness is likely to continue amid softer oil prices. Our US Dollar view is modestly positive for EM currencies.
Key chart
Fed is expected to cut rates faster than most other major central banks until year-end, which should lead to the AUD and JPY appreciating vs the USD in the next three months
Fig. 27 Rate cut expectations limit USD strength
Market-implied policy rate changes till Dec 2024*; Table of forecasts
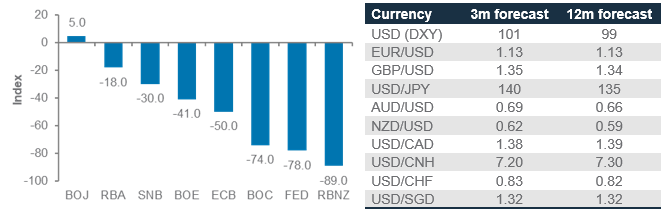
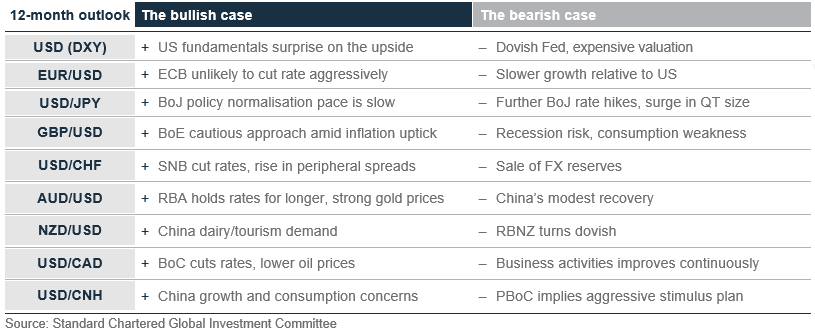
Fig. 28 Summary of major currency drivers
The wait is over
Yield curve steepening likely to result in a weaker USD. As the Fed embarks on its easing cycle, we expect the US yield curve to steepen with short-term yields falling somewhat faster than long-term yields. This is an environment that is normally associated with a weaker US Dollar and acts as a tailwind for non-dollar currencies.
European currencies likely to prove resilient. We expect the ECB to cut rates by another 25bps by year-end, less aggressively than the Fed. This is likely to result in a relatively resilient EUR/USD. We see EUR/USD at 1.13 over the next three and 12 months. The GBP is likely to rebound and test 1.35 over the next three months as macroeconomic data improves modestly and inflation and wage growth remains high. Thereafter, we expect the Bank of England to play catch up, limiting further gains.
JPY remains on a strengthening path. The BoJ is the only central bank still hiking rates. We view this as supportive of the JPY as the carry trade (borrowing in a low yielding currency to invest in a higher yielding asset) continues to unwind. We expect USD/JPY to fall further to 135 over the next 12 months. There is a risk some of this strength spills over to other low yielding currencies unless this factor is overcome by a soft US Dollar.
Modest downside for USD-CHF. The SNB officials seem to have lost their appetite for a stronger franc recently. This was foreshadowed by an announcement late last year that intervention can now happen in both directions. This suggests that Swiss officials have not seen much reason to steer the franc in either direction.
Fig. 29 SNB can intervene in FX market to stabilise CHF
USD/CHF and SNB FX transactions
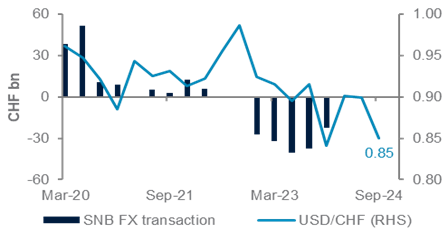
Also, with SNB rates approaching the central bank’s own estimate of neutral, especially after the latest cut, the SNB will not be able to continue matching other central banks’ cuts for long. This is why we see USD/CHF moving slightly lower to 0.83 over 1-3 months and 0.82 over the next 12 months.
AUD/USD should remain well-supported over the next 3 months with direct and portfolio investment inflows. However, the pair is likely to test 0.66 in 6-12 months’ time once RBA starts to cut rate in Q1 25. The NZD and CAD are expected to be relatively weak on further easing and softer oil prices.
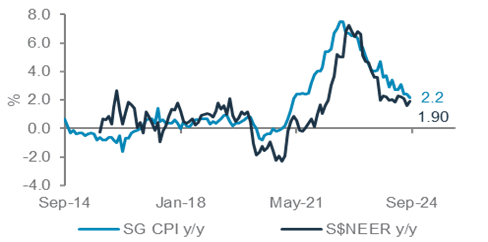
Fig. 30 SGD nominal effective exchange rate (S$NEER) has been easing alongside cooling inflation
Singapore inflation and SGD nominal exchange rate change
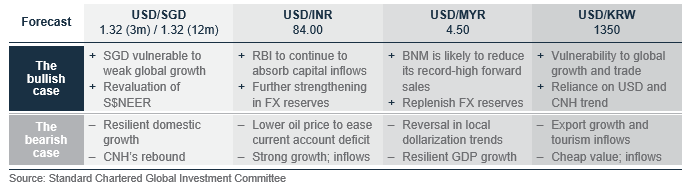
USD/CNH, USD/SGD expected to bounce, USD/INR stable. The PBoC announced a series of easing measures to stimulate the economy. We expect USD/CNH to rise to 7.20 in three months and 7.30 in 12 months as both policy rates and reserve ratios are reduced.
In Singapore, where monetary policy targets the exchange rate instead of the interest rate, the nominal effective exchange rate is around 1.5% above the estimated mid-point of the policy range. We expect it to fall within this range as inflation softens, pushing USD/SGD to 1.32 in three and twelve months time.
We expect USD/INR to remain stable around 84 over the next 12 months. While significant fund inflows to equity and bond markets places upward pressure on the currency, the RBI is likely to continue purchasing US Dollars to add to reserves with the goal of currency stability.
Fig. 31 Summary of Asian currency drivers
Gold, crude oil – at a glance
|
Key themes
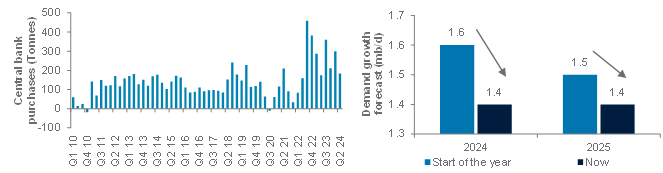
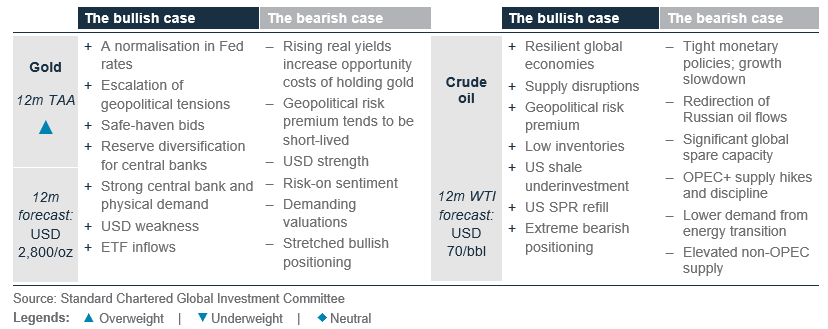
We raise our 3- and 12-month gold price forecast to USD 2,600/oz and USD 2,800/oz, respectively, while retaining gold as an Overweight relative to equities, bonds and cash. Gold prices charged higher to new all-time highs in September as the Fed commenced its rate cutting cycle with a jumbo 50bps cut. While expectations of Fed and other central bank rate cuts may be largely priced into the market, they could still provide some boost to gold prices when implemented. Consequently, global gold ETF inflows would also enjoy an uplift. Robust official sector purchases have been a strong anchor of demand in the recent years. The latest Q2 data continued to reflect that – central bank purchases in the first half of this year are the largest since the turn of the century. Given the structural nature of central banks’ demand, we see that sustaining heading into 2025.
We lower our 12-month WTI oil forecast to USD 70/bbl on rising growth and supply risks. Crude oil prices slumped this month, driven by growing demand concerns amid a slew of soft data and pessimistic outlook. Concurrently, positioning has declined to a near-record short. While our base case is not a recession, we believe the global economy could cool further, weighing on oil demand. The demand-supply balance is likely to turn to a surplus, especially as the OPEC+ begins its recently delayed tapering plan in December. Reports of Saudi Arabia shifting from targeting price to market share is also an upside risk to supply. In the near term, we see WTI oil trading at around USD 70/bbl, albeit with some volatility. Firstly, the extreme bearish oil position is prone to a reversal. Secondly, geopolitical tensions, particularly in the Middle East, could escalate. Thirdly, the new agreement between rival Libyan factions to appoint a new central bank governor may see more than 500kb/d of supply returning to market.
Key chart
Official sector demand is likely to sustain heading into 2025
Weaker growth environment is weighing on crude oil demand
Fig. 32 Central bank purchases in H1 24 are the largest since 2000; Global oil demand growth forecasts have been revised lower over the course of this year
LHS chart: Quarterly central bank purchases
RHS chart: 2024 and 2025 global oil demand growth forecasts*
Additional perspectives
Quant perspective
Bullish tilt to equities signals a soft-landing scenario
|
|
||||
Summary
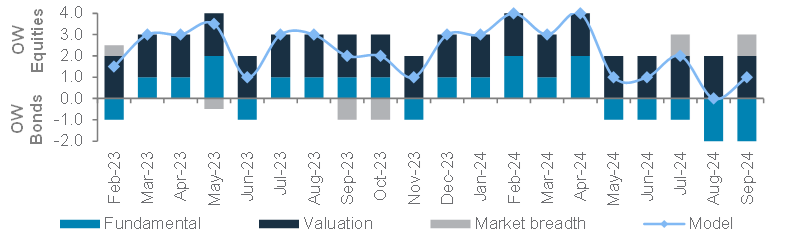
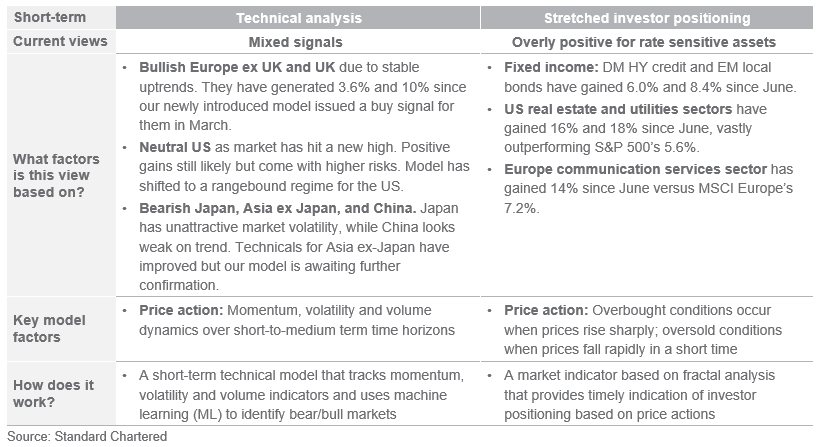
The stock-bond model remains slightly Overweight equities despite weak fundamentals. The model recorded an absolute YTD return of 16.3%, or 3.3% outperformance relative to a 60-40 equity-bond portfolio. The gains were driven by the model’s overweight to equities, which were boosted by the Fed’s 50bps rate cut. However, valuation and market breadth factors are the only support behind the equity overweight, as fundamentals like ISM manufacturing new orders, economic surprise index and net earnings upgrades are all indicating a slowdown. Our projection shows the valuation factors will turn neutral by March-2025 as the 12-month forward price-to-earnings ratio for Developed Market equities will look expensive at more than 2 standard deviations above their historical average. This would lead to a neutral model allocation to equities and bonds if fundamental and market breadth factors remain unchanged.
Our technical model suggests higher short-term risks in S&P500 and remains bearish on Asian equities (in USD terms). Historically, the S&P500 can still generate positive return when our model signals a rangebound regime, but this usually comes with higher near-term volatility. With the S&P500 breaking above its psychological level of 5,667 after the Fed’s jumbo rate cut, the risk of a sharp reversal is reduced. The key support to watch for is 5,503 (or 4.2% below the current level). Meanwhile, our models remain most bearish on Japan equities, followed by China and Asia ex-Japan due to inferior price trends. Europe ex-UK and UK equities remain the most favoured as their price trends remain steady, and the weaker USD has helped with USD gains.
Our market diversity indicator is flagging risks of near-term consolidation in interest rate sensitive assets that have generated strong gains since June. The assets that are flagged for overly positive positioning, include DM High Yield credit, EM local currency bonds, US utilities and real estate sectors, and Europe communication services sector, which have gained 6%, 8.4%, 18%, 16% and 14%, respectively, since June.
Key chart
Stock-bond model’s score dropped to 0 at end of August before rising back to +1 as market breadth factors turned bullish.
Fig. 33 Breakdown of stock-bond rotation model’s scores since inception in February 2023
Model scores as the total of fundamental, valuation and market breadth factors
Historically, S&P500 can still generate positive returns in a rangebound regime, but they come with higher market risks
Fig. 34 Technical model signalling rangebound for S&P500
S&P500 broke above resistance after the Fed’s 50 bps rate cut
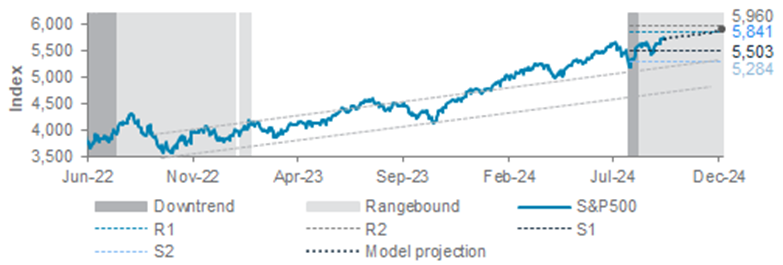
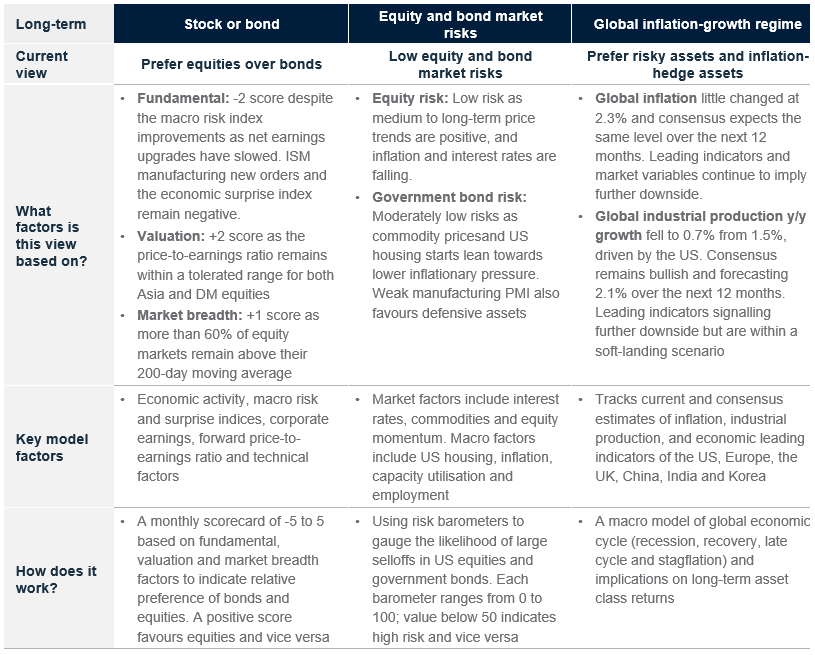
Fig. 35 Long- and short-term quantitative models are bullish risky assets
Long-term models below have a typical time horizon of 3–6 months, while short-term models have a 1–3 months horizon
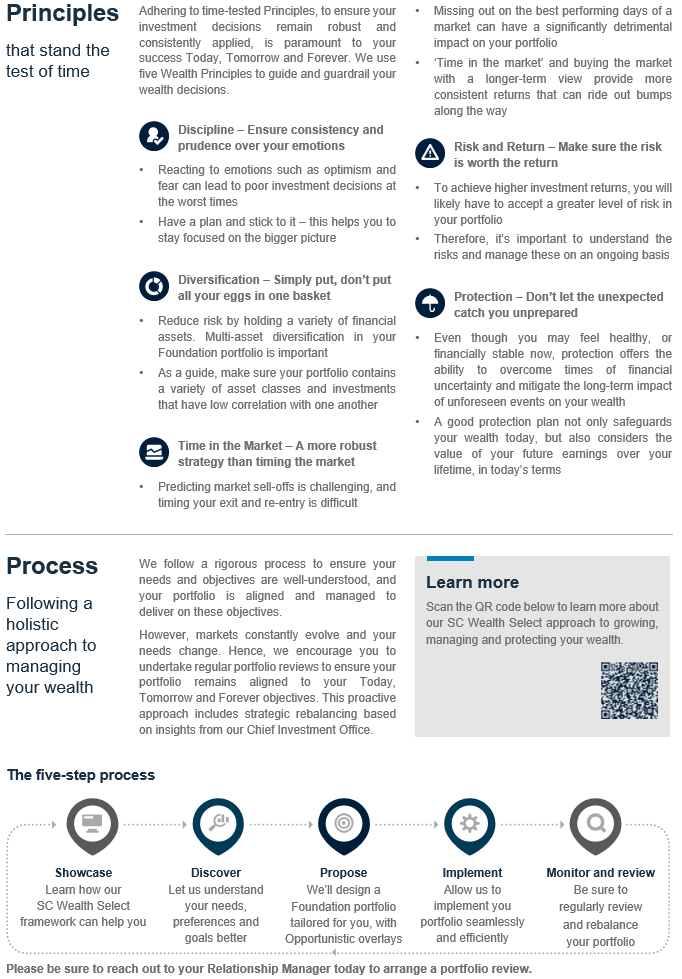
Today, Tomorrow and Forever

Performance Review
Foundation: Asset allocation summary
Foundation+: Asset allocation summary
Market performance summary
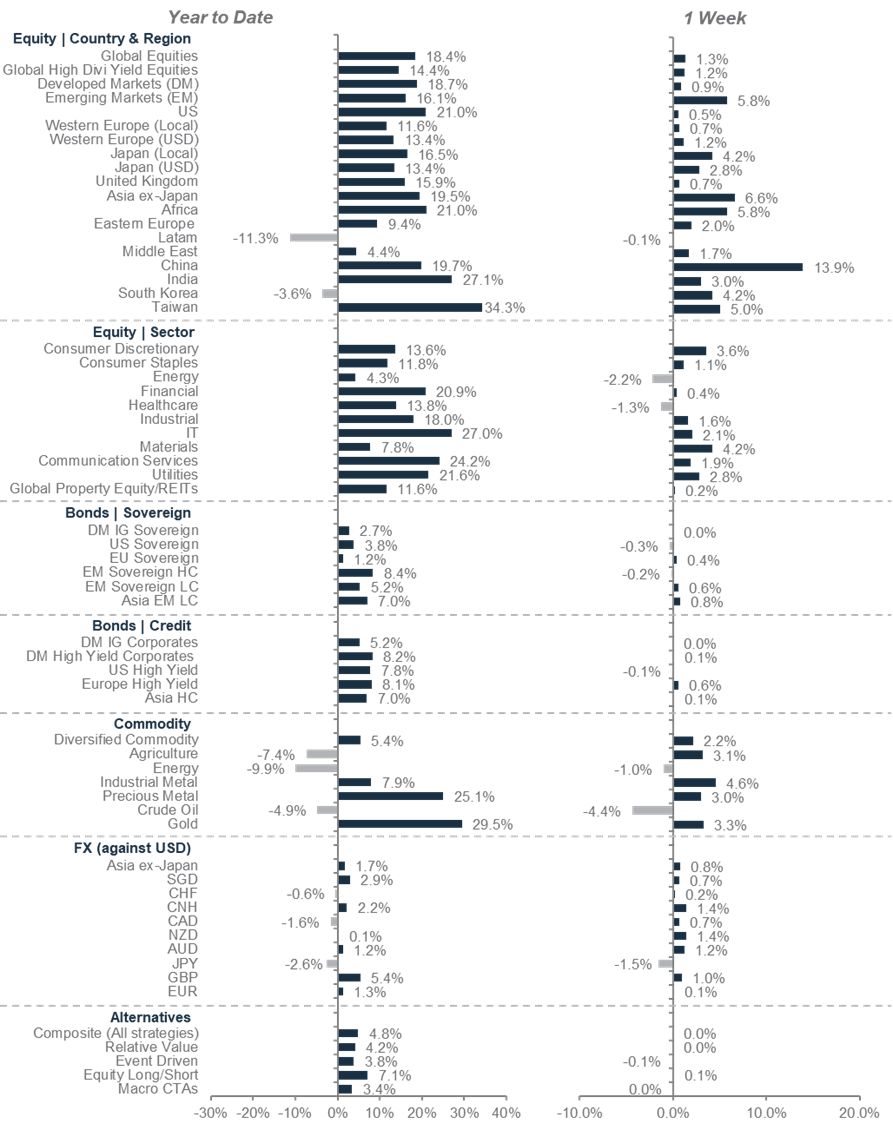
*All performance shown in USD terms, unless otherwise stated
*YTD performance data from 31 December 2023 to 26 September 2024; 1-week performance from 19 September 2024 to 26 September 2024
Our key forecasts and calendar events
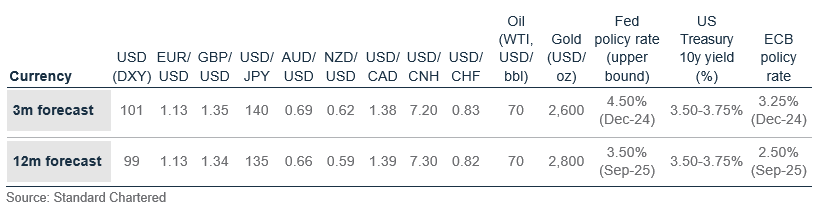
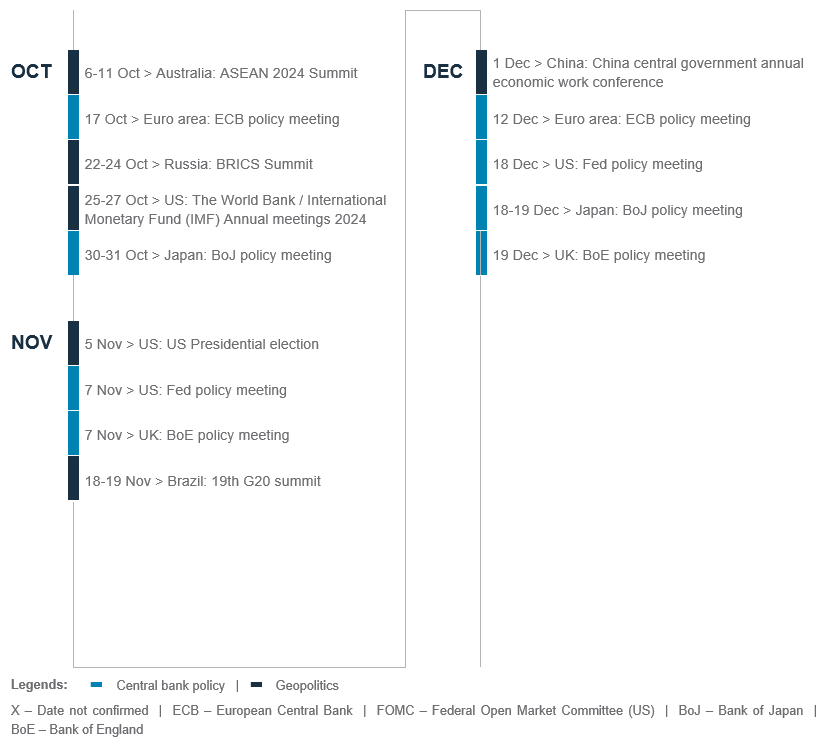

Explanatory notes
1. The figures on page 5 show allocations for a moderately aggressive risk profile only – different risk profiles may produce significantly different asset allocation results. Page 5 is only an example, provided for general information only and they do not constitute investment advice, an offer, recommendation or solicitation. They do not take into account the specific investment objectives, needs or risk tolerances of a particular person or class of persons and they have not been prepared for any particular person or class of persons.
2. Contingent Convertibles are complex financial instruments and are not a suitable or appropriate investment for all investors. This document is not an offer to sell or an invitation to buy any securities or any beneficial interests therein. Contingent convertible securities are not intended to be sold and should not be sold to retail clients in the European Economic Area (EEA) (each as defined in the Policy Statement on the Restrictions on the Retail Distribution of Regulatory Capital Instruments (Feedback to CP14/23 and Final Rules) (“Policy Statement”), read together with the Product Intervention (Contingent Convertible Instruments and Mutual Society Shares) Instrument 2015 (“Instrument”, and together with the Policy Statement, the “Permanent Marketing Restrictions”), which were published by the United Kingdom’s Financial Conduct Authority in June 2015), other than in circumstances that do not give rise to a contravention of the Permanent Marketing Restrictions.
Disclosure
This document is confidential and may also be privileged. If you are not the intended recipient, please destroy all copies and notify the sender immediately. This document is being distributed for general information only and is subject to the relevant disclaimers available at our Standard Chartered website under Regulatory disclosures. It is not and does not constitute research material, independent research, an offer, recommendation or solicitation to enter into any transaction or adopt any hedging, trading or investment strategy, in relation to any securities or other financial instruments. This document is for general evaluation only. It does not take into account the specific investment objectives, financial situation or particular needs of any particular person or class of persons and it has not been prepared for any particular person or class of persons. You should not rely on any contents of this document in making any investment decisions. Before making any investment, you should carefully read the relevant offering documents and seek independent legal, tax and regulatory advice. In particular, we recommend you to seek advice regarding the suitability of the investment product, taking into account your specific investment objectives, financial situation or particular needs, before you make a commitment to purchase the investment product. Opinions, projections and estimates are solely those of SC at the date of this document and subject to change without notice. Past performance is not indicative of future results and no representation or warranty is made regarding future performance. The value of investments, and the income from them, can go down as well as up, and you may not recover the amount of your original investment. You are not certain to make a profit and may lose money. Any forecast contained herein as to likely future movements in rates or prices or likely future events or occurrences constitutes an opinion only and is not indicative of actual future movements in rates or prices or actual future events or occurrences (as the case may be). This document must not be forwarded or otherwise made available to any other person without the express written consent of the Standard Chartered Group (as defined below). Standard Chartered Bank is incorporated in England with limited liability by Royal Charter 1853 Reference Number ZC18. The Principal Office of the Company is situated in England at 1 Basinghall Avenue, London, EC2V 5DD. Standard Chartered Bank is authorised by the Prudential Regulation Authority and regulated by the Financial Conduct Authority and Prudential Regulation Authority. Standard Chartered PLC, the ultimate parent company of Standard Chartered Bank, together with its subsidiaries and affiliates (including each branch or representative office), form the Standard Chartered Group. Standard Chartered Global Private Bank is the private banking division of Standard Chartered. Private banking activities may be carried out internationally by different legal entities and affiliates within the Standard Chartered Group (each an “SC Group Entity”) according to local regulatory requirements. Not all products and services are provided by all branches, subsidiaries and affiliates within the Standard Chartered Group. Some of the SC Group Entities only act as representatives of Standard Chartered Global Private Bank and may not be able to offer products and services or offer advice to clients.
Copyright © 2026, Accounting Research & Analytics, LLC d/b/a CFRA (and its affiliates, as applicable). Reproduction of content provided by CFRA in any form is prohibited except with the prior written permission of CFRA. CFRA content is not investment advice and a reference to or observation concerning a security or investment provided in the CFRA SERVICES is not a recommendation to buy, sell or hold such investment or security or make any other investment decisions. The CFRA content contains opinions of CFRA based upon publicly-available information that CFRA believes to be reliable and the opinions are subject to change without notice. This analysis has not been submitted to, nor received approval from, the United States Securities and Exchange Commission or any other regulatory body. While CFRA exercised due care in compiling this analysis, CFRA, ITS THIRD-PARTY SUPPLIERS, AND ALL RELATED ENTITIES SPECIFICALLY DISCLAIM ALL WARRANTIES, EXPRESS OR IMPLIED, INCLUDING, BUT NOT LIMITED TO, ANY WARRANTIES OF MERCHANTABILITY OR FITNESS FOR A PARTICULAR PURPOSE OR USE, to the full extent permitted by law, regarding the accuracy, completeness, or usefulness of this information and assumes no liability with respect to the consequences of relying on this information for investment or other purposes. No content provided by CFRA (including ratings, credit-related analyses and data, valuations, model, software or other application or output therefrom) or any part thereof may be modified, reverse engineered, reproduced or distributed in any form by any means, or stored in a database or retrieval system, without the prior written permission of CFRA, and such content shall not be used for any unlawful or unauthorized purposes. CFRA and any third-party providers, as well as their directors, officers, shareholders, employees or agents do not guarantee the accuracy, completeness, timeliness or availability of such content. In no event shall CFRA, its affiliates, or their third-party suppliers be liable for any direct, indirect, special, or consequential damages, costs, expenses, legal fees, or losses (including lost income or lost profit and opportunity costs) in connection with a subscriber’s, subscriber’s customer’s, or other’s use of CFRA’s content.
Market Abuse Regulation (MAR) Disclaimer
Banking activities may be carried out internationally by different branches, subsidiaries and affiliates within the Standard Chartered Group according to local regulatory requirements. Opinions may contain outright “buy”, “sell”, “hold” or other opinions. The time horizon of this opinion is dependent on prevailing market conditions and there is no planned frequency for updates to the opinion. This opinion is not independent of Standard Chartered Group’s trading strategies or positions. Standard Chartered Group and/or its affiliates or its respective officers, directors, employee benefit programmes or employees, including persons involved in the preparation or issuance of this document may at any time, to the extent permitted by applicable law and/or regulation, be long or short any securities or financial instruments referred to in this document or have material interest in any such securities or related investments. Therefore, it is possible, and you should assume, that Standard Chartered Group has a material interest in one or more of the financial instruments mentioned herein. Please refer to our Standard Chartered website under Regulatory disclosures for more detailed disclosures, including past opinions/ recommendations in the last 12 months and conflict of interests, as well as disclaimers. A covering strategist may have a financial interest in the debt or equity securities of this company/issuer. All covering strategist are licensed to provide investment recommendations under Monetary Authority of Singapore or Hong Kong Monetary Authority. This document must not be forwarded or otherwise made available to any other person without the express written consent of Standard Chartered Group.
Sustainable Investments
Any ESG data used or referred to has been provided by Morningstar, Sustainalytics, MSCI or Bloomberg. Refer to 1) Morningstar website under Sustainable Investing, 2) Sustainalytics website under ESG Risk Ratings, 3) MCSI website under ESG Business Involvement Screening Research and 4) Bloomberg green, social & sustainability bonds guide for more information. The ESG data is as at the date of publication based on data provided, is for informational purpose only and is not warranted to be complete, timely, accurate or suitable for a particular purpose, and it may be subject to change. The ESG data providers may not provide data coverage of all companies or securities in our Sustainable Investment Universe or Fund Select funds. As a result, a small subset of companies or securities will not be in scope for exclusionary screening. Sustainable Investments (SI): This refers to funds that have been classified as ‘ESG Intentional Investments – Overall’ by Morningstar. SI funds have explicitly stated in their prospectus and regulatory filings that they either incorporate ESG factors into the investment process or have a thematic focus on the environment, gender diversity, low carbon, renewable energy, water or community development. For equity, it refers to shares/stocks issued by companies with Sustainalytics ESG Risk Rating of Low/Negligible. For bonds, it refers to debt instruments issued by issuers with Sustainalytics ESG Risk Rating of Low/Negligible, and/or those being certified green, social, sustainable bonds by Bloomberg. For structured products, it refers to products that are issued by any issuer who has a Sustainable Finance framework that aligns with Standard Chartered’s Green and Sustainable Product Framework, with underlying assets that are part of the Sustainable Investment universe or separately approved by Standard Chartered’s Sustainable Finance Governance Committee. Sustainalytics ESG risk ratings shown are factual and are not an indicator that the product is classified or marketed as “green”, “sustainable” or similar under any particular classification system or framework.
Shariah (“Shariah Compliant or Shariah Compliance”)
For any reason to enter only into transactions which comply or are consistent with the principles of the Shariah, the client certifies that he/she/it has made his /her/its own investigation into and satisfied itself as to the Shariah compliance of the Islamic security and all necessary action to confirm that the Islamic security is Shariah compliant has been taken (including the obtaining of a fatwa, where required) and the Client will not claim any dispute on the grounds of any lack of Shariah compliance of these investments. The Client has not relied on Standard Chartered Group or any written declaration, fatwa, opinion or other documents prepared by, on behalf or at the request of Standard Chartered Group for the purposes of a determination or confirmation that these instruments are Shariah compliant.
Country/Market Specific Disclosures
Bahrain: This document is being distributed in Bahrain by Standard Chartered Bank, Bahrain Branch, having its address at P.O. 29, Manama, Kingdom of Bahrain, is a branch of Standard Chartered Bank and is licensed by the Central Bank of Bahrain as a conventional retail bank. Botswana: This document is being distributed in Botswana by, and is attributable to, Standard Chartered Bank Botswana Limited which is a financial institution licensed under the Section 6 of the Banking Act CAP 46.04 and is listed in the Botswana Stock Exchange. Brunei Darussalam: This document is being distributed in Brunei Darussalam by, and is attributable to, Standard Chartered Bank (Brunei Branch) | Registration Number RFC/61 and Standard Chartered Securities (B) Sdn Bhd | Registration Number RC20001003. Standard Chartered Bank is incorporated in England with limited liability by Royal Charter 1853 Reference Number ZC18. Standard Chartered Securities (B) Sdn Bhd is a limited liability company registered with the Registry of Companies with Registration Number RC20001003 and licensed by Brunei Darussalam Central Bank as a Capital Markets Service License Holder with License Number BDCB/R/CMU/S3-CL and it is authorised to conduct Islamic investment business through an Islamic window. China Mainland: This document is being distributed in China by, and is attributable to, Standard Chartered Bank (China) Limited which is mainly regulated by National Financial Regulatory Administration (NFRA), State Administration of Foreign Exchange (SAFE), and People’s Bank of China (PBOC). Hong Kong: In Hong Kong, this document, except for any portion advising on or facilitating any decision on futures contracts trading, is distributed by Standard Chartered Bank (Hong Kong) Limited (“SCBHK”), a subsidiary of Standard Chartered PLC. SCBHK has its registered address at 32/F, Standard Chartered Bank Building, 4-4A Des Voeux Road Central, Hong Kong and is regulated by the Hong Kong Monetary Authority and registered with the Securities and Futures Commission (“SFC”) to carry on Type 1 (dealing in securities), Type 4 (advising on securities), Type 6 (advising on corporate finance) and Type 9 (asset management) regulated activity under the Securities and Futures Ordinance (Cap. 571) (“SFO”) (CE No. AJI614). The contents of this document have not been reviewed by any regulatory authority in Hong Kong and you are advised to exercise caution in relation to any offer set out herein. If you are in doubt about any of the contents of this document, you should obtain independent professional advice. Any product named herein may not be offered or sold in Hong Kong by means of any document at any time other than to “professional investors” as defined in the SFO and any rules made under that ordinance. In addition, this document may not be issued or possessed for the purposes of issue, whether in Hong Kong or elsewhere, and any interests may not be disposed of, to any person unless such person is outside Hong Kong or is a “professional investor” as defined in the SFO and any rules made under that ordinance, or as otherwise may be permitted by that ordinance. In Hong Kong, Standard Chartered Global Private Bank is the private banking division of SCBHK, a subsidiary of Standard Chartered PLC. Ghana: Standard Chartered Bank Ghana Limited accepts no liability and will not be liable for any loss or damage arising directly or indirectly (including special, incidental or consequential loss or damage) from your use of these documents. Past performance is not indicative of future results and no representation or warranty is made regarding future performance. You should seek advice from a financial adviser on the suitability of an investment for you, taking into account these factors before making a commitment to invest in an investment. To unsubscribe from receiving further updates, please send an email to feedback.ghana@sc.com. Please do not reply to this email. Call our Priority Banking on 0302610750 for any questions or service queries. You are advised not to send any confidential and/or important information to Standard Chartered via e-mail, as Standard Chartered makes no representations or warranties as to the security or accuracy of any information transmitted via e-mail. Standard Chartered shall not be responsible for any loss or damage suffered by you arising from your decision to use e-mail to communicate with the Bank. India: This document is being distributed in India by Standard Chartered in its capacity as a distributor of mutual funds and referrer of any other third party financial products. Standard Chartered does not offer any ‘Investment Advice’ as defined in the Securities and Exchange Board of India (Investment Advisers) Regulations, 2013 or otherwise. Services/products related securities business offered by Standard Charted are not intended for any person, who is a resident of any jurisdiction, the laws of which imposes prohibition on soliciting the securities business in that jurisdiction without going through the registration requirements and/or prohibit the use of any information contained in this document. Indonesia: This document is being distributed in Indonesia by Standard Chartered Bank, Indonesia branch, which is a financial institution licensed and supervised by Otoritas Jasa Keuangan (Financial Service Authority) and Bank Indonesia. Jersey: In Jersey, Standard Chartered Global Private Bank is the Registered Business Name of the Jersey Branch of Standard Chartered Bank. The Jersey Branch of Standard Chartered Bank is regulated by the Jersey Financial Services Commission. Copies of the latest audited accounts of Standard Chartered Bank are available from its principal place of business in Jersey: PO Box 80, 15 Castle Street, St Helier, Jersey JE4 8PT. Standard Chartered Bank is incorporated in England with limited liability by Royal Charter in 1853 Reference Number ZC 18. The Principal Office of the Company is situated in England at 1 Basinghall Avenue, London, EC2V 5DD. Standard Chartered Bank is authorised by the Prudential Regulation Authority and regulated by the Financial Conduct Authority and Prudential Regulation Authority. The Jersey Branch of Standard Chartered Bank is also an authorised financial services provider under license number 44946 issued by the Financial Sector Conduct Authority of the Republic of South Africa. Jersey is not part of the United Kingdom and all business transacted with Standard Chartered Bank, Jersey Branch and other SC Group Entity outside of the United Kingdom, are not subject to some or any of the investor protection and compensation schemes available under United Kingdom law. Kenya: This document is being distributed in Kenya by and is attributable to Standard Chartered Bank Kenya Limited. Investment Products and Services are distributed by Standard Chartered Investment Services Limited, a wholly owned subsidiary of Standard Chartered Bank Kenya Limited that is licensed by the Capital Markets Authority in Kenya, as a Fund Manager. Standard Chartered Bank Kenya Limited is regulated by the Central Bank of Kenya. Malaysia: This document is being distributed in Malaysia by Standard Chartered Bank Malaysia Berhad (“SCBMB”). Recipients in Malaysia should contact SCBMB in relation to any matters arising from, or in connection with, this document. This document has not been reviewed by the Securities Commission Malaysia. The product lodgement, registration, submission or approval by the Securities Commission of Malaysia does not amount to nor indicate recommendation or endorsement of the product, service or promotional activity. Investment products are not deposits and are not obligations of, not guaranteed by, and not protected by SCBMB or any of the affiliates or subsidiaries, or by Perbadanan Insurans Deposit Malaysia, any government or insurance agency. Investment products are subject to investment risks, including the possible loss of the principal amount invested. SCBMB expressly disclaim any liability and responsibility for any loss arising directly or indirectly (including special, incidental or consequential loss or damage) arising from the financial losses of the Investment Products due to market condition. Nigeria: This document is being distributed in Nigeria by Standard Chartered Bank Nigeria Limited (SCB Nigeria), a bank duly licensed and regulated by the Central Bank of Nigeria. SCB Nigeria accepts no liability for any loss or damage arising directly or indirectly (including special, incidental or consequential loss or damage) from your use of these documents. You should seek advice from a financial adviser on the suitability of an investment for you, taking into account these factors before making a commitment to invest in an investment. To unsubscribe from receiving further updates, please send an email to clientcare.ng@sc.com requesting to be removed from our mailing list. Please do not reply to this email. Call our Priority Banking on 02 012772514 for any questions or service queries. SCB Nigeria shall not be responsible for any loss or damage arising from your decision to send confidential and/or important information to Standard Chartered via e-mail. SCB Nigeria makes no representations or warranties as to the security or accuracy of any information transmitted via e-mail. Pakistan: This document is being distributed in Pakistan by, and attributable to Standard Chartered Bank (Pakistan) Limited having its registered office at PO Box 5556, I.I Chundrigar Road Karachi, which is a banking company registered with State Bank of Pakistan under Banking Companies Ordinance 1962 and is also having licensed issued by Securities & Exchange Commission of Pakistan for Security Advisors. Standard Chartered Bank (Pakistan) Limited acts as a distributor of mutual funds and referrer of other third-party financial products. Singapore: This document is being distributed in Singapore by, and is attributable to, Standard Chartered Bank (Singapore) Limited (Registration No. 201224747C/ GST Group Registration No. MR-8500053-0, “SCBSL”). Recipients in Singapore should contact SCBSL in relation to any matters arising from, or in connection with, this document. SCBSL is an indirect wholly owned subsidiary of Standard Chartered Bank and is licensed to conduct banking business in Singapore under the Singapore Banking Act, 1970. Standard Chartered Global Private Bank is the private banking division of SCBSL. IN RELATION TO ANY SECURITY OR SECURITIES-BASED DERIVATIVES CONTRACT REFERRED TO IN THIS DOCUMENT, THIS DOCUMENT, TOGETHER WITH THE ISSUER DOCUMENTATION, SHALL BE DEEMED AN INFORMATION MEMORANDUM (AS DEFINED IN SECTION 275 OF THE SECURITIES AND FUTURES ACT, 2001 (“SFA”)). THIS DOCUMENT IS INTENDED FOR DISTRIBUTION TO ACCREDITED INVESTORS, AS DEFINED IN SECTION 4A(1)(a) OF THE SFA, OR ON THE BASIS THAT THE SECURITY OR SECURITIES-BASED DERIVATIVES CONTRACT MAY ONLY BE ACQUIRED AT A CONSIDERATION OF NOT LESS THAN S$200,000 (OR ITS EQUIVALENT IN A FOREIGN CURRENCY) FOR EACH TRANSACTION. Further, in relation to any security or securities-based derivatives contract, neither this document nor the Issuer Documentation has been registered as a prospectus with the Monetary Authority of Singapore under the SFA. Accordingly, this document and any other document or material in connection with the offer or sale, or invitation for subscription or purchase, of the product may not be circulated or distributed, nor may the product be offered or sold, or be made the subject of an invitation for subscription or purchase, whether directly or indirectly, to persons other than a relevant person pursuant to section 275(1) of the SFA, or any person pursuant to section 275(1A) of the SFA, and in accordance with the conditions specified in section 275 of the SFA, or pursuant to, and in accordance with the conditions of, any other applicable provision of the SFA. In relation to any collective investment schemes referred to in this document, this document is for general information purposes only and is not an offering document or prospectus (as defined in the SFA). This document is not, nor is it intended to be (i) an offer or solicitation of an offer to buy or sell any capital markets product; or (ii) an advertisement of an offer or intended offer of any capital markets product. Deposit Insurance Scheme: Singapore dollar deposits of non-bank depositors are insured by the Singapore Deposit Insurance Corporation, for up to S$100,000 in aggregate per depositor per Scheme member by law. Foreign currency deposits, dual currency investments, structured deposits and other investment products are not insured. This advertisement has not been reviewed by the Monetary Authority of Singapore. Taiwan: SC Group Entity or Standard Chartered Bank (Taiwan) Limited (“SCB (Taiwan)”) may be involved in the financial instruments contained herein or other related financial instruments. The author of this document may have discussed the information contained herein with other employees or agents of SC or SCB (Taiwan). The author and the above-mentioned employees of SC or SCB (Taiwan) may have taken related actions in respect of the information involved (including communication with customers of SC or SCB (Taiwan) as to the information contained herein). The opinions contained in this document may change, or differ from the opinions of employees of SC or SCB (Taiwan). SC and SCB (Taiwan) will not provide any notice of any changes to or differences between the above-mentioned opinions. This document may cover companies with which SC or SCB (Taiwan) seeks to do business at times and issuers of financial instruments. Therefore, investors should understand that the information contained herein may serve as specific purposes as a result of conflict of interests of SC or SCB (Taiwan). SC, SCB (Taiwan), the employees (including those who have discussions with the author) or customers of SC or SCB (Taiwan) may have an interest in the products, related financial instruments or related derivative financial products contained herein; invest in those products at various prices and on different market conditions; have different or conflicting interests in those products. The potential impacts include market makers’ related activities, such as dealing, investment, acting as agents, or performing financial or consulting services in relation to any of the products referred to in this document. UAE: DIFC – Standard Chartered Bank is incorporated in England with limited liability by Royal Charter 1853 Reference Number ZC18.The Principal Office of the Company is situated in England at 1 Basinghall Avenue, London, EC2V 5DD. Standard Chartered Bank is authorised by the Prudential Regulation Authority and regulated by the Financial Conduct Authority and Prudential Regulation Authority. Standard Chartered Bank, Dubai International Financial Centre having its offices at Dubai International Financial Centre, Building 1, Gate Precinct, P.O. Box 999, Dubai, UAE is a branch of Standard Chartered Bank and is regulated by the Dubai Financial Services Authority (“DFSA”). This document is intended for use only by Professional Clients and is not directed at Retail Clients as defined by the DFSA Rulebook. In the DIFC we are authorised to provide financial services only to clients who qualify as Professional Clients and Market Counterparties and not to Retail Clients. As a Professional Client you will not be given the higher retail client protection and compensation rights and if you use your right to be classified as a Retail Client we will be unable to provide financial services and products to you as we do not hold the required license to undertake such activities. For Islamic transactions, we are acting under the supervision of our Shariah Supervisory Committee. Relevant information on our Shariah Supervisory Committee is currently available on the Standard Chartered Bank website in the Islamic banking section. For residents of the UAE – Standard Chartered UAE (“SC UAE”) is licensed by the Central Bank of the U.A.E. SC UAE is licensed by Securities and Commodities Authority to practice Promotion Activity. SC UAE does not provide financial analysis or consultation services in or into the UAE within the meaning of UAE Securities and Commodities Authority Decision No. 48/r of 2008 concerning financial consultation and financial analysis. Uganda: Our Investment products and services are distributed by Standard Chartered Bank Uganda Limited, which is licensed by the Capital Markets Authority as an investment adviser. United Kingdom: In the UK, Standard Chartered Bank is authorised by the Prudential Regulation Authority and regulated by the Financial Conduct Authority and Prudential Regulation Authority. This communication has been approved by Standard Chartered Bank for the purposes of Section 21 (2) (b) of the United Kingdom’s Financial Services and Markets Act 2000 (“FSMA”) as amended in 2010 and 2012 only. Standard Chartered Bank (trading as Standard Chartered Global Private Bank) is also an authorised financial services provider (license number 45747) in terms of the South African Financial Advisory and Intermediary Services Act, 2002. The Materials have not been prepared in accordance with UK legal requirements designed to promote the independence of investment research, and that it is not subject to any prohibition on dealing ahead of the dissemination of investment research. Vietnam: This document is being distributed in Vietnam by, and is attributable to, Standard Chartered Bank (Vietnam) Limited which is mainly regulated by State Bank of Vietnam (SBV). Recipients in Vietnam should contact Standard Chartered Bank (Vietnam) Limited for any queries regarding any content of this document. Zambia: This document is distributed by Standard Chartered Bank Zambia Plc, a company incorporated in Zambia and registered as a commercial bank and licensed by the Bank of Zambia under the Banking and Financial Services Act Chapter 387 of the Laws of Zambia.