12 December 2025
Global Market Outlook
Global Market Outlook
Blowing bubbles?
We expect risky assets to outperform in 2026 amid an AI boom, easing fiscal and monetary policies and abating trade tensions. Gains are expected to be accompanied by greater dispersion, resulting in our preference to diversify across a wider range of asset classes centred around three key themes.
Theme #1 – Equities: Inflating markets, inflating AI debate. We expect strong AI-driven earnings growth to overcome elevated valuations, but it is time to diversify.
Theme #2 – Income: EM to trump DM bonds. EM (USD and local currency) bonds offer attractive yields and diversification from a Fed-centric outlook.
Theme #3 – Diversifiers: Chasing glitter. Gold to extend gains in 2026, but alternative strategies and currencies like JPY and CNH are key to diversification.
Risks: Fundamental or financial? AI disappointment, contagious credit event, Fed reversal or a hawkish BoJ are risks.
USD likely to weaken further in 2026
AI boom to continue
in 2026
India raised to OW alongside China
Note from our Global CIO
Discussion of an equity market bubble, led by the boom in Artificial Intelligence, is rife. However, we do not see the embedded leverage in the system being similar to the years leading into the 2008 Global Financial Crisis. Perhaps the closer comparison is the dot.com bubble in the late 1990s. However, even here, there are key differences both in terms of the magnitude of investments being made – still much lower relative to the size of the economy – and the profitability of those making the investments. Therefore, we believe there is still some way to go before we get to bubble-like proportions.
So how should I prepare for 2026?
Given we do not see a bubble forming (yet), we enter 2026 with a slight Overweight allocation to global equities.
However, it is important to try to scenario plan this in your own mind. All too often, we see clients increasing risk in their portfolios in good times, only to realise later, after severe losses, that their risk appetite is lower than that implied by their portfolio. This ‘risk drift’ can either be passive – as stocks outperform and become a higher weight in portfolios as a result – or active – with investors becoming more optimistic about the outlook after the strong performance of equities.
This leads me to the following recommendations:
If you are fully invested, ask your advisor to run different scenarios in terms of how your current portfolio (including deposits) would have performed in the 2000-03 era and in 2007-09. This will give a sense of the potential drawdown you could face if we are wrong and markets are indeed closer to the end of a bubble. If those numbers scare you, resist the urge to increase risk exposure at this point and explore different ways to diversify and bring your portfolio to a ‘sleep well’ level.
If you are earlier in your investment journey, then the risk is heightened uncertainty leads you to stop investing and maintain or build high cash deposit levels. In this scenario, the need is to stay disciplined and continue investing. The pace of investments is based on your personal comfort, but have a target asset allocation (see pages 32-33 for some examples) within a certain period – 2-3 years might make sense – and schedule investments accordingly, accelerating if and when asset classes go on sale.
Remember the key to investing is managing your emotions. Taking the above actions will help you prepare for any volatility ahead and remain invested through the cycle.

Strategy
Investment strategy and key themes
|
|
||||
|

12m Foundation Overweights:
- Global equities, gold
- US, Asia ex-Japan equities
- EM USD, LCY bonds
Opportunistic ideas – Equities
- Global gold miners^
- US technology, pharma, utilities
- India large and mid-cap*,
- China non-financial high-dividend state-owned entities, Hang Seng Technology index
- Europe banks*
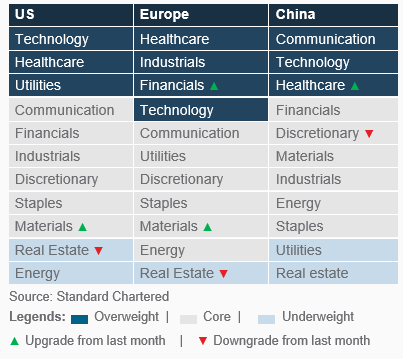
Sector Overweights:
- US: Tech, healthcare, utilities
- Europe: Healthcare, industrials, technology, financials
- China: Tech, healthcare, comm
Opportunistic ideas – Bonds
- US Treasury Inflation-Protected Securities, short-duration HY, AAA-rated CLOs*
- Asia Investment Grade (IG)
- European bank CoCos^*
Blowing bubbles?
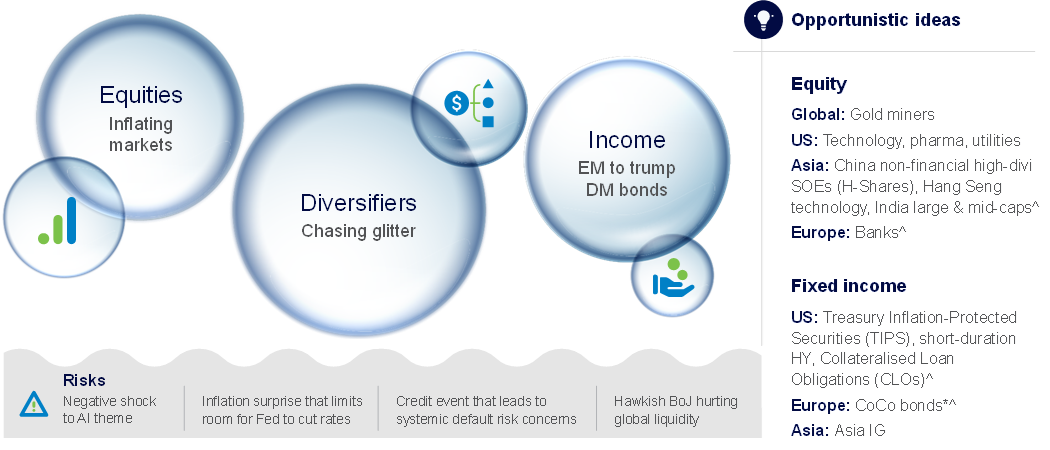
We expect risky assets to outperform in 2026 amid an AI boom, easing fiscal and monetary policies and abating trade tensions. Gains are expected to be accompanied by greater dispersion, resulting in our preference to diversify across a wider range of asset classes centred around three key themes:
- Theme #1 – Equities: Inflating markets, inflating AI debate. We expect AI-driven earnings growth to overcome elevated valuations, but it is time to diversify.
- Theme #2 – Income: EM to trump DM bonds. EM (USD and LCY) bonds offer attractive yields and diversification from a Fed-centric outlook.
- Theme #3 – Diversifiers: Chasing glitter. Gold to extend gains in 2026, but alternative strategies and currencies like JPY and CNH are key to diversification.
- Risks: Fundamental or financial? Disappointment with Artificial intelligence (AI), contagious credit event, a Fed policy reversal or a hawkish BoJ are risks.
Preparing for a hot 2026
Optimists argue equities remain in a bull market supported by strong AI-driven earnings growth, high credit quality and growth-supportive policies. Pessimists argue markets are in a bubble from a valuation standpoint, while still-hot inflation will constrain policymakers and debt challenges will result in bond yields moving higher. We expect major asset classes to continue to inflate, led by equities, but believe fatter-than-usual tails argue for planning for a wider range of scenarios. We expect financial markets in 2026 to unfold along three key themes.
01 Equities: Inflating markets, inflating AI debate
We remain constructive on equities in 2026 and expect markets to push higher through the year driven by earnings growth, led by the US and Asia ex-Japan.
Whether markets are too expensive or whether valuations are justified by earnings growth remains one of the central debates going into 2026. This debate remains disproportionately focused on US equities, and the US technology sector, in particular. We see this debate persisting through 2026, resulting in bouts of volatility when high expectations are not decisively exceeded.
Fig. 1 US technology sector performance – a result of both multiples and actual earnings growth
MSCI US technology sector – performance, earnings, P/E
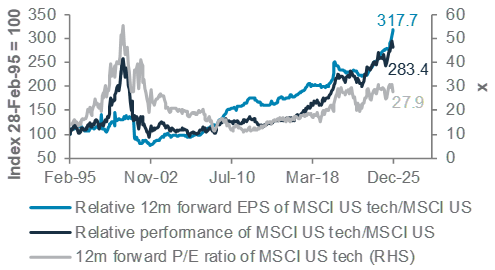
However, we see support for equities continuing as a result of (i) persistence of the ‘AI theme’, justified by strong earnings growth in the US technology sector, (ii) Fed rate
cuts, supporting economic and earnings growth, and
(iii) a weak USD, historically consistent with positive returns in risky assets.
We are not ignoring the risk presented by elevated valuations. The difficult balance for investors is to find a way to stay invested in what continues to be a theme with very strong momentum, but manage elevated valuations that make markets excessively sensitive to any disappointment. Our preferred way of achieving this is to avoid having all eggs in a single tech basket alone. We seek to do this in two ways:
One is through regional diversification. We are Overweight US equities relative to global equities, with returns led mainly by continued earnings growth from the technology sector. We balance this with an Overweight on Asia ex-Japan. While there is some spillover of the AI theme via Asia ex-Japan’s technology sector, the region also provides a route to (i) implement our weak USD view, which historically is consistent with EM outperformance, (ii) domestic policy stimulus, particularly in China and India, and (iii) equities’ exposure at more moderate valuations than US equities.
Within Asia, we are now Overweight Indian equities, which we have added as a new opportunistic idea. Policy reforms and reports of progress on a US-India trade deal are likely to provide catalysts. There is also front-loaded fiscal and monetary policy stimulus which should revive earnings growth and reverse Indian equities’ sizeable (around 20%) YTD underperformance relative to Asia ex-Japan peers.
We remain Overweight Chinese equities, with a preference for offshore markets. We expect targeted policy stimulus and strong earnings growth related to the AI theme to provide strong support.
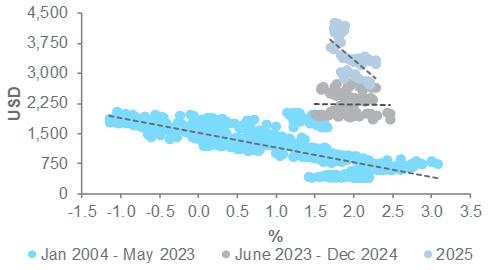
Fig. 2 Besides dollar diversification demand, interest rates could be returning as positive driver for gold
Gold vs US bond yield change
A second way to avoid excessive concentration in US technology is via our sector picks. While we remain Overweight the US technology sector, we are also Overweight the US healthcare and utilities sectors. While utilities has some overlap with AI via soaring demand for energy for data centres, it is arguably more defensive in nature. We also expect the healthcare sector to benefit from a reduction in regulatory uncertainty and inexpensive valuations. Indeed, we have replicated the combination of being Overweight both technology and healthcare sectors, to balance the technology sector’s exposure, across the US, Europe and China.
Putting this together, we believe this approach allows investors to remain invested in the US technology sector and the AI theme, while diversifying to a wider set of sources of returns across equity market regions and sectors.
02 Income: EM to trump DM bonds
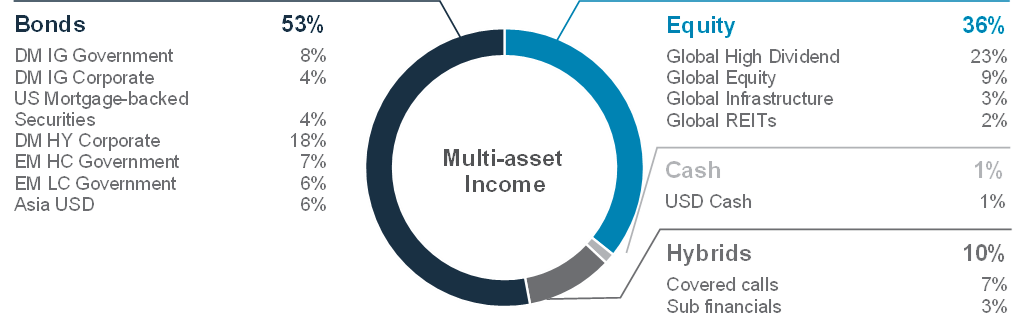
We are Overweight Emerging Market bonds, denominated in both USD and local currency (LCY), expecting them to outperform other major bond asset classes. We also see EM bonds as an attractive source of yield (alongside equity income asset classes) within a Multi-Asset Income strategy.
While global bonds are increasingly characterised by tight credit spreads (ie, elevated valuations relative to US government bonds), EM bonds stand out in three ways: (i) attractive credit quality, most visible in improving fiscal fundamentals, (ii) a higher yield relative to Developed Market (DM) bonds, and (iii) diversification (via the FX component) towards non-USD bonds. LCY bonds also provide exposure to rate cut cycles and falling yields in many EM local markets.
We are not negative on DM bonds per se. Individual defaults tend to capture news headlines, but aggregate default rates remain low, keeping credit spreads tight. However, we continue to prefer taking risky DM asset exposure via equities given their upside is relatively less capped vs. credit.
EM USD bonds should also benefit from gradually lower US government bond yields – we expect the US 10-year bond yield to gradually ease to 3.75-4.00% over 6-12 months – and a modestly steeper US yield curve given our expectation of three Fed rate cuts in 2026.
03 Diversifiers: Chasing glitter
We are Overweight gold and expect demand for other alternatives to remain high amid a range of uncertainties.
Positive drivers of gold prices remain in place, in our view. Major central banks and investors continue to search for USD alternatives – a diversification demand that has yet to run its course. In addition, recent data suggests gold’s inverse relationship with bond yields is starting to re-establish itself, adding another tailwind for the precious metal. Finally, our expectation of a weak USD should also add support.
There have been frequent discussions that gold is ‘expensive’ after its extraordinary post-2022 rally. Two data points capture the range of this debate: Gold prices are at a record high in real (inflation-adjusted) terms. However, relative to the US S&P500 index, gold remains near multi-decade lows. ‘Valuing’ gold remains difficult given its lack of yield; hence, we prefer to focus on key drivers of demand which point to further gains.
Currency markets are also likely to offer attractive diversification benefits, given our expectations of a weak USD over 6-12 months. In this regard, the JPY and CNH stand out. The JPY has continued to be a source of global liquidity due to its still-low rates and recent weakness. However, we caution its extremely inexpensive valuation, and the slow, but steady, rise in Japanese interest rates mean it is poised to strengthen sharply. We expect USD/JPY to move to 147 in 6-12 months, making it an attractive diversifier in a scenario where risky assets come under pressure. We also expect the CNH to strengthen steadily as policymakers seek to achieve stability and deflation risks push expected real yields higher.
Finally, alternative strategies offer a compelling case as portfolio diversifiers. There are demonstrably structural, long-term benefits from adding them to portfolios to reduce portfolio volatility, while also boosting expected returns. This is particularly important in today’s environment where stock-bond correlations remain high and traditional asset classes are unable to offer the normal diversification benefits.
Risks: Fundamental or financial?
In 2026, we would closely monitor four risks we believe hold the potential to alter our investment outlook.
First, a negative shock or disappointment relative to high expectations around the AI theme poses a risk to equity markets. An earnings or strategy announcement that is otherwise strong in absolute terms could still trigger volatility if expectations run too far ahead. Excessive borrowings by the AI mega caps to finance investments into AI, instead of relying solely upon their free cash flow, could also worry markets.
Second, a credit event that leads investors to worry that default risk is systemic rather than idiosyncratic poses a risk to both equities and credit, across private and public markets.
Third, any data or event that limits the Fed’s ability to cut rates poses the risk of disappointing markets and triggering a reassessment of risk asset valuations.
Fourth, an unexpectedly hawkish BoJ that pushes Japanese bond yields and the JPY sharply higher would pose a risk to equities and corporate bonds, given its role as a key source of global liquidity.
Fig. 3 2026 Outlook: Blowing bubbles?
^New opportunistic idea *Contingent Convertibles (CoCos) are complex financial instruments. Please refer to important disclosures on page 38.
Foundation asset allocation models
The Foundation and Foundation+ models are allocations that you can use as the starting point for building a diversified investment portfolio. The Foundation model showcases a set of allocations focusing on traditional asset classes that are accessible to most investors, while the Foundation+ model includes allocations to private assets that may be accessible to investors in some jurisdictions, but not others.
Fig. 4 Foundation asset allocation for a balanced risk profile
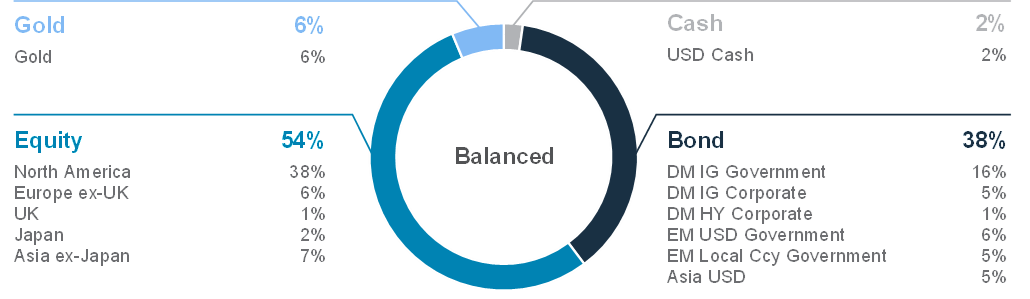
Fig. 5 Foundation+ asset allocation for a balanced risk profile

Fig. 6 Multi-asset income allocation for a moderate risk profile
Source: Standard Chartered
Foundation: Our tactical asset allocation views
Fig. 7 Performance of our Foundation Allocations*
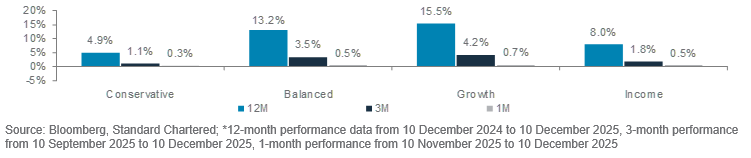
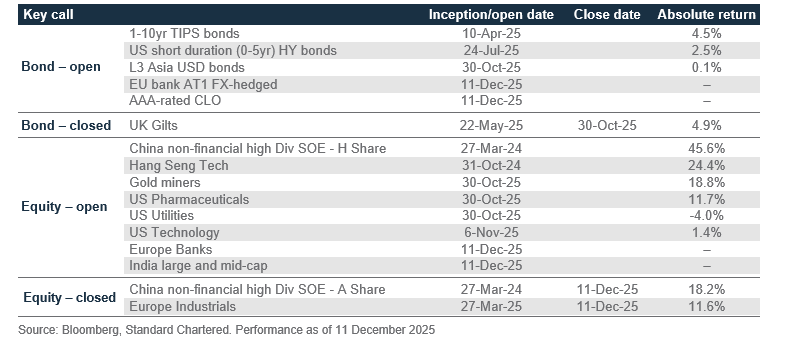
Fig. 8 Opportunistic ideas performance
Perspectives on key client questions
|
|
||||
|
|
||||
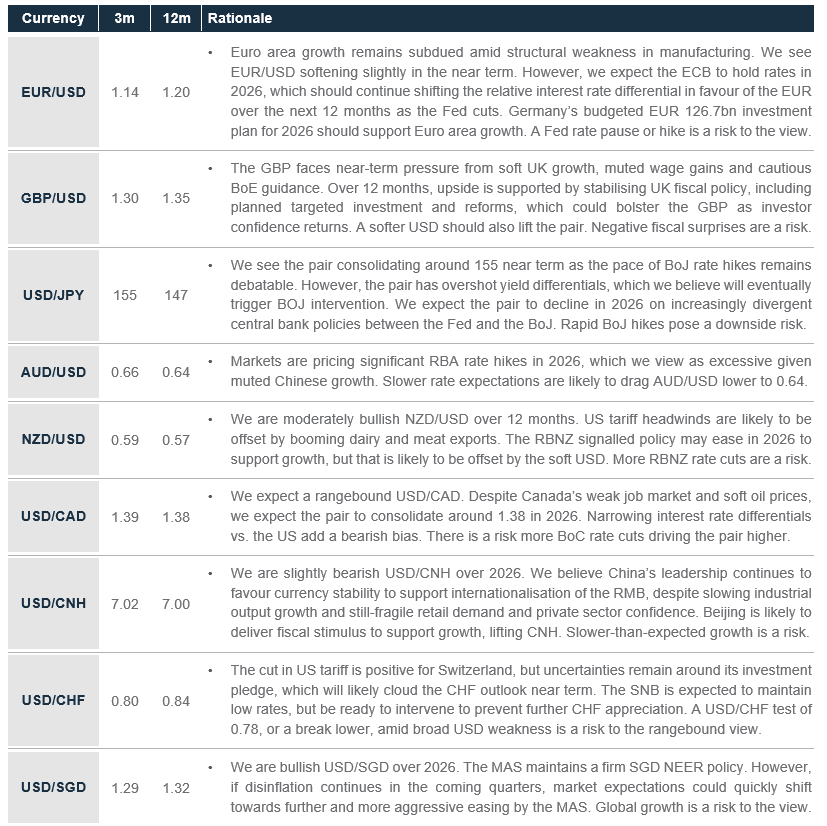
Do you still expect a weak USD in 2026? Will it push USD/CNH below 7.00?
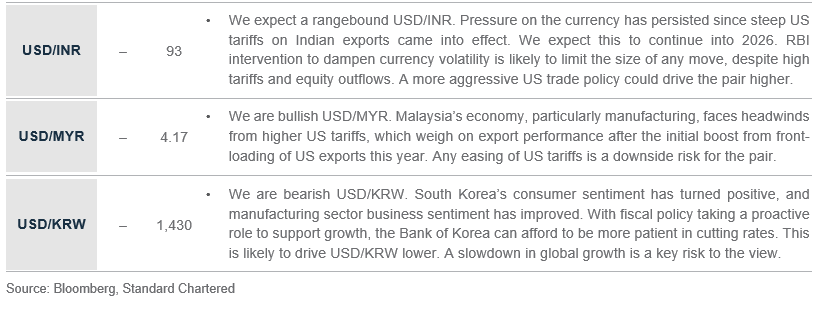
While we expect the USD index (DXY) to recover modestly over the next three months, depreciation to 96 is likely over a 12-month horizon. The USD recovery since September appears to be fading following soft US labour market data and expectations that the Fed will cut rates further in 2026. At the same time, hedging of USD exposure by foreign investors – which had pressured the USD earlier in 2025 – has slowed. On balance, this means we expect stabilisation or a modest rebound of the USD over a shorter 1-3 month horizon, supported by safe-haven demand. Over a longer 6-12-month horizon, though, gradual USD weakness is expected to persist as Fed rate cuts to support a cooling job market reduce the USD’s yield advantage versus other major currencies. Among major currencies, we expect the USD to depreciate most versus the JPY (USD/JPY to fall towards 147) and EUR (EUR/USD to rise to 1.20).
Historically, a weak USD has boosted returns of non-US equities, commodities and Emerging Market (EM) assets, as US investors face currency market tailwinds. This supports our current focus on being well-diversified beyond the US.
Against the backdrop of a broadly weaker USD, it is reasonable to ask whether Chinese policymakers will allow USD/CNH to dip below the psychological 7.00 level. We believe this is possible, but such an outcome is likely to be short lived. The PBoC prioritises currency stability to support exports, curb capital outflows and promote CNY as an international reserve currency, often intervening to defend key levels. This approach is likely to extend in both directions. We expect the USD/CNH pair to move to 7.02 in 3 months and stabilise around 7.00 in 12 months.
Will the AI capex boom continue?
The trajectory for AI-related capital expenditure (capex) is ‘higher for longer’. We see massive capital commitment, long-dated project pipelines and broadening economic impact, not only in the US, but also Asia and Europe. This trend represents a structural shift in the technology landscape, rather than a short-term investment cycle.
Bloomberg consensus projects the four major hyperscalers to spend a cumulative capex of around USD 350bn in 2025 (+64% y/y), following a growth rate of +39% in 2024. Guidance from this group points to further increases in capex in the near term. While the growth rate may moderate to around 40% in 2026, the absolute investment scale is still projected to expand significantly to approximately USD 500bn in 2026 and to USD 580bn in 2027, alongside monumental projects like the ‘Stargate’ initiative.
AI capex investment is not limited to data centres alone. It also extends to the entire supporting ecosystem, particularly energy and utilities for power generation and cooling systems. The recent ‘Genesis Mission’ launched by the US government to transform science and innovation through the power of AI further expands the use of AI. This backdrop underscores the multi-year horizon of these commitments.
Robust demand-side fundamentals and abundant free cash flow justify the capital spent. Hyperscalers have reported strong growth in AI-related revenues over the past quarters, significantly outpacing their capex growth rates. Anticipated future returns are also supportive. While the long-term return on investment (ROI) for end-user applications remains to be fully demonstrated, the current environment ensures that available compute capacity has been utilised, creating a clear link between investment and near-term financial returns.
Fig. 9 Fed is likely to cut rates more than its DM peers
Market implied central bank policy rate changes
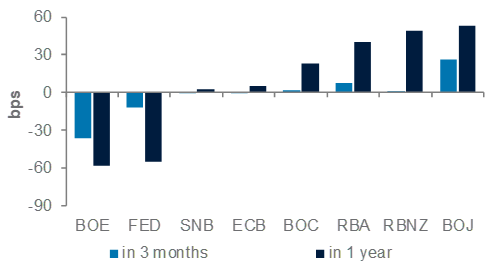
Fig. 10 Investment from major hyperscalers* is projected to expand significantly to USD 500bn in 2026
Major hyperscalers capital expenditure (quarterly, USD bn)
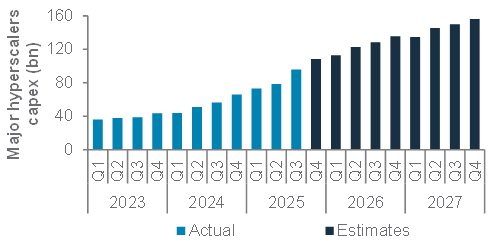
Note: *Sum of capex from Alphabet, Amazon, Meta and Microsoft
Do you see signs of a turnaround in Indian equities?
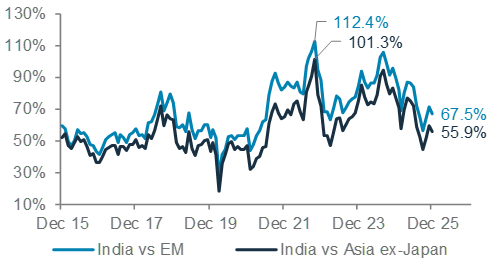
India’s equity market has underperformed peers in 2025, with MSCI India gaining just 1% versus a 29% gain in MSCI Asia ex-Japan (USD terms). India’s underperformance has been driven by lacklustre earnings delivery, stretched valuations at the start of 2025 and persistent foreign institutional investor (FII) outflows from its capital markets. However, we expect a reversal of this underperformance in 2026, given:
- India’s equity market valuations are no longer a headwind: India’s relative valuations have improved, with the 12-month forward P/E premiums to the MSCI EM and Asia ex-Japan indices nearly 68% and 56% lower than last year’s peak levels, respectively, and in line with historical averages.
- India earnings are recovering on the back of a recalibration of policies: The earnings downgrade cycle has bottomed out and forward earnings expectations are increasingly robust (MSCI India EPS is expected to grow at over 15% annual rate over 2026-27). This follows a slew of policy measures taken by the RBI (125bps rate cuts and liquidity measures) and income tax cuts and Goods and Services tax (GST) rate rationalisation totalling 1% of GDP undertaken by the government this year. These measures are likely to trigger a decisive upward shift in growth expectations, with positive earnings upgrades and surprises likely in the months ahead.
- Foreign investors are under-invested in Indian equities: After significant outflows this year, foreign investor positioning is now close to multi-decade lows. A turnaround in growth and earnings is likely to result in a return of foreign inflows.
This explains why we have upgraded Indian equities to an Overweight within Asia ex-Japan. We also see a short-term bullish tactical opportunity in Indian equities. With past headwinds largely priced in, any positive development on the proposed India-US trade agreement is likely to trigger a reversal in sentiment and drive positive gains to Indian equity markets in 2026.
Fig. 11 India’s equity market valuation vs EM peers is no longer as expensive as before
MSCI India index’s 12-month forward P/E premium vs MSCI EM and MSCI Asia ex-Japan indices
Can Chinese, Indian equities both deliver?
We are upgrading Indian equities to an Overweight while maintaining an Overweight to China within Asia ex-Japan. Given the size of both markets, it reasonable to question whether it is plausible for both markets to outperform Asia ex-Japan simultaneously? We believe the answer is yes.
First, it is reasonable to expect both markets to be positively correlated. It is true that, in the past, MSCI China and MSCI India have been negatively correlated for significant lengths of time. However, in the past year, this correlation has turned positive. This is not a recent phenomenon either. In fact, there have been several instances – covering approximately around 20% of market history since 2000 – when Indian and Chinese equities simultaneously outperformed their regional peers over a six-month period, based on monthly data.
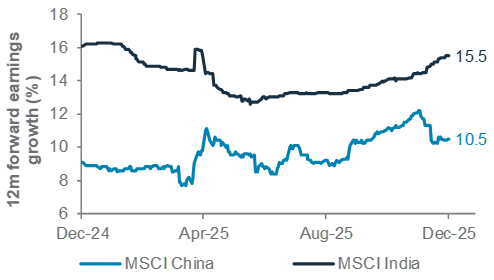
Second, the two markets offer very different types of equity exposure. Indian equities offer premium growth, while Chinese equities have attractive valuations. Indian equities are supported by a high Return on Equity (RoE). India also remains one of the fastest-growing EMs, with Q3 25 GDP growth reaching 8.2% y/y. We expect Indian companies to deliver higher 12-month forward EPS growth, at 15.5%
In contrast, China’s government is likely to set a 5% growth target for 2026, despite recent slowdown. This implies a still-high expected 12-month forward EPS growth of 10.5%. However, Chinese equities are trading at a 44% discount to Indian equities, based on 12-month forward P/E.
Structural reforms offer tailwinds for both markets. Indian policymakers have taken steps to simplify the national GST structure and ease compliance regulations to attract foreign investors. Meanwhile, growth stocks support Chinese equity performance, reinforced by policy initiatives such as AI investments and measures to boost consumption.
Finally, geopolitical considerations are important. US tariff policy is a risk for both markets. Any trade agreements with the US could bolster sentiment and trigger valuation rerating.
Fig. 12 EPS growth for India and China stocks are solid
12m forward EPS growth estimates for China/India equities
Macro overview – at a glance
Our macroeconomic outlook and key questions
|
Our view
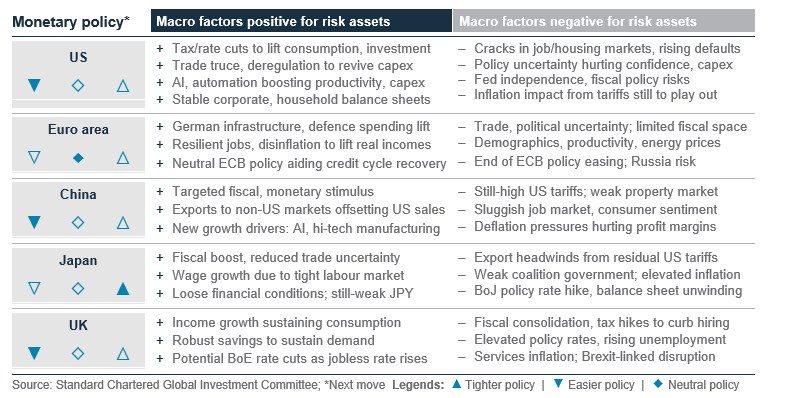
Core scenario (soft landing, 60% probability): We expect a soft landing in 2026, aided by continued Fed rate cuts, easing trade tensions, fiscal easing in Germany and China and monetary easing across some Emerging Markets (EMs). We expect the Fed to cut rates by another 25bps by March and a further 50bps to 3.0% by end-2026 to support jobs as the inflation impact of tariffs appears limited. The ECB is likely to pause at the current 2% deposit rate as inflation returns towards target and German stimulus kicks in. Meanwhile, targeted fiscal and credit easing in China should support hi-tech and consumption-led growth.
Downside risk (hard landing, 15% probability): There is a 15% chance of a US hard landing/recession in 2026, especially if inflation pressures delay Fed rate cuts and/or a slowdown in AI investments hurt investor and consumer confidence. US tariffs hurting corporate margins or a US bond and USD sell-off on concerns about rising debt or Fed independence are other risks.
Upside risk (no landing, 25% probability): Any acceleration in US investments due to the new budget’s tax incentives, or the returning of US tariff-generated revenue to households, could spur US consumer and business sentiment. Germany/China stimulus could lead to faster global growth. A US-China and/or a US-Russia peace deal could lift economic sentiment further.
Key chart
US private sector data shows the job market continues to cool, supporting the case for further Fed rate cuts. EM central banks, especially in Latin America, are likely to drive rate cuts in 2026, aiding an economic soft landing
Fig. 13 US, some EMs are likely to cut rates in 2026, aiding an economic soft landing

Top macro questions
What are the drivers of your US soft-landing view?
Our base case: We expect the US economy to settle below its long-term 1.8% trend growth, but avoid a recession in 2026 as easing trade tensions, Fed rate cuts, tax incentives and AI developments sustain consumption and investment. Consumption remains resilient, fuelled by high-income households, which have benefitted from a three-year stock market rally. Meanwhile, tariffs have had a limited impact on goods inflation so far, while falling rents are aiding shelter and service sector disinflation. As inflation slows, we expect the Fed to continue supporting a cooling job market with another 75bps of likely Fed rate cuts by the end of 2026. A weaker USD should ease financial conditions further. The policy focus is also likely to turn to the deregulation of sectors such as banking and energy, which should offset the impact of tariffs and lift consumer and business spending next year.
Trade tensions ease; court decision on tariffs awaited: After a turbulent year, US businesses have gained a bit more clarity on tariffs after the government sealed trade deals with key allies. A US-China trade truce, involving semiconductor chips and rare earth elements, should also reduce uncertainty. The next focus is on a Supreme Court decision on the legality of tariffs. A court decision to strike down the tariffs would be a boost to sentiment, although the administration could reimpose the tariffs under other, temporary legal powers.
Tax and Fed rate cuts: The latest budget gave sizable tax benefits to businesses tied to new investments, besides offering individual tax deductions and permanently extending Trump 1.0 personal tax cuts. The Congressional Budget Office estimated the positive impact to GDP will be frontloaded, peaking at 0.9% in 2026. We also expect the Fed to cut rates by another 75bps to 3.0% by the end of 2026 to support the job market, starting a lending upcycle.
Boost from AI: The AI revolution is having a three-fold impact on US growth. Investments in data centres, computer hardware and software could add 0.5-1.0% to US growth in H1 26. Meanwhile, the AI-driven surge in equities has boosted household wealth, especially in the upper income segment, in turn driving consumption higher. AI could also drive productivity gains in the coming years.
Near-term risks: The job market slowdown is an immediate risk. US monthly job creation has slowed to an average 62,000 in Q3 25, from 111,000 in Q1 25, with payrolls contracting in two of the four months since June. While the job creation rate is still above the 35,000 rate needed to keep the jobless rate steady (as immigration curbs cut labour supply), lay-off announcements have picked up. We expect the Fed to keep cutting rates into 2026 to mitigate this risk. A medium-term risk is President Trump’s attempt to control a majority in the Fed’s 7-member governing board and eventually the 12-member Fed’s Open Market Committee with an aim to drastically cut rates even as inflation remains well above the Fed’s 2% target. A Trump control of the Fed could potentially upend bond markets and undermine the USD. Views of the new Fed Chair, likely to be named by January, would be revealing.
Will Germany drive Euro area growth higher in 2026?
We expect Germany’s economy to return to trend growth in 2026 after three years of stagnation, with its regime changing EUR 1trn infrastructure and defence spending programme starting to make an impact from H1 26. The German stimulus is likely to lift overall Euro area growth by c. 0.3 percentage points. A boost to defence spending by other Euro area members could provide further growth, although fiscal constraints facing major Euro area economies (eg, France, Italy) limit the scope of such spending. EUR strength has also tightened financial conditions this year. Nevertheless, we expect the ECB to hold its key deposit rate at the current 2% as it assesses the impact of German stimulus next year.
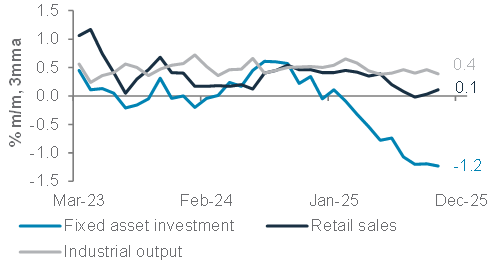
Will China ease policy further as economy slows again?
We see a rising chance of a more decisive, but targeted stimulus in China in 2026. The economy has slowed in H2 25 as front-loaded fiscal stimulus fades and exports slow after the bounce ahead of US tariffs. A planned diversification of supply chains and export markets should help partly mitigate downside risks to exports in 2026. Nevertheless, disinflationary pressures, driven by sustained property market downturn, have kept domestic demand and investment subdued. Policymakers finalised the next five-year plan for 2026-30, focussing on proposals to accelerate investment in advanced technology to boost self-reliance and productivity. We also expect measures to revive domestic consumption.
Fig. 14 Euro area awaits German stimulus to lift growth
Euro area and German growth expectations and sentiment
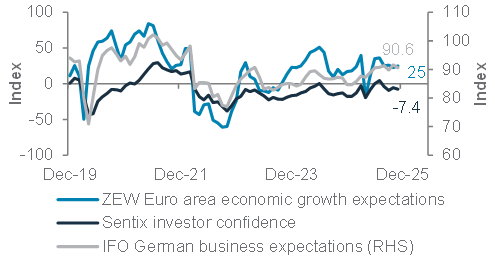
Fig. 15 Targeted China stimulus likely to revive growth
China’s fixed investment, retail sales, industrial output growth
Asset Classes
Bonds – at a glance
|
|
||||
|
Our view
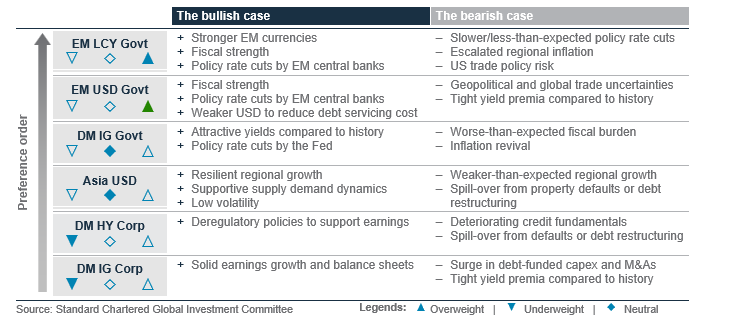
Foundation: We view global bonds as a core holding. We have a relative preference for government bonds over corporate bonds (‘rates’ over ‘credit’) given still-attractive nominal yields, which stands out against expensive corporate bond valuations.
We prefer Emerging Market (EM) over Developed Market (DM) bonds. We are Overweight both EM USD government bonds and EM local currency (LCY) government bonds, driven by expectations of benign EM inflation, dovish monetary policy settings, fiscal improvements and a weak USD. Within DM bonds, we are Underweight both Investment Grade (IG) and High Yield (HY) corporate bonds. In the US, we anticipate short-term yields will decline more than long-term yields due Fed rate cuts to 3.00% by end-2026, resulting in a steeper yield curve (ie, wider gap between long- and short-maturity yields). Uncertainty related to the US fiscal burden, inflation and Fed independence after a new Chair takes office risk bond volatility. However, we would use any resulting yield rebound to lock in higher absolute yields to hedge against the risk of ever-lower cash yields. We see US 10-year government bond yields above 4.25% as attractive since we expect it to ease to the 3.75%- 4.00% range over the next 6-12 months. We see 5-7-year bond maturities offering the most attractive balance between higher yields and managing fiscal and inflation risks.
Opportunistic ideas: We are bullish (i) European bank AT1 bonds (CoCos1; FX-hedged), (ii) AAA-rated Collateralised Loan Obligation (CLO), (iii) US TIPS bonds, (iv) short-duration US HY bonds, and (v) Asia IG USD bonds.
Key chart
We are Overweight EM USD and LCY government bonds, supported by solid EM economic growth, fiscal strength, prospect of rate cuts by EM central banks and a weak USD
Fig. 16 EM bonds offer attractive yields amid improved fundamentals
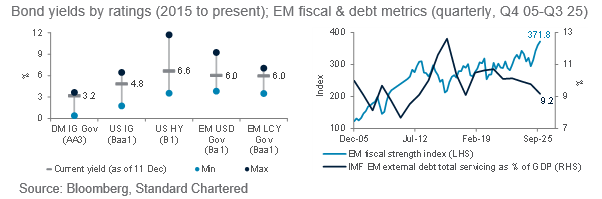
Overweight EM USD, LCY government bonds
Within bonds, we prefer EM over DM bonds. EM bonds offer nominal yields of approximately 6% and attractive risk-adjusted yield pick-up when compared to DM bonds. We have upgraded EM USD government bonds to an Overweight, pairing with EM LCY government bonds. Most EM economies have bolstered their fiscal and current accounts in recent years. Their strong external balance and our expectation for a weak USD should benefit external debt servicing. Additionally, we expect the Fed to further loosen monetary policy over the next 12 months, giving EM central banks the flexibility to be more accommodating in an environment of benign inflation and stable EM currencies. However, EM assets are susceptible to market volatility and geopolitical uncertainty.
Core holding: DM IG government bonds
We see DM IG government bonds as a core holding and hold a preference for government bonds relative to corporate bonds. USD bond yields should fall as the Fed cuts rate, with short-term yields declining more than long-term yields (i.e., a steeper yield curve). This should result in strong total returns, combining the yield with modest price gains.
Rates volatility is expected to rebound from recent lows amid uncertainty related to the US fiscal burden, inflation and Fed independence after the new Fed Chair takes office. However, we expect such bouts of volatility to be short-lived and would, thus, use any rebounds in bond yields as an opportunity to lock in yields to hedge against the risk of ever-lower cash yields. We see US 10-year government bond yields above 4.25% as attractive, since we expect it to fall to the 3.75%-4.00% range over the next 12 months.
Core holding: Asia USD bonds
Asia USD bonds continue to offer reasonably attractive yields, with continued targeted Chinese policy stimulus remaining a source of optimism. A peak in (i) China property sector defaults and (ii) South/Southeast Asian issuer refinancing risk are both now likely behind us, though idiosyncratic ‘liability management’ events are possible. However, geopolitical uncertainty and protectionism remain key risks. We are neutral between Asia IG and HY bonds.
Underweight DM IG and HY corporate bonds
Our Underweight view on DM IG and HY bonds is mainly a function of valuations rather than credit quality concerns. These bonds can be reasonably attractive sources of yield. However, we are mindful that the yield premia over Treasuries for both IG and HY bonds remain close to historically tight levels. This makes DM IG bonds less attractive given their susceptibility to any surge in issuance by US hyperscalers to fund continued AI-related investments. HY bonds should benefit from strong riskier asset performance, but we prefer equities over HY bonds given their upside is less capped.
Bullish US inflation-protected bonds (TIPS)
We believe the risk reward is attractive. They offer protection against any revival in inflation resulting from fiscal risks, tariffs and higher commodity prices. They should also benefit from lower yields as a result of Fed rate cuts. Low inflation is a risk to the view.
Bullish short-duration US HY bonds
We anticipate HY corporate earnings and cashflows to remain solid in a soft-landing environment. Refinancing activity across both public and private markets this year has moved the HY ‘maturity wall’ to 2027, improving repayment visibility of short-duration HY bonds. We expect the refinancing window to remain comfortably open over the next 6-12 months as financial conditions continue to loosen amid a rate-cutting Fed and continued strong inflows into public and private credit markets. A downturn in credit quality is a risk.
Bullish Asia USD IG bonds
We expect Asia IG bond valuations to remain elevated, driven by favourable supply demand dynamics (net negative issuance) and strong credit fundamentals with solid cashflow, relatively low leverage and a higher share of sovereign or sovereign-linked issuers. Asia IG bonds should also offer modest price gains as they benefit from lower Fed rates. A downturn in credit quality is a risk.
Initiate bullish European bank AT1 bonds (CoCos1; FX-hedged)
European bank sector fundamentals remain solid, denoted by ample liquidity coverage, strong capital buffers and still-supportive asset quality. Similar to the broader DM bonds asset class, the valuations of European bank CoCos are elevated. However, we believe CoCos will benefit from the current late-cycle environment, with the yield expected to be a major return contributor. Unexpected extensions (non-call) and principal write-downs are risks.
Initiate bullish AAA-rated CLOs
We believe Collateralised Loan Obligations (CLOs) can offer more attractive yields than similarly rated bonds, while at the same time mitigating the risk of higher bond yields due to their floating rate nature. The recent surge in US corporates using alternative funding routes, such as leveraged loans, has created unique opportunities in CLOs. We like the high-quality AAA-rated segment due to its superiority in payment priority. Earlier-than-expected call risk and contingent spill-over from credit events in weaker-quality loans or private credit are risks.
Equity – at a glance
|
|
||||
|
|
||||
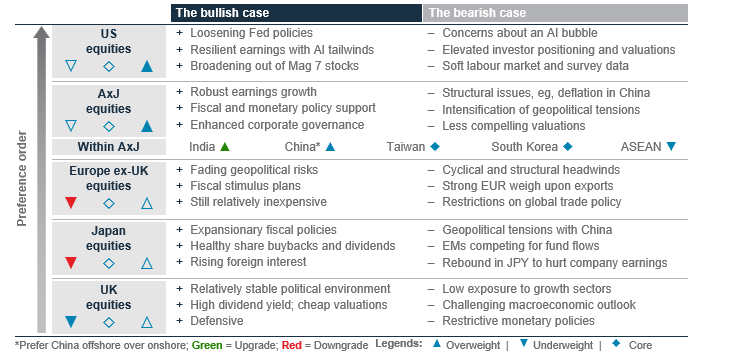
Our view
We remain Overweight global equities, with a preference for US and Asia ex-Japan (AxJ) equities. US equity resilience continues to drive global equity performance, supported by a robust fundamental backdrop, including strong earnings growth, receding geopolitical risks and an accommodative Fed policy, which bolster the case for a soft landing in the US economy.
We project Asia ex-Japan (AxJ) equities to deliver the highest earnings growth among major regions over the next 12 months. We upgrade Indian equities to Overweight, and we add India large and mid-caps as opportunistic ideas, on the back of a recovery in earnings, strong structural growth and less-demanding valuations vs. a year ago spurring foreign investor interest. We also expect Chinese equities to outperform within AxJ. Chinese equities stand to benefit from enhanced corporate governance and targeted policy support for technology and innovation.
We downgrade Europe ex-UK equities and Japan to Underweight. While fiscal stimulus is likely to accelerate in Germany, the strong EUR is hurting European exporters. Japan’s escalating geopolitical tensions with China and a subdued earnings outlook, against a stronger JPY projection, outweigh improving corporate governance reforms. We also remain Underweight UK equities, reflecting the market’s low exposure to growth sectors.
Key chart
US and AxJ equities are likely to outperform in 2026
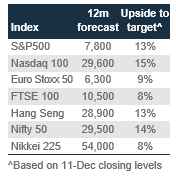
Fig. 17 US earnings revision outperforms that of global equities; Corporate earnings growth estimates for AxJ and US are leading other regions for 2026
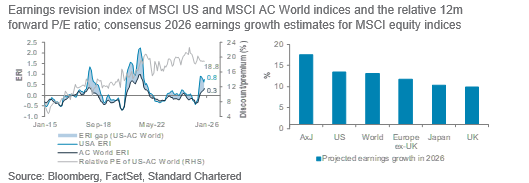
US equities – Overweight
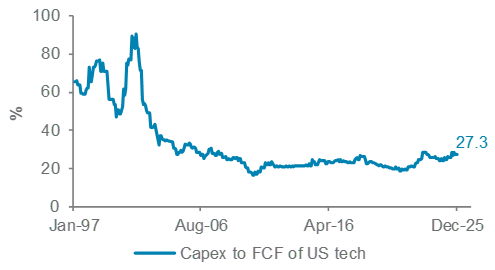
We are Overweight US equities. Despite the prolonged government shutdown, recent economic data remains resilient. Expectations of further Fed rate cuts reinforce our soft-landing scenario and provide tailwinds for growth-oriented sectors. Q3 25 earnings demonstrated continued strength, with 12-month forward EPS growth for the MSCI US index tracking at 14%. Following the recent market pullback, investor positioning does not appear overly extended anymore. Catalysts such as capital expenditure on AI infrastructure is set to accelerate across tech companies, supported by abundant free cashflows. Fading geopolitical uncertainties should also support a continued uptrend. The key risk lies in any change in sentiment towards AI-related stocks (eg, future guidance and how they fund the capex).
Fig. 18 Capital expenditure as a ratio of FCF for US technology stocks remains at subdued levels
Capex to free cashflow ratio for S&P500 Technology index
Asia ex-Japan equities – Overweight
We are Overweight Asia ex-Japan equities. The region stands to benefit from a weaker USD, which should ease input costs and boost corporate earnings.De-escalating trade tensions and still-reasonable valuations provide additional tailwinds.
We upgrade India to Overweight within Asia ex-Japan. After a subdued equity performance in 2025, signs of a turnaround are emerging, supported by ongoing fiscal measures and robust domestic growth. Valuations have become compelling following consolidation, with the 12-month forward P/E
Fig. 19 India’s improved inflows and earnings revisions
MSCI India earnings revision index and foreign net inflows

premium of MSCI India index largely narrowed to AxJ equities in 2025. While tariff risks remain, 2025 foreign outflows have largely normalised, accompanied by improved earnings breadth. We favour large-cap stocks on a greater margin of safety in earnings resilience and valuation support.
We retain our Overweight allocation to China. We expect policy support to drive equity market performance in 2026. The latest five-year plan, which emphasises improvements in services consumption and technological self-reliance, sets the stage for structural growth. Potential monetary easing and policy stimulus further underpin company earnings, helping to offset deflationary pressures. Within China, we prefer offshore equities relative to onshore peers, given their higher exposures to growth sectors and more attractive valuations compared with US counterparts.
Both South Korea and Taiwan equities remain core holdings with AxJ. Persistent demand for AI and Korea’s Value-Up programme can support earnings growth and enhance shareholder returns. However, valuations have largely rebounded, especially for Korea equities where the 12-month forward P/E for the MSCI Korea index is trading in line with its historical average since 2007, limiting scope for further rerating. We are Underweight ASEAN, as weak EPS momentum outweighs the benefits of monetary easing.
Europe ex-UK equities – Underweight
We downgraded Europe ex-UK equities to Underweight. Earnings growth projections remain solid (11.6% in 2026), and Germany’s fiscal stimulus is supportive. However, valuations are becoming stretched – the 12-month forward P/E for Euro area equities is approaching 1 std deviation above its historical average. Mixed economic data across the region and political uncertainties in France will likely weigh on investor sentiment. Lastly, the strong EUR is expected to weigh on the earnings of exporters.
Japan equities – Underweight
We downgraded Japan equities to Underweight. While we expect corporate reforms and the NISA programme to drive fund inflows, upside may be limited after the sharp rally in recent months. Stronger economic data have also increased the risk of a BoJ rate hike by Q1 26, which could hinder the rollout of Abenomics 2.0 policies, including fiscal spending and monetary easing. Rising tensions with China may also impair tourism revenue and disrupt supply chain. Potential JPY appreciation could further dampen earnings prospects for Japan’s exporters.
UK equities – Underweight
We are Underweight UK equities. The market’s defensive composition is likely to lag more growth-oriented regions such as Asia ex-Japan and the US. Lower energy prices may also weigh on earnings growth projections, particularly within cyclical sectors, further limiting the region’s relative performance outlook.
Equity opportunistic views
|
Maintaining a barbell strategy
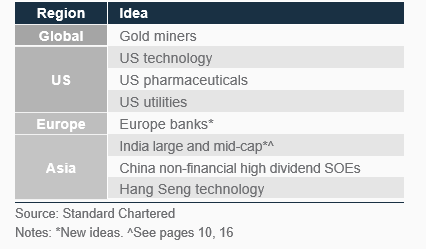
We target positive absolute returns with our opportunistic ideas. Entering 2026, we continue with a barbell strategy, with exposure to growth and defensive ideas. We replaced Europe industrials with Europe banks and added a new idea: India.
Fig. 20 Opportunistic ideas
Technology
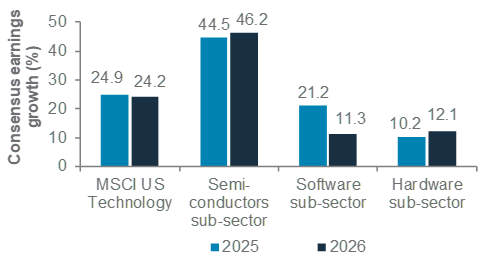
We are Overweight the technology sectors in the US, Europe and China. We expect AI investments to continue to support earnings growth in the sector, particularly the semiconductor industry. Advanced semiconductor chips continue to face supply shortage as major technology companies and governments race to gain an edge in AI applications. We are also positive on the software industry, as AI applications accelerate software development and enhance product features, such as agentic platforms. AI infrastructure-related industries would also benefit from the buildout in data centres, power supply and specialised cloud networks. Our preferred route to gain exposure is through the US technology sector, where the semiconductor and software industries comprise 74% of the sector, the remainder being technology hardware. The US technology sector includes advanced chipmakers and software giants with scalable platforms and significant recurring revenue. Europe’s technology sector is heavily weighted (88% of total market cap) towards from semiconductor and software, though we see higher growth prospects for the US technology sector. Valuations are similar and elevated (both c. 29x consensus 12m forward P/E) and both supported by earnings growth.
China’s technology sector has a very different composition, with technology hardware accounting for 71% of the sector’s total market cap, with a smaller share for semiconductor and software industries. China’s technology hardware industry enjoys healthy demand, especially from EMs, and has diversified into making electric vehicles.
Fig. 21 We expect strong 2026 earnings growth in US technology sector, led by the semiconductors industry
Consensus 2025 and 2026 earnings growth for MSCI US technology index and its sub-sectors
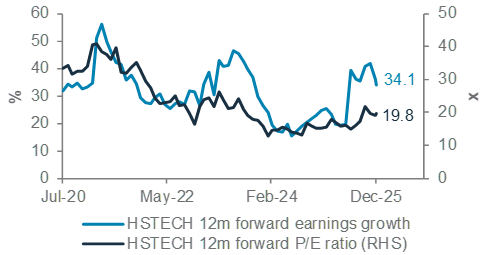
Our preferred route to gain exposure to the AI boom in China is through the Hang Seng technology index (HSTECH). HSTECH comprises the technology and internet giants that span the communication services, consumer discretionary and technology sectors in China. We expect positive performance from HSTECH, driven by valuation re-rating and earnings growth. Valuations remain attractive at 20x consensus 12m forward P/E, a 15% discount to its own historical average and a 31% discount to the US technology sector. Policymakers continue to support AI+ adoption and technology development, while major technology platforms are investing heavily to drive growth.
The risks for the technology sector include a slowdown in
AI investments and adverse regulatory changes, especially in China.
Fig. 22 Earnings growth in HSTECH is strong, while valuation is attractive
Healthcare
While technology offers growth exposure, healthcare is the other side of the barbell, with defensive exposure through
steady earnings growth. We are Overweight the healthcare sector in the US, Europe and China. The healthcare sectors in Europe and China are predominantly (84-91% of market cap) composed of the pharmaceuticals, biotechnology and life sciences industries, balanced by healthcare equipment and services. However, healthcare equipment and service providers account for 39% of the US healthcare sector.
Our preferred healthcare sector exposure is through the US pharmaceuticals industry, given attractive valuations and earnings growth.The US healthcare sector had been facing regulatory uncertainty for most of 2025, making it was the worst performing US sector up to Q3 25. This risk receded from September 2025 as President Trump agreed on pricing and tariff concessions with major pharma companies. Although US pharma has bounced off the bottom, we expect innovative medicine to drive further gains, while valuations remain reasonable. The risks with healthcare are further regulatory uncertainty and adverse drug trial results.
Fig. 23 Receding regulatory risk can further narrow the valuation discount of US pharma vs the broader market
Consensus 12m forward P/E of S&P500 pharmaceuticals relative to the S&P500

Financials
We upgrade financials to Overweight in Europe while it remains a core sector holding in the US and China. Europe financials offer an attractive valuation at 10x consensus 12m forward P/E – a 29% discount to the broader Europe market. European fiscal stimulus, led by Germany, is positive for the domestic economy, and financials are less susceptible to EUR strength. US financials are more expensive (16x P/E), but benefit from further deregulation and a US soft-landing. However, further Fed rate cuts can put downward pressure on net interest margins. Credit risks remain after some high-profile defaults. Meanwhile, China financials remain inexpensive (6.4x) due to exposure to the troubled property sector.
Our preferred exposure among financials are European banks. Besides the attractive valuations, we expect steady earnings growth, with tailwinds from higher long-term yields and fiscal expansion in Europe. We believe the ECB has reached the end of its rate cutting cycle, easing net interest margin pressures. Risks include higher-than-expected credit losses.
Diversify
We continue to favour diversification with global gold miners. We remain positive on gold prices, and gold miners’ equities are ‘leveraged’ to moves in gold. Gold miners are enjoying surging free cashflows and have been efficient in controlling costs, with average mining costs below USD 1,700/oz. A dip in gold prices would be a risk.
In the US, we also have an opportunistic idea on US utilities, which offer defensive earnings growth. Electric utilities form the bulk of the sector (65%) and multi-utilities (26%) often supply electricity and gas. Pure gas and water utilities are a minority. We expect the data centre boom to support electricity demand growth over the next decade, accelerating earnings growth for the electric utilities. Regulated utilities are collaborating with their regulators to expand capacity, while unregulated power producers are striking power purchase agreements directly with major tech companies to power their data centres. A slowdown in data centre buildout is a risk.
In Asia, we add India large and mid-cap as a new idea, with an improving earnings outlook (see pages 10, 16). In China, our barbell strategy pairs the growth exposure in HSTECH with China non-financial high-dividend state-owned enterprises (SOEs).These SOEs are less volatile versus the broader market, with a predominantly domestic focus. The stable dividend income is attractive while non-financial SOEs are less exposed to the troubled property sector. We prefer to focus on the more accessible H-shares of the SOEs and close the A-shares idea on the SOEs (gain of 18.2% since 27 March 2024). Adverse regulatory changes in China are a risk.
Other sector views
We remain Overweight Europe’s industrial sector, but we are taking profit on our opportunistic idea (gain of 11.6% since 27-Mar-25). We believe that infrastructure and defence spending remain multi-year tailwinds, but near-term profit-taking is likely as growth expectations nudge lower.
Fig. 24 Sector views by region
The case for Alternatives
While we believe there are key differences between the tech bubble of the late 1990s and the AI-led rally today, elevated valuations make the case for increased diversification even stronger.
The case for including Alternatives in a portfolio is twofold. First, there are structural, long-term benefits of adding them to portfolios to increase risk-adjusted returns. Second, there are cyclical reasons why this is even more important today.
Structural
The case for diversifying across different asset classes is well-understood. In finance theory, diversification is often referred to as the only ‘free lunch’. This is inaccurate in terms of pure expected returns as diversification among traditional asset classes generally reduces theoretical expected returns compared with a 100% equity allocation. However, it does increase the expected returns for the amount of risk being taken. This can have an important impact on practical returns as it helps investors stay invested through the market cycle.2
However, once you expand the analysis to alternative assets, expected returns can increase with additional diversification, leading to a significant improvement in the expected returns for the level of risk being taken.
This rationale is well-understood by institutional investors and sovereign wealth funds, which deploy capital aggressively into the Alternatives space. For instance, we have seen significant flow from Gulf sovereign wealth funds into the private market and AI space, supporting valuations and deal flows. Such flows continue to support alternative asset demand and valuations.
Fig. 25 Adding Alternatives increases risk-adjusted returns
Foundation (traditional) and Foundation+ (including Alternatives) expected returns, volatility and risk-adjusted returns using our latest five-year capital market assumptions
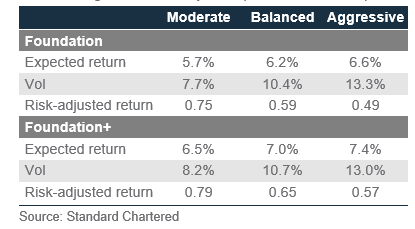
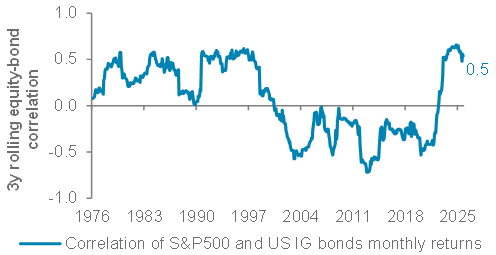
Fig. 26 Elevated equity-bond correlation argues for even more diversification than normal
Rolling equity-bond correlation

Why today?
The key premise of a 60:40 equity-bond portfolio is the correlation between equities and bonds (government bonds in particular) is assumed as negative – especially when equities fall. This means when equities fall, bonds rally, reducing the volatility of the portfolio, but the reality of the situation is more complex. The chart of the equity-bond correlation (Fig. 26) shows that the correlation changes over time. In fact, it is positive and elevated today. As such, the benefits of adding bonds to a portfolio have been limited since the pandemic.
Fig. 27 Which quadrant the US economy is in seems to fluctuate month to month
Stylistic view of bond and equity market performance in different macro regimes
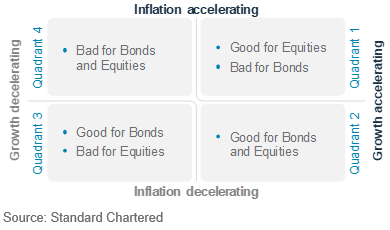
A simple stylistic two-by-two matrix of growth and inflation from an accelerating-decelerating perspective (Fig. 27) helps illustrate how various asset classes are expected to perform across different growth and inflation scenarios.
2. As important as the theoretical returns is the behavioural dynamics element. Investors are generally risk averse, having a greater emotional reaction to losses rather than gains. This can lead to sub-optimal investment decisions. This means investors’ actual returns deviate significantly from the theoretical returns. Meanwhile, there is strong evidence that the narrower the exposure, the greater the underperformance (see Morningstar’s ‘Mind the Gap’ report, which examines this in more detail).
The caveat here is the real world is messier than this simplistic lens would suggest and is also dependent on the starting levels of growth and inflation. For instance, in quadrant 1, there is a big difference between growth and inflation both accelerating from 1% to 2% (healthy) and from 3% to 4% (overheating), but this relates largely to the likely monetary policy response and the potential transition to a
different quadrant.
What is clear, though, is that at higher levels of US inflation, the correlation between equities and bonds is higher. For the 10 years following the 2008 Global Financial Crisis (GFC), the challenge for the US Federal Reserve was trying to lift inflation close to 2%, ie, avoid deflation. Since COVID, the challenge has changed to trying to cap inflation against the backdrop of the COVID supply disruptions, Russia-Ukraine conflict, deglobalisation and the aggressive use of trade tariffs to rectify global imbalances.
Fig. 28 Equity-bond correlation generally increases with inflation
Average equity-bond correlation by different inflation buckets
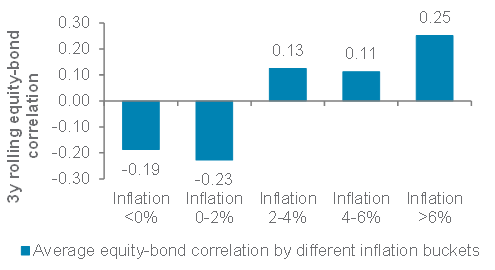
This means that a 60:40 equity bond portfolio might be less effective at managing portfolio volatility than it has been in the past. This just increases the incentive for investors to increase their allocation to non-traditional asset classes where possible. To us, this means up to a 30% allocation (including gold) to Alternatives across different risk profiles.

From a definitional perspective, we consider four broad sub-asset classes in the Alternatives space:
- Private assets – Private equity, Private credit/debt and Private real assets
- Hedge fund strategies, including liquid Alternatives
- Gold
- Digital Assets
Fig. 29 Level 1 asset allocation pie charts across different risk profiles
Stylistic view of bond and equity market performance in different macro regimes

Gold, crude oil – at a glance
|
|
||||
Our view
We remain Overweight gold, with 3- and 12-month price targets at USD 4,350/oz and USD 4,800/oz, respectively. Ongoing Emerging Market (EM) central bank demand and supportive macro conditions should sustain gold’s rally.
We expect West Texas Intermediate (WTI) oil to remain around USD 61/bbl and USD 60/bbl over the next 3- and 12-month horizons, respectively. Excess supply should cap temporary rebounds in prices due to potential geopolitical risks.
Key chart
Fig. 30 Central bank gold purchases are outpacing historical norms
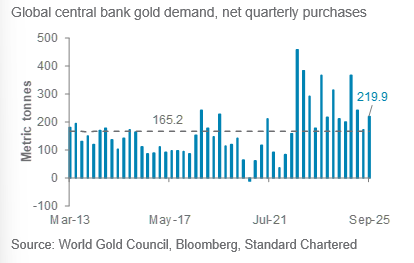
Fig. 32 We forecast OECD oil inventories to rise, reflecting a looser oil market
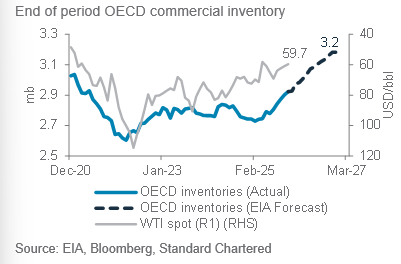
Fig. 31 Gold has outperformed, driven in part by sustained USD weakness
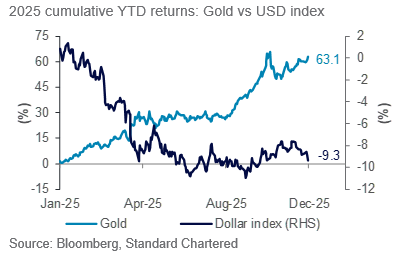
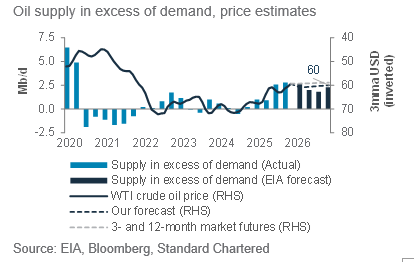
Fig. 33 The oil market is likely to remain in surplus in 2026, keeping prices in check
Gold outlook: Gold’s multi-year rally remains supported by broad, resilient demand, with EM central banks set to play an even larger role as they diversify reserves. The macro backdrop of declining real yields and a softer USD underpin the outlook. While near-term volatility is likely after Fed rate cuts, pullbacks should be shallow, reflecting consolidation rather than trend reversals, laying the base for the next leg up.
Oil outlook: WTI crude oil is expected to remain pressured by ample supply, spare capacity and rising inventories though demand should grow modestly in 2026. OPEC+ production guidance for early 2026 should help tighten near-term balance. Geopolitical risks may trigger episodic volatility. However, any impact is likely to be short-lived, unless disruptions materially and sustainably constrain supply.
FX – at a glance
|
Our view
We expect the USD index (DXY) to peak around 100.5 over the next three months. The Fed’s upbeat growth forecasts amid expectations of stable employment and sustained disinflation has kept the Fed cautious about signalling an aggressive policy-easing path in the near term. This supports front-end US yields and limits downside pressure on the USD. In addition, bouts of geopolitical uncertainty in Asia can lead to safe-haven demand for the USD. Market positioning also remains moderate, allowing the USD to retain some near-term momentum before the broader weakening trend resumes.
Over a 12-month horizon, we expect USD weakness to re-emerge, pushing the USD index towards 96, with fading structural support for the USD. The Fed is likely to ease policy through 2026, while other major central banks are approaching the end of their rate-cut cycles. US yield differentials should narrow steadily against other major economies. The erosion of the US ‘carry’ advantage and the fading of US exceptionalism are medium-term headwinds against the USD.
Political and institutional uncertainties also weigh on the USD. Concerns around US trade policy and Fed independence could return to the fore as the new Fed Board and Chair nominations unfold in Q1 26. Risks to our downside USD view include a renewed rise in inflation or a more hawkish-than-expected Fed stance, which could temporarily revive demand for the USD.
Key charts
Fig. 34 USD to consolidate near term; weaken in 12m
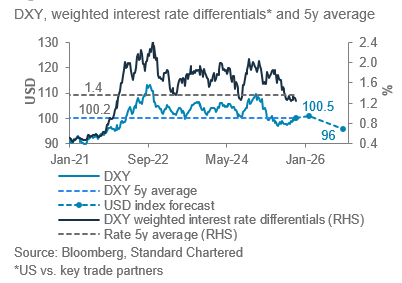
Fig. 36 USD/CHF formed a significant technical support zone at 0.75-0.78 amid SNB intervention risk
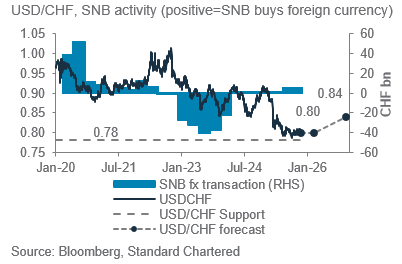
Fig. 35 Rate differentials point to USD/JPY downside
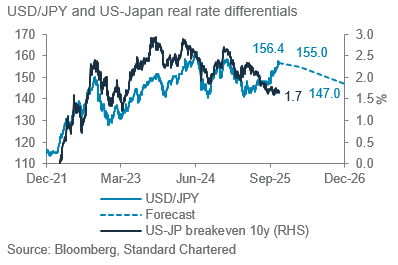
Fig. 37 We expect USD/CNH to settle around 7.00 in 12 months as US-China real yield spread decline steadily
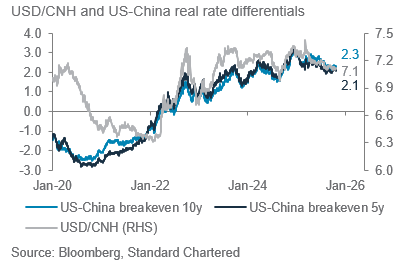
Fig. 38 Summary of currency forecasts and drivers
Additional perspectives
Quant perspective
Bullish equities over both short and long term
|
|
||||
Summary
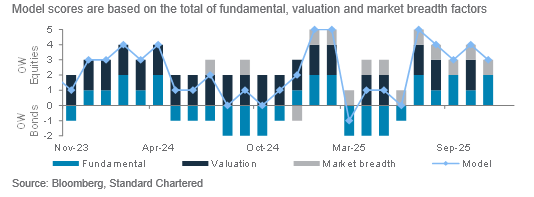
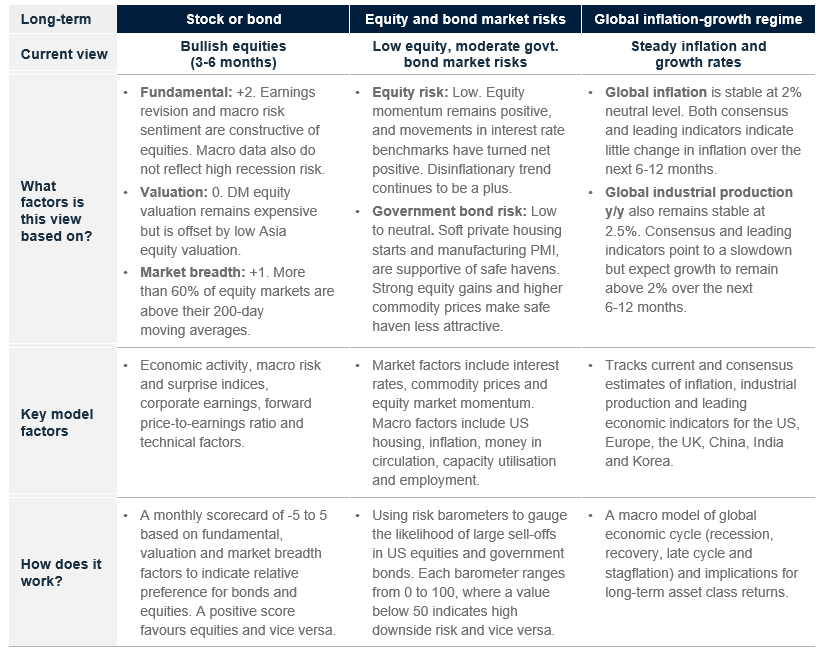
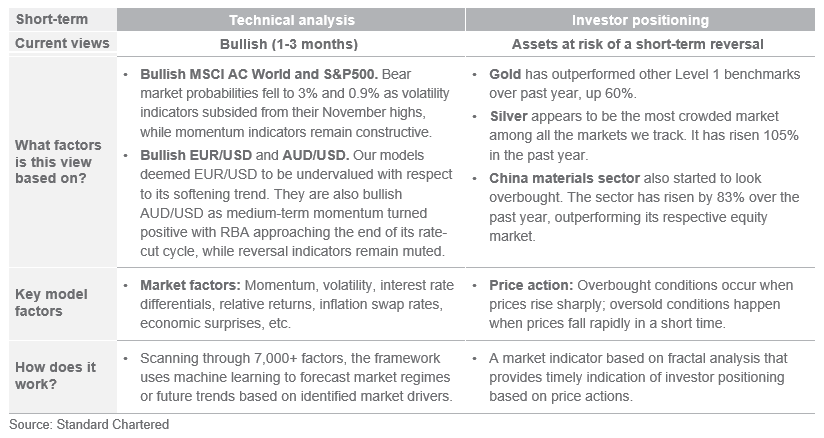
Our stock-bond model remains OW equities (3-6 months). It has slightly reduced its Overweight allocation to equities as Developed Market (DM) equity valuations remain expensive. Fundamental factors are positive on equities due to (i) positive earnings sentiment, (ii) still-low market risk aversion and (iii) no strong signs of a recession based on both soft and hard economic data. Valuation factors are neutral equities as Asian equities still look cheap. Finally, technical factors are also bullish as more than60% of equity markets are above their 200-day moving averages. The current model score is +3 out of 5, signalling a clear preference for equities over bonds over the next 3-6 months. The model returned 56% in absolute terms since inception in February 2023 and has beaten the 60/40 equity/bond benchmark annually with a total outperformance of 7.5% over the period.
Short-term models are bullish the S&P500 and MSCI AC World indices, EUR/USD and AUD/USD (1-3 months). Estimated bear market probabilities for the S&P500 and the MSCI AC World fell to 0.9% and 3.0%, respectively, after volatility indicators subsided from their highs in November. Overall, momentum indicators over the medium- and long-term time horizons still held up relatively well. For currencies, our models remain constructive on EUR/USD as it is deemed undervalued with respect to its softening trend. The models are also bullish AUD/USD as its medium-term momentum turned positive as the RBA approached the end of its rate cut cycle, while reversal indicators remain muted.
From a market diversity perspective, assets that have performed strongly and at higher risk of a short-term correction include Gold, silver, and China materials sector. These assets have performed strongly over the past year, but signs of crowding have raised the odds of a short-term correction.
Key chart
Our stock-bond model is Overweight equities.
A model score of +3 out
of 5 indicates clear preference for equities over bonds, given supportive fundamental and technical factors
Fig. 39 Breakdown of our stock-bond rotation model’s scores
Short-term technical model remains bullish
the S&P500 index. Probability of bear
market fell to 0.9%
as volatility indicators subsided from
November highs
Fig. 40 Our technical model is bullish S&P500
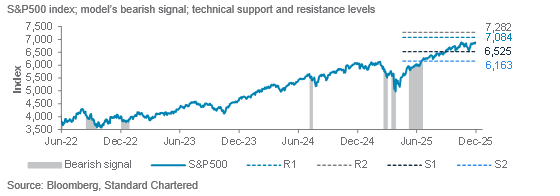
Fig. 41 Long- and short-term quantitative models are bullish risky assets
Long-term models below have a typical time horizon of 3-6 months, while short-term models have a 1-3 month horizon
Resilient portfolios through change
|
|
||||
The world’s economic tides are shifting once again. Over the past year, we have witnessed a remarkable degree of resilience across the global economy – growth has held firm despite the tightest monetary policies we have seen in decades. Inflation, while no longer running hot, has settled at levels slightly warmer than the pre-pandemic norm, suggesting we have now entered a world of higher nominal growth and more persistent price pressures.
This new equilibrium – one of moderate growth, above-target inflation and elevated real yields – has important implications for long-term capital market assumptions (CMAs), which form the building block for developing strategic asset allocations.
A new economic order: Fragmentation meets innovation
The global economy is becoming more fragmented with geopolitical rivalry, industrial policy and regional blocs reshaping the movement of goods, capital and technology. Supply chains are being rewired, and national strategic priorities increasingly influence investment flows. Under typical circumstances, this degree of fragmentation would point to slower global growth and weaker trend productivity.
We expect global real growth to remain muted over the next five years, reflecting tighter labour markets, higher capital costs and persistent geopolitical frictions. At the same time, inflation has stabilised at a structurally higher level than before COVID. While no longer volatile, it is unlikely to return to the ultra-low regime of the 2010s, as supply side pressures and industrial policies keep price levels elevated.
Yet fragmentation is being partially offset by rapid progress in technology and AI. While these innovations are not enough to fully offset the drag from fragmentation, they help cushion the downside, supporting corporate margins, playing an increasingly vital role in sustaining long-term growth. For investors, this combination forms a new equilibrium: lower real growth, higher trend inflation and a wider dispersion of outcomes, shifting CMAs across asset classes.
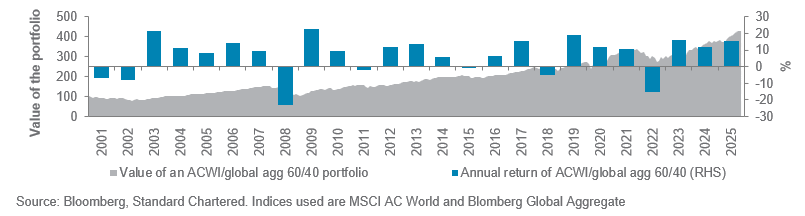
Against this backdrop, the implication for a diversified portfolio is meaningful. Historically, a 60/40 equity/bond allocation generated positive annual returns roughly 76% of the time over the last 25 years. Looking ahead, the expected returns for a 60/40 portfolio remain constructive at 6.1%, supported by higher carry in fixed income and stable, though moderating, equity earnings growth, still serving as a good starting point for long-term investors.

Fig. 42 A 60/40 equity/bond portfolio has delivered positive annual returns 76% of the time over the last 25 years, serving as a stable foundation for investors
Annual returns and growth of a 60/40 equity/bond portfolio
Government bonds and rates – improved starting points
Yields across major Developed Markets (DMs) remain elevated, above their 2010-20 averages after the global rate hiking cycle reset the fixed income landscape. Historically, starting yields helped explain the majority of long-term bond returns, meaning today’s levels materially improve expected total returns compared with the low-rate era.
Although equity-bond correlations are elevated, bonds are gradually regaining their traditional diversification benefits, with the correlation easing from the 2022 extremes. Within a portfolio context, government bonds should serve as a reliable portfolio anchor, combining attractive income with moderate capital appreciation potential.
Fig. 43 Correlations between equities and bonds have trended down after the peak in 2022
3-year rolling equity-bond correlation
Credit – stable income, tighter spreads
Credit markets remain fundamentally sound, supported by resilient corporate earnings and disciplined debt management. However, spreads have tightened meaningfully over the past year. Both Investment Grade (IG) and High Yield (HY) bond spreads sit well below their long-term averages of about 100-150bps and 450-500bps, respectively.
This means that the balance of return drivers shifts towards carry (i.e. yield) rather than capital gains. The good news: the rise in base rates since 2021 means all-in yields remain attractive by historical standards, even if spreads offer less cushion. IG credit benefits from strong issuer fundamentals and should deliver steady, income-led returns, while HY offers higher yields, but requires careful issuer selection. Relative to last year’s assumptions, expected returns in this update are modestly higher due to tighter valuations.
Equities – attractive returns despite challenging valuations
Equity markets are expected to deliver moderate, but sustainable returns through 2026. DM – particularly in the US – continue to be supported by productivity gains, strong corporate cash flows and structural trends such as AI adoption. Valuations remain elevated in some segments, but earnings growth is projected to broaden beyond the mega-cap leaders. Emerging Markets offer a more attractive valuation entry point, especially where the monetary policy has already eased. Compared to last year’s assumptions, US
equities show modest improvement due to stronger earnings momentum and productivity gains driven by artificial intelligence. Additionally, enhanced macroeconomic conditions and favourable currency trends are contributing to a more positive outlook for certain Emerging Market regions.
Alternatives – a diversified source of returns
Alternatives and real assets stand out as another key source of returns. Private markets remain attractive thanks to illiquidity premia and improved financing conditions. Real assets – such as infrastructure and real estate – benefit from long-term structural demand, inflation linkage and increased public and private capital spending. Digital Assets have been gaining traction, although their adoption remains small relative to traditional assets like equities or bonds. They have delivered strong returns with high volatility i.e., even small allocations can noticeably influence portfolio risk and return characteristics. Importantly, Alternative assets’ historically low correlation with equities, bonds and gold offers potential diversification benefits within broader portfolios. Even in a slower-growth regime, these assets can generate robust risk-adjusted returns; their diversification benefits should become more valuable as public markets face tighter return dispersion.
Portfolio considerations
The 2026 CMAs reflect a world of moderate growth, steadier inflation and structurally higher yields. We see the efficient frontier curve flatter than last year, given improved bond yields and broadly stable equity returns.
While the outlook is marginally better, investors should not be complacent. Achieving higher returns now depends on thoughtful diversification, not just increased risk. With uneven risk distribution and unpredictable events, disciplined processes, diversification and robust risk management remain essential investment principles.
Well-balanced portfolios – anchored by quality bonds, with selective equity exposure to innovation and AI, and enhanced by alternatives – remains the most reliable way forward.
Fig. 44 Stock-bond frontier has flattened, implying minor changes in allocations in strategic portfolios
Stock-bond efficient frontiers during 2024, 2025 and 2026
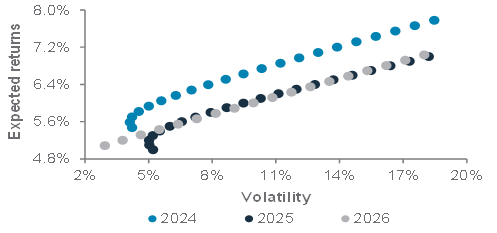
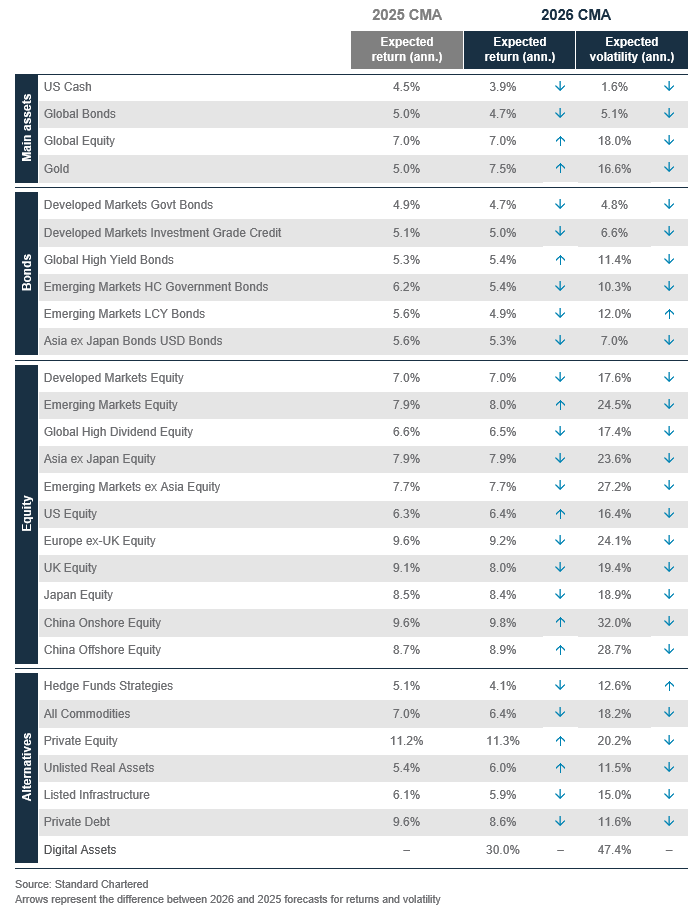
Fig. 45 Return assumptions saw marginal changes, with still robust returns forecast over the next five years
Five-year capital market assumptions of key assets
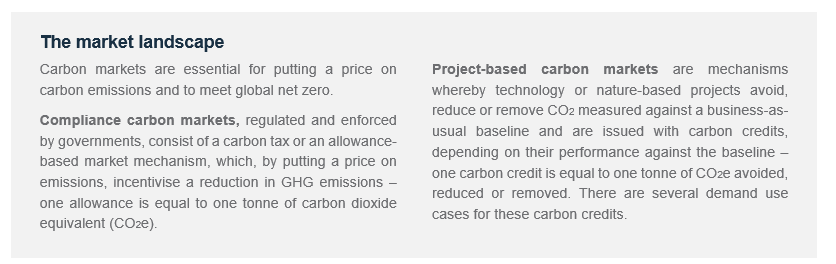
Carbon markets: Fluff or a concrete opportunity?
|
|
||||
Carbon markets reached their highest traded volume and market value levels between 2021 and 2023, when both compliance and project-based carbon markets experienced record transaction levels and market expansion. This was driven by ambitious climate targets and both governmental and corporate commitments.
Carbon markets are expected to expand, driven by new and scaled ETS launches, revised carbon taxes, tighter compliance frameworks and national climate finance packages. This asset class is establishing a prominent footprint and becoming a fundamental mechanism to mobilise and channel funds within the global financial ecosystem. Early market entrants can position themselves to capture significant value as these markets mature and scale over the next few years.
According to the World Bank’s State and Trends of Carbon Pricing 2025 report, there are around 37 emissions trading systems (ETS) and 43 carbon taxes, which collectively cover about 28% of global greenhouse gas (GHG) emissions. Compliance markets continue to dominate carbon markets. In 2024, close to USD 950bn worth of allowances were traded, covering over a quarter of global emissions. The EU ETS alone generated EUR 648bn in secondary trading in 2023, largely through derivatives.3
Why consider carbon markets now?
EU climate and energy package and CBAM
The EU ETS represents the largest portion of traded value in the compliance markets, accounting for over 74% of the market size in 2024. The EU’s climate and energy package for 2026, along with the creation of the Social Climate Fund (SCF), is expected to further support its emissions trading scheme. The existing EU ETS is becoming tighter, with fewer free allowances and inclusion of new sectors, and the compliance markets look likely to expand their scope over the next few years. The Carbon Border Adjustment Mechanism’s (CBAM’s) full implementation beginning in 2026 will necessitate EU importers to purchase CBAM
certificates reflecting the carbon intensity of their imported goods. While CBAM is likely to directly impact compliance markets, their influence could also extend to project-based markets, potentially influencing demand and pricing dynamics.
Expansion of compliance markets in EMs
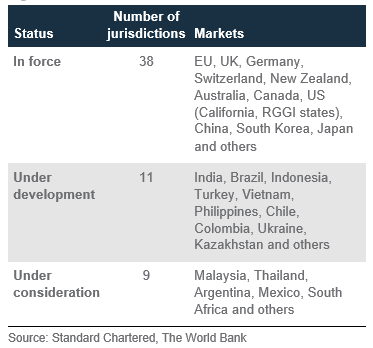
Over 11 jurisdictions have ETS frameworks under development (likely launching in 2026), and 9 others are considering introducing ETS. Several of them are Emerging Markets (EMs), indicating that the next phase of carbon market growth could be driven by these regions. 2026 will see new compliance market launches, notably in India, whose compliance market
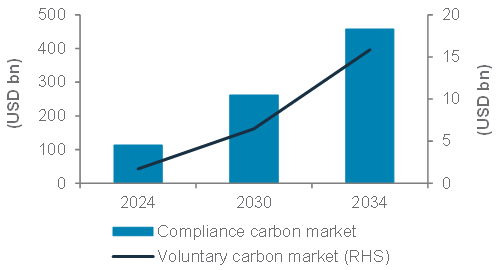
will scope in nine sectors, with plans to expand to include coal-fired power generation at a later stage. Growth projections suggest the global compliance carbon market is entering a new phase of institutional maturity and will see significant growth, potentially reaching a trading value of USD 4.41trn by 2030.
Fig. 46 ETS status worldwide
Increased carbon taxes
Carbon taxes are imposed by governments on GHG emissions, typically a fixed value charged per tonne of CO2e. The World Bank’s 2025 report mentions that carbon taxes are now implemented in 43 nations worldwide, covering a significant portion of global emissions. Several economies, particularly in Asia Pacific and Latin America, are either introducing new carbon taxes or planning to raise existing ones in 2026.Singapore’s carbon tax will increase to SGD 45/tonne of CO2e in 2026 and potentially between SGD 50/tonne and SGD 80/tonne of CO2e by 2030.
Fig. 47 Compliance and project-based carbon growth by market size
Hybrid carbon markets
Compliance markets are being increasingly complemented with project-based mechanisms. For example, in Singapore,
corporates subject to the carbon tax can offset up to 5% of their exposure to the tax with specific high-quality project-based carbon credits. A similar mechanism is in place in China and South Africa, with other countries also considering this hybrid mechanism, for example Vietnam.
The Carbon Offsetting and Reduction Scheme for International Aviation (CORSIA) is a compliance scheme established by the International Civil Aviation Organisation (ICAO), which requires airlines to purchase specific project-based carbon credits for emissions over and above their given baseline, based on 2019 emission levels. Over 120 countries have signed up for the scheme’s first phase. The current demand forecast for CORSIA-eligible carbon credits in phase 1 is 210-230m tonnes, but there is limited supply to meet this demand.
Increased buying activity and opening of large markets
in project-based carbon markets
The global compliance market was valued at around USD 113bn in 2024 and is expected to grow by about 15% annually between 2025 and 2034. Beyond corporates purchasing carbon credits, governments are increasingly entering the market as buyers. Singapore announced in September 2025 that it will buy approximately SGD 76.4m worth of carbon credits from international projects. As governments look to meet their national climate targets, we expect carbon markets to feature among their strategies.
The project-based market was valued at USD 1.7bn in 2024 and is expected to grow by around 25% between 2025 and 2034, driven by the opening up of new markets. In November 2025, Indonesia inked an MoU with the Integrity Council for the Voluntary Carbon Market (ICVCM), an independent governance body for the market. Such initiatives indicate likely buying activity in both compliance and project-based markets in the near future.
Technology’s transformational impact on carbon markets
Digital platforms and blockchain technology are significantly enhancing transparency and traceability, reducing fraud and boosting investor confidence. Key innovations such as real-time tracking and automated verification are driving efficiency, scalability and liquidity, making carbon markets increasingly accessible and reliable for investors. The World Bank estimates that carbon markets could potentially save USD 250bn annually by 2030 with improved transparency and interoperability.
Do carbon markets fit into your wealth journey?
- Carbon can be a portfolio diversifier, owing to its low correlation with traditional assets. This is because carbon markets are driven by a unique set of factors, such as emission caps, climate targets and regulatory policies, which do not impact conventional markets
- Carbon credits can be wealth preservation assets because their value is fundamentally linked to global decarbonisation efforts and regulatory demand rather than short-term market cycles, which makes them resilient and enhances their ability to maintain purchasing power over time. Within the carbon market, a range of options support the dual objective of achieving financial returns alongside positive environmental impact. They include:
- Timberland (managed forestland) offers a compelling mix of steady yields, carbon credits and inflation protection
- Blue carbon projects restore mangroves and seagrass that store up to 4x more carbon than forests
- Biochar initiatives improve soil health and crop yields, thereby increasing return on investment
- By 2030, carbon funds may exceed USD 50bn annually, driven by regulatory tightening and expanding corporate net-zero commitments. The limited supply of high-quality credits creates scarcity value, positioning them as a store of value, similar to art and real estate. There is increased interest to integrate carbon credits into wealth portfolios as sophisticated investors want to inculcate climate stewardship within their legacy
How can investors participate?
Individual investors can participate in carbon markets in a
few ways:
- Carbon market exchange-traded funds (ETFs) are based on compliance markets and are built around carbon credit or allowance trading
- Outcome bonds are tied to specific carbon credit projects and have well-defined goals. They appeal to investors who are focused on their investment’s impact
- Carbon-themed structured notes are investments that have their underlying assets linked to a carbon ETF
- There are a few private equity strategies that include carbon markets as one of their investment themes, such as broader forestry funds. However, there are no dedicated carbon market private equity strategies yet
- Direct investing in companies that primarily focus on buying and selling carbon credits or have their own carbon projects is yet another way to explore these investments. However, this route is generally less diversified and riskier
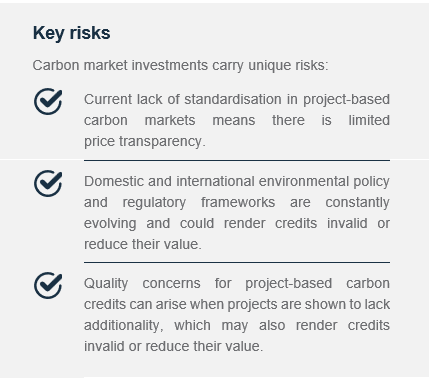

Performance review
Foundation: Asset allocation summary
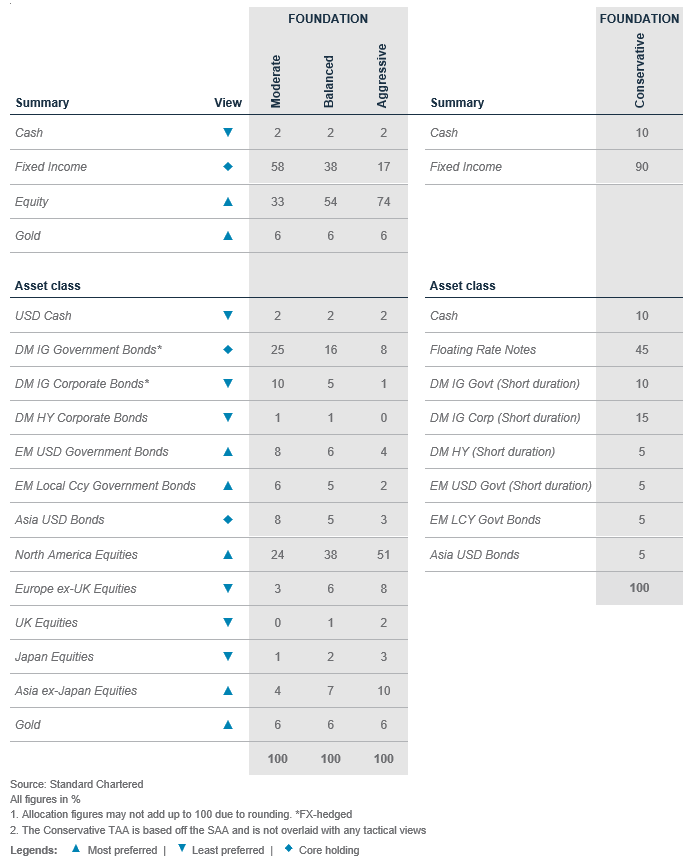
Foundation+: Asset allocation summary
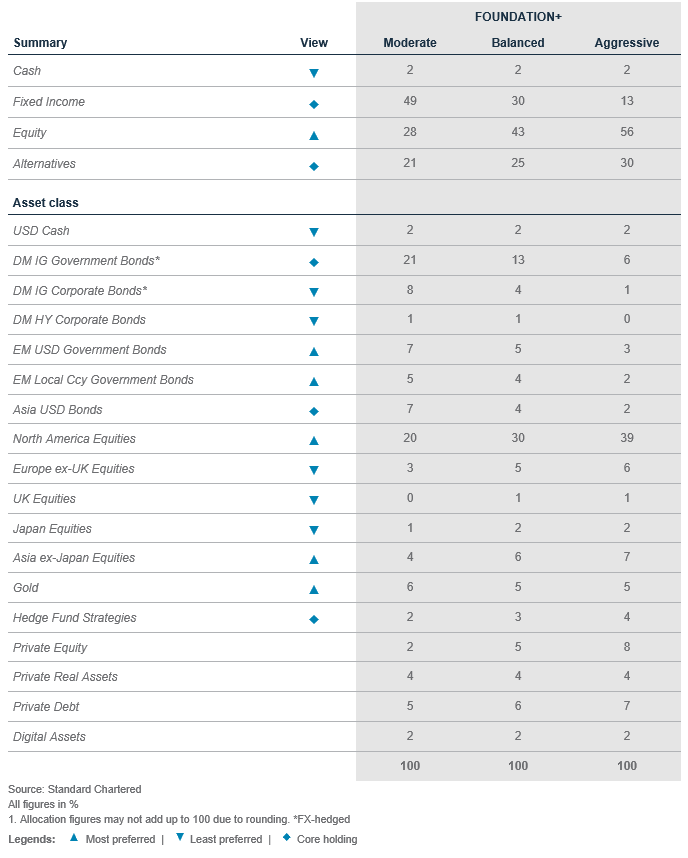
Market performance summary
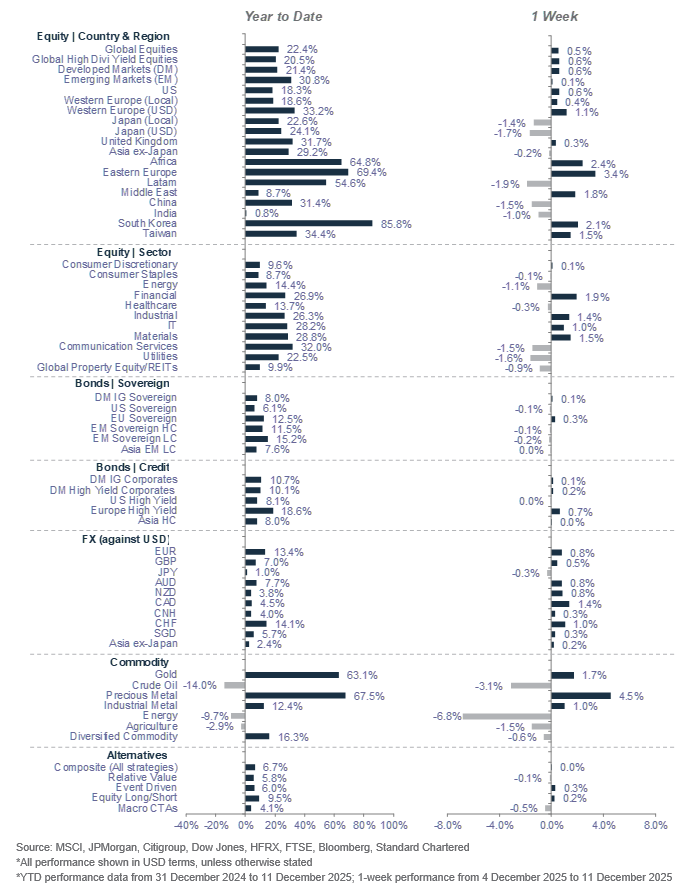
Our key forecasts and calendar events
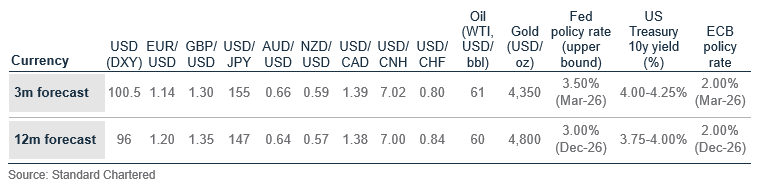
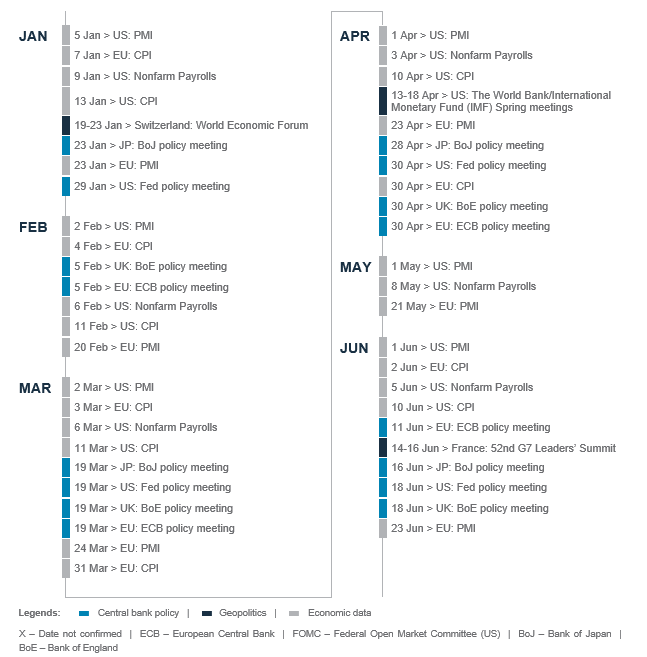
SC Wealth Select


Explanatory notes
1. The figures on page 7 show allocations for a moderately aggressive risk profile only – different risk profiles may produce significantly different asset allocation results. Page 7 is only an example, provided for general information only and they do not constitute investment advice, an offer, recommendation or solicitation. They do not take into account the specific investment objectives, needs or risk tolerances of a particular person or class of persons and they have not been prepared for any particular person or class of persons.
2. Contingent Convertibles are complex financial instruments and are not a suitable or appropriate investment for all investors. This document is not an offer to sell or an invitation to buy any securities or any beneficial interests therein. Contingent convertible securities are not intended to be sold and should not be sold to retail clients in the European Economic Area (EEA) (each as defined in the Policy Statement on the Restrictions on the Retail Distribution of Regulatory Capital Instruments (Feedback to CP14/23 and Final Rules) (“Policy Statement”), read together with the Product Intervention (Contingent Convertible Instruments and Mutual Society Shares) Instrument 2015 (“Instrument”, and together with the Policy Statement, the “Permanent Marketing Restrictions”), which were published by the United Kingdom’s Financial Conduct Authority in June 2015), other than in circumstances that do not give rise to a contravention of the Permanent Marketing Restrictions.
Disclosure
This document is confidential and may also be privileged. If you are not the intended recipient, please destroy all copies and notify the sender immediately. This document is being distributed for general information only and is subject to the relevant disclaimers available at our Standard Chartered website under Regulatory disclosures. It is not and does not constitute research material, independent research, an offer, recommendation or solicitation to enter into any transaction or adopt any hedging, trading or investment strategy, in relation to any securities or other financial instruments. This document is for general evaluation only. It does not take into account the specific investment objectives, financial situation or particular needs of any particular person or class of persons and it has not been prepared for any particular person or class of persons. You should not rely on any contents of this document in making any investment decisions. Before making any investment, you should carefully read the relevant offering documents and seek independent legal, tax and regulatory advice. In particular, we recommend you to seek advice regarding the suitability of the investment product, taking into account your specific investment objectives, financial situation or particular needs, before you make a commitment to purchase the investment product. Opinions, projections and estimates are solely those of SC at the date of this document and subject to change without notice. Past performance is not indicative of future results and no representation or warranty is made regarding future performance. The value of investments, and the income from them, can go down as well as up, and you may not recover the amount of your original investment. You are not certain to make a profit and may lose money. Any forecast contained herein as to likely future movements in rates or prices or likely future events or occurrences constitutes an opinion only and is not indicative of actual future movements in rates or prices or actual future events or occurrences (as the case may be). This document must not be forwarded or otherwise made available to any other person without the express written consent of the Standard Chartered Group (as defined below). Standard Chartered Bank is incorporated in England with limited liability by Royal Charter 1853 Reference Number ZC18. The Principal Office of the Company is situated in England at 1 Basinghall Avenue, London, EC2V 5DD. Standard Chartered Bank is authorised by the Prudential Regulation Authority and regulated by the Financial Conduct Authority and Prudential Regulation Authority. Standard Chartered PLC, the ultimate parent company of Standard Chartered Bank, together with its subsidiaries and affiliates (including each branch or representative office), form the Standard Chartered Group. Standard Chartered Private Bank is the private banking division of Standard Chartered. Private banking activities may be carried out internationally by different legal entities and affiliates within the Standard Chartered Group (each an “SC Group Entity”) according to local regulatory requirements. Not all products and services are provided by all branches, subsidiaries and affiliates within the Standard Chartered Group. Some of the SC Group Entities only act as representatives of Standard Chartered Private Bank and may not be able to offer products and services or offer advice to clients.
Copyright © 2026, Accounting Research & Analytics, LLC d/b/a CFRA (and its affiliates, as applicable). Reproduction of content provided by CFRA in any form is prohibited except with the prior written permission of CFRA. CFRA content is not investment advice and a reference to or observation concerning a security or investment provided in the CFRA SERVICES is not a recommendation to buy, sell or hold such investment or security or make any other investment decisions. The CFRA content contains opinions of CFRA based upon publicly-available information that CFRA believes to be reliable and the opinions are subject to change without notice. This analysis has not been submitted to, nor received approval from, the United States Securities and Exchange Commission or any other regulatory body. While CFRA exercised due care in compiling this analysis, CFRA, ITS THIRD-PARTY SUPPLIERS, AND ALL RELATED ENTITIES SPECIFICALLY DISCLAIM ALL WARRANTIES, EXPRESS OR IMPLIED, INCLUDING, BUT NOT LIMITED TO, ANY WARRANTIES OF MERCHANTABILITY OR FITNESS FOR A PARTICULAR PURPOSE OR USE, to the full extent permitted by law, regarding the accuracy, completeness, or usefulness of this information and assumes no liability with respect to the consequences of relying on this information for investment or other purposes. No content provided by CFRA (including ratings, credit-related analyses and data, valuations, model, software or other application or output therefrom) or any part thereof may be modified, reverse engineered, reproduced or distributed in any form by any means, or stored in a database or retrieval system, without the prior written permission of CFRA, and such content shall not be used for any unlawful or unauthorized purposes. CFRA and any third-party providers, as well as their directors, officers, shareholders, employees or agents do not guarantee the accuracy, completeness, timeliness or availability of such content. In no event shall CFRA, its affiliates, or their third-party suppliers be liable for any direct, indirect, special, or consequential damages, costs, expenses, legal fees, or losses (including lost income or lost profit and opportunity costs) in connection with a subscriber’s, subscriber’s customer’s, or other’s use of CFRA’s content.
Market Abuse Regulation (MAR) Disclaimer
Banking activities may be carried out internationally by different branches, subsidiaries and affiliates within the Standard Chartered Group according to local regulatory requirements. Opinions may contain outright “buy”, “sell”, “hold” or other opinions. The time horizon of this opinion is dependent on prevailing market conditions and there is no planned frequency for updates to the opinion. This opinion is not independent of Standard Chartered Group’s trading strategies or positions. Standard Chartered Group and/or its affiliates or its respective officers, directors, employee benefit programmes or employees, including persons involved in the preparation or issuance of this document may at any time, to the extent permitted by applicable law and/or regulation, be long or short any securities or financial instruments referred to in this document or have material interest in any such securities or related investments. Therefore, it is possible, and you should assume, that Standard Chartered Group has a material interest in one or more of the financial instruments mentioned herein. Please refer to our Standard Chartered website under Regulatory disclosures for more detailed disclosures, including past opinions/ recommendations in the last 12 months and conflict of interests, as well as disclaimers. A covering strategist may have a financial interest in the debt or equity securities of this company/issuer. All covering strategist are licensed to provide investment recommendations under Monetary Authority of Singapore or Hong Kong Monetary Authority. This document must not be forwarded or otherwise made available to any other person without the express written consent of Standard Chartered Group.
Sustainable Investments
Any ESG data used or referred to has been provided by Morningstar, Sustainalytics, MSCI or Bloomberg. Refer to 1) Morningstar website under Sustainable Investing, 2) Sustainalytics website under ESG Risk Ratings, 3) MCSI website under ESG Business Involvement Screening Research and 4) Bloomberg green, social & sustainability bonds guide for more information. The ESG data is as at the date of publication based on data provided, is for informational purpose only and is not warranted to be complete, timely, accurate or suitable for a particular purpose, and it may be subject to change. Sustainable Investments (SI): This refers to funds that have been classified as ‘ESG Intentional Investments – Overall’ by Morningstar. SI funds have explicitly stated in their prospectus and regulatory filings that they either incorporate ESG factors into the investment process or have a thematic focus on the environment, gender diversity, low carbon, renewable energy, water or community development. For equity, it refers to shares/stocks issued by companies with Sustainalytics ESG Risk Rating of Low/Negligible. For bonds, it refers to debt instruments issued by issuers with Sustainalytics ESG Risk Rating of Low/Negligible, and/or those being certified green, social, sustainable bonds by Bloomberg. For structured products, it refers to products that are issued by any issuer who has a Sustainable Finance framework that aligns with Standard Chartered’s Green and Sustainable Product Framework, with underlying assets that are part of the Sustainable Investment universe or separately approved by Standard Chartered’s Sustainable Finance Governance Committee. Sustainalytics ESG risk ratings shown are factual and are not an indicator that the product is classified or marketed as “green”, “sustainable” or similar under any particular classification system or framework.
Country/Market Specific Disclosures
Bahrain: This document is being distributed in Bahrain by Standard Chartered Bank, Bahrain Branch, having its address at P.O. 29, Manama, Kingdom of Bahrain, is a branch of Standard Chartered Bank and is licensed by the Central Bank of Bahrain as a conventional retail bank. Botswana: This document is being distributed in Botswana by, and is attributable to, Standard Chartered Bank Botswana Limited which is a financial institution licensed under the Section 6 of the Banking Act CAP 46.04 and is listed in the Botswana Stock Exchange. Brunei Darussalam: This document is being distributed in Brunei Darussalam by, and is attributable to, Standard Chartered Bank (Brunei Branch) | Registration Number RFC/61 and Standard Chartered Securities (B) Sdn Bhd | Registration Number RC20001003. Standard Chartered Bank is incorporated in England with limited liability by Royal Charter 1853 Reference Number ZC18. Standard Chartered Securities (B) Sdn Bhd is a limited liability company registered with the Registry of Companies with Registration Number RC20001003 and licensed by Brunei Darussalam Central Bank as a Capital Markets Service License Holder with License Number BDCB/R/CMU/S3-CL and it is authorised to conduct Islamic investment business through an Islamic window. China Mainland: This document is being distributed in China by, and is attributable to, Standard Chartered Bank (China) Limited which is mainly regulated by National Financial Regulatory Administration (NFRA), State Administration of Foreign Exchange (SAFE), and People’s Bank of China (PBOC). Hong Kong: In Hong Kong, this document, except for any portion advising on or facilitating any decision on futures contracts trading, is distributed by Standard Chartered Bank (Hong Kong) Limited (“SCBHK”), a subsidiary of Standard Chartered PLC. SCBHK has its registered address at 32/F, Standard Chartered Bank Building, 4-4A Des Voeux Road Central, Hong Kong and is regulated by the Hong Kong Monetary Authority and registered with the Securities and Futures Commission (“SFC”) to carry on Type 1 (dealing in securities), Type 4 (advising on securities), Type 6 (advising on corporate finance) and Type 9 (asset management) regulated activity under the Securities and Futures Ordinance (Cap. 571) (“SFO”) (CE No. AJI614). The contents of this document have not been reviewed by any regulatory authority in Hong Kong and you are advised to exercise caution in relation to any offer set out herein. If you are in doubt about any of the contents of this document, you should obtain independent professional advice. Any product named herein may not be offered or sold in Hong Kong by means of any document at any time other than to “professional investors” as defined in the SFO and any rules made under that ordinance. In addition, this document may not be issued or possessed for the purposes of issue, whether in Hong Kong or elsewhere, and any interests may not be disposed of, to any person unless such person is outside Hong Kong or is a “professional investor” as defined in the SFO and any rules made under that ordinance, or as otherwise may be permitted by that ordinance. In Hong Kong, Standard Chartered Private Bank is the private banking division of SCBHK, a subsidiary of Standard Chartered PLC. Ghana: Standard Chartered Bank Ghana Limited accepts no liability and will not be liable for any loss or damage arising directly or indirectly (including special, incidental or consequential loss or damage) from your use of these documents. Past performance is not indicative of future results and no representation or warranty is made regarding future performance. You should seek advice from a financial adviser on the suitability of an investment for you, taking into account these factors before making a commitment to invest in an investment. To unsubscribe from receiving further updates, please send an email to feedback.ghana@sc.com. Please do not reply to this email. Call our Priority Banking on 0302610750 for any questions or service queries. You are advised not to send any confidential and/or important information to Standard Chartered via e-mail, as Standard Chartered makes no representations or warranties as to the security or accuracy of any information transmitted via e-mail. Standard Chartered shall not be responsible for any loss or damage suffered by you arising from your decision to use e-mail to communicate with the Bank. India: This document is being distributed in India by Standard Chartered in its capacity as a distributor of mutual funds and referrer of any other third party financial products. Standard Chartered does not offer any ‘Investment Advice’ as defined in the Securities and Exchange Board of India (Investment Advisers) Regulations, 2013 or otherwise. Services/products related securities business offered by Standard Charted are not intended for any person, who is a resident of any jurisdiction, the laws of which imposes prohibition on soliciting the securities business in that jurisdiction without going through the registration requirements and/or prohibit the use of any information contained in this document. Indonesia: This document is being distributed in Indonesia by Standard Chartered Bank, Indonesia branch, which is a financial institution licensed and supervised by Otoritas Jasa Keuangan (Financial Service Authority) and Bank Indonesia. Jersey: In Jersey, Standard Chartered Private Bank is the Registered Business Name of the Jersey Branch of Standard Chartered Bank. The Jersey Branch of Standard Chartered Bank is regulated by the Jersey Financial Services Commission. Copies of the latest audited accounts of Standard Chartered Bank are available from its principal place of business in Jersey: PO Box 80, 15 Castle Street, St Helier, Jersey JE4 8PT. Standard Chartered Bank is incorporated in England with limited liability by Royal Charter in 1853 Reference Number ZC 18. The Principal Office of the Company is situated in England at 1 Basinghall Avenue, London, EC2V 5DD. Standard Chartered Bank is authorised by the Prudential Regulation Authority and regulated by the Financial Conduct Authority and Prudential Regulation Authority. The Jersey Branch of Standard Chartered Bank is also an authorised financial services provider under license number 44946 issued by the Financial Sector Conduct Authority of the Republic of South Africa. Jersey is not part of the United Kingdom and all business transacted with Standard Chartered Bank, Jersey Branch and other SC Group Entity outside of the United Kingdom, are not subject to some or any of the investor protection and compensation schemes available under United Kingdom law. Kenya: This document is being distributed in Kenya by and is attributable to Standard Chartered Bank Kenya Limited. Investment Products and Services are distributed by Standard Chartered Investment Services Limited, a wholly owned subsidiary of Standard Chartered Bank Kenya Limited that is licensed by the Capital Markets Authority in Kenya, as a Fund Manager. Standard Chartered Bank Kenya Limited is regulated by the Central Bank of Kenya. Malaysia: This document is being distributed in Malaysia by Standard Chartered Bank Malaysia Berhad (“SCBMB”). Recipients in Malaysia should contact SCBMB in relation to any matters arising from, or in connection with, this document. This document has not been reviewed by the Securities Commission Malaysia. The product lodgement, registration, submission or approval by the Securities Commission of Malaysia does not amount to nor indicate recommendation or endorsement of the product, service or promotional activity. Investment products are not deposits and are not obligations of, not guaranteed by, and not protected by SCBMB or any of the affiliates or subsidiaries, or by Perbadanan Insurans Deposit Malaysia, any government or insurance agency. Investment products are subject to investment risks, including the possible loss of the principal amount invested. SCBMB expressly disclaim any liability and responsibility for any loss arising directly or indirectly (including special, incidental or consequential loss or damage) arising from the financial losses of the Investment Products due to market condition. Nigeria: This document is being distributed in Nigeria by Standard Chartered Bank Nigeria Limited (SCB Nigeria), a bank duly licensed and regulated by the Central Bank of Nigeria. SCB Nigeria accepts no liability for any loss or damage arising directly or indirectly (including special, incidental or consequential loss or damage) from your use of these documents. You should seek advice from a financial adviser on the suitability of an investment for you, taking into account these factors before making a commitment to invest in an investment. To unsubscribe from receiving further updates, please send an email to clientcare.ng@sc.com requesting to be removed from our mailing list. Please do not reply to this email. Call our Priority Banking on 02 012772514 for any questions or service queries. SCB Nigeria shall not be responsible for any loss or damage arising from your decision to send confidential and/or important information to Standard Chartered via e-mail. SCB Nigeria makes no representations or warranties as to the security or accuracy of any information transmitted via e-mail. Pakistan: This document is being distributed in Pakistan by, and attributable to Standard Chartered Bank (Pakistan) Limited having its registered office at PO Box 5556, I.I Chundrigar Road Karachi, which is a banking company registered with State Bank of Pakistan under Banking Companies Ordinance 1962 and is also having licensed issued by Securities & Exchange Commission of Pakistan for Security Advisors. Standard Chartered Bank (Pakistan) Limited acts as a distributor of mutual funds and referrer of other third-party financial products. Singapore: This document is being distributed in Singapore by, and is attributable to, Standard Chartered Bank (Singapore) Limited (Registration No. 201224747C/ GST Group Registration No. MR-8500053-0, “SCBSL”). Recipients in Singapore should contact SCBSL in relation to any matters arising from, or in connection with, this document. SCBSL is an indirect wholly owned subsidiary of Standard Chartered Bank and is licensed to conduct banking business in Singapore under the Singapore Banking Act, 1970. Standard Chartered Private Bank is the private banking division of SCBSL. IN RELATION TO ANY SECURITY OR SECURITIES-BASED DERIVATIVES CONTRACT REFERRED TO IN THIS DOCUMENT, THIS DOCUMENT, TOGETHER WITH THE ISSUER DOCUMENTATION, SHALL BE DEEMED AN INFORMATION MEMORANDUM (AS DEFINED IN SECTION 275 OF THE SECURITIES AND FUTURES ACT, 2001 (“SFA”)). THIS DOCUMENT IS INTENDED FOR DISTRIBUTION TO ACCREDITED INVESTORS, AS DEFINED IN SECTION 4A(1)(a) OF THE SFA, OR ON THE BASIS THAT THE SECURITY OR SECURITIES-BASED DERIVATIVES CONTRACT MAY ONLY BE ACQUIRED AT A CONSIDERATION OF NOT LESS THAN S$200,000 (OR ITS EQUIVALENT IN A FOREIGN CURRENCY) FOR EACH TRANSACTION. Further, in relation to any security or securities-based derivatives contract, neither this document nor the Issuer Documentation has been registered as a prospectus with the Monetary Authority of Singapore under the SFA. Accordingly, this document and any other document or material in connection with the offer or sale, or invitation for subscription or purchase, of the product may not be circulated or distributed, nor may the product be offered or sold, or be made the subject of an invitation for subscription or purchase, whether directly or indirectly, to persons other than a relevant person pursuant to section 275(1) of the SFA, or any person pursuant to section 275(1A) of the SFA, and in accordance with the conditions specified in section 275 of the SFA, or pursuant to, and in accordance with the conditions of, any other applicable provision of the SFA. In relation to any collective investment schemes referred to in this document, this document is for general information purposes only and is not an offering document or prospectus (as defined in the SFA). This document is not, nor is it intended to be (i) an offer or solicitation of an offer to buy or sell any capital markets product; or (ii) an advertisement of an offer or intended offer of any capital markets product. Deposit Insurance Scheme: Singapore dollar deposits of non-bank depositors are insured by the Singapore Deposit Insurance Corporation, for up to S$100,000 in aggregate per depositor per Scheme member by law. Foreign currency deposits, dual currency investments, structured deposits and other investment products are not insured. This advertisement has not been reviewed by the Monetary Authority of Singapore. Taiwan: SC Group Entity or Standard Chartered Bank (Taiwan) Limited (“SCB (Taiwan)”) may be involved in the financial instruments contained herein or other related financial instruments. The author of this document may have discussed the information contained herein with other employees or agents of SC or SCB (Taiwan). The author and the above-mentioned employees of SC or SCB (Taiwan) may have taken related actions in respect of the information involved (including communication with customers of SC or SCB (Taiwan) as to the information contained herein). The opinions contained in this document may change, or differ from the opinions of employees of SC or SCB (Taiwan). SC and SCB (Taiwan) will not provide any notice of any changes to or differences between the above-mentioned opinions. This document may cover companies with which SC or SCB (Taiwan) seeks to do business at times and issuers of financial instruments. Therefore, investors should understand that the information contained herein may serve as specific purposes as a result of conflict of interests of SC or SCB (Taiwan). SC, SCB (Taiwan), the employees (including those who have discussions with the author) or customers of SC or SCB (Taiwan) may have an interest in the products, related financial instruments or related derivative financial products contained herein; invest in those products at various prices and on different market conditions; have different or conflicting interests in those products. The potential impacts include market makers’ related activities, such as dealing, investment, acting as agents, or performing financial or consulting services in relation to any of the products referred to in this document. UAE: DIFC – Standard Chartered Bank is incorporated in England with limited liability by Royal Charter 1853 Reference Number ZC18.The Principal Office of the Company is situated in England at 1 Basinghall Avenue, London, EC2V 5DD. Standard Chartered Bank is authorised by the Prudential Regulation Authority and regulated by the Financial Conduct Authority and Prudential Regulation Authority. Standard Chartered Bank, Dubai International Financial Centre having its offices at Dubai International Financial Centre, Building 1, Gate Precinct, P.O. Box 999, Dubai, UAE is a branch of Standard Chartered Bank and is regulated by the Dubai Financial Services Authority (“DFSA”). This document is intended for use only by Professional Clients and is not directed at Retail Clients as defined by the DFSA Rulebook. In the DIFC we are authorised to provide financial services only to clients who qualify as Professional Clients and Market Counterparties and not to Retail Clients. As a Professional Client you will not be given the higher retail client protection and compensation rights and if you use your right to be classified as a Retail Client we will be unable to provide financial services and products to you as we do not hold the required license to undertake such activities. For Islamic transactions, we are acting under the supervision of our Shariah Supervisory Committee. Relevant information on our Shariah Supervisory Committee is currently available on the Standard Chartered Bank website in the Islamic banking section. For residents of the UAE – Standard Chartered UAE (“SC UAE”) is licensed by the Central Bank of the U.A.E. SC UAE is licensed by Securities and Commodities Authority to practice Promotion Activity. SC UAE does not provide financial analysis or consultation services in or into the UAE within the meaning of UAE Securities and Commodities Authority Decision No. 48/r of 2008 concerning financial consultation and financial analysis. Uganda: Our Investment products and services are distributed by Standard Chartered Bank Uganda Limited, which is licensed by the Capital Markets Authority as an investment adviser. United Kingdom: In the UK, Standard Chartered Bank is authorised by the Prudential Regulation Authority and regulated by the Financial Conduct Authority and Prudential Regulation Authority. This communication has been approved by Standard Chartered Bank for the purposes of Section 21 (2) (b) of the United Kingdom’s Financial Services and Markets Act 2000 (“FSMA”) as amended in 2010 and 2012 only. Standard Chartered Bank (trading as Standard Chartered Private Bank) is also an authorised financial services provider (license number 45747) in terms of the South African Financial Advisory and Intermediary Services Act, 2002. The Materials have not been prepared in accordance with UK legal requirements designed to promote the independence of investment research, and that it is not subject to any prohibition on dealing ahead of the dissemination of investment research. Vietnam: This document is being distributed in Vietnam by, and is attributable to, Standard Chartered Bank (Vietnam) Limited which is mainly regulated by State Bank of Vietnam (SBV). Recipients in Vietnam should contact Standard Chartered Bank (Vietnam) Limited for any queries regarding any content of this document. Zambia: This document is distributed by Standard Chartered Bank Zambia Plc, a company incorporated in Zambia and registered as a commercial bank and licensed by the Bank of Zambia under the Banking and Financial Services Act Chapter 387 of the Laws of Zambia.