26 April 2024
Global Market Outlook
Global Market Outlook
Passing Showers
We believe the equity market pullback and the rise in bond yields have created an opportunity to add exposure to diversified Foundation allocations.
Higher-than-expected US inflation has been a key market concern, but most scenarios point to temporary weakness in markets as we expect disinflationary trends to return.
Within Foundation allocations, we continue to be Overweight equities, with a preference for the US and Japan, and Neutral bonds. Gold performed well as a short-term hedge, but may be due for a breather.
We also add Europe energy sector equities and South Korean stocks as Buy ideas within Opportunistic allocations.
How to navigate an uncertain market environment?
What are the changes to your Strategic Asset Allocation model?
What is the signal from the quantitative models?
Strategy
Investment strategy and key themes
|
|
||||
|

Our top preferences
Foundation Allocations
- OW Global equities
- In equities: US, Japan
Opportunistic Allocations
Equity BUY ideas
- US technology sector
- US comms. Services sector
- US energy sector
- India large cap equities
- China non-financial divi SOEs
Bond BUY ideas
- US inflation-protected bonds
- Europe govt. bonds (fx-hedged)
- INR local currency bonds
FX views
- Rangebound USD
Passing Showers
- We believe the equity market pullback and the rise in bond yields have created an opportunity to add exposure to diversified Foundation allocations. Higher-than-expected US inflation has been a key market concern, but most scenarios point to temporary weakness in markets as we expect disinflationary trends to return.
- Within Foundation allocations, we continue to be Overweight equities, with a preference for the US and Japan, and Neutral bonds. Gold performed well as a short-term hedge, but may be due for a breather.
- We add Europe energy sector equities and South Korean stocks as Buy ideas within Opportunistic allocations.
Inflation remains the central factor
After a stellar Q1 for equity markets, global equities turned almost 4% lower from a record high hit on 22 March amid two key concerns.
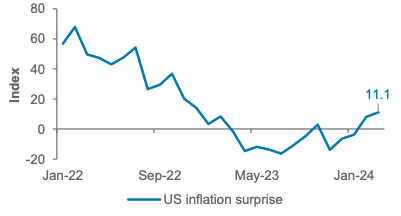
First, fears of an inflation resurgence. Several US inflation measures have beaten expectations in recent months. This led Fed Chair Powell to note that it may take ‘longer than expected’ to get to a point where the Fed would be comfortable cutting interest rates. Financial markets have slashed expectations for US interest rate cuts this year, from more than 150bps at the start of the year to around 40bps, pushing bond yields higher and equity markets lower.
Second, geopolitical concerns. Iran’s attack on Israel raised concerns of an escalation of the conflict, which in turn could potentially disrupt the production and transportation of oil in the Middle East. However, these concerns seem to be ebbing with Israel’s response seemingly aimed at avoiding further escalation.
Looking forward, we believe inflation holds the key to the outlook. In our view, a US soft landing environment is still the most likely outcome, but inflation has undoubtedly been hotter than what we would prefer. Therefore, while we still expect the Fed to cut rates this year, we believe the start of policy easing will be delayed beyond June and the Fed will cut only twice in 2024.
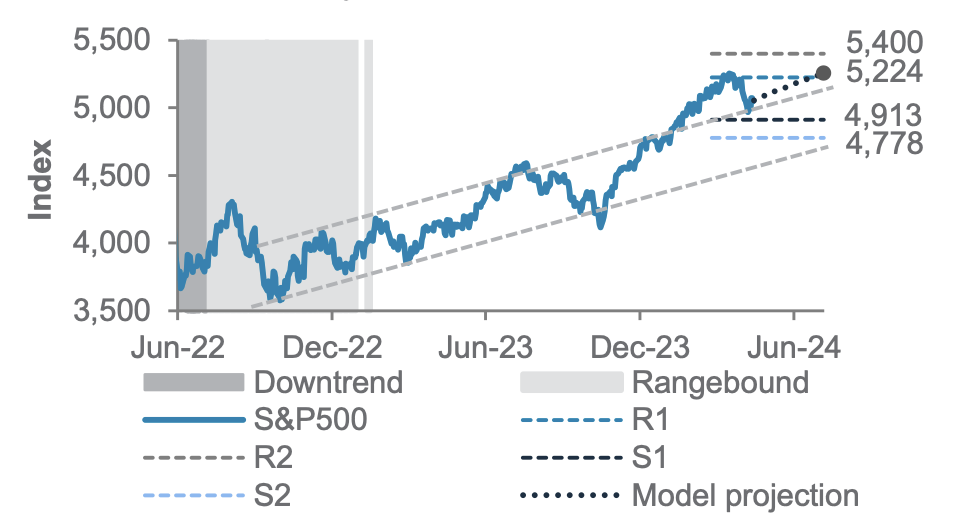
Fig. 1 Our technical model points to a short-term pullback in US stocks
S&P500 index and key technical levels
Buy the dip
Against this backdrop, we believe that the current pullback is indeed temporary, based on two reasons.
The first reason is based on our view that US disinflation is likely to resume. In this scenario, ‘immaculate disinflation’ continues – a positive outcome for equities. A second scenario is one where growth and inflation both gradually decelerate – also a positive outcome for equities as long as a recession is avoided. A third scenario involves inflation continuing to rise, forcing the Fed to hike – a negative outcome for equities. We believe the third scenario remains the least likely. Therefore, we remain positive on equities as both the likely scenarios should be supportive.
The second reason is based on signals from our quantitative models. These remain bullish on equities and other risky assets on a 6-12-month horizon, regardless of whether we consider models focused on economic or market signals.
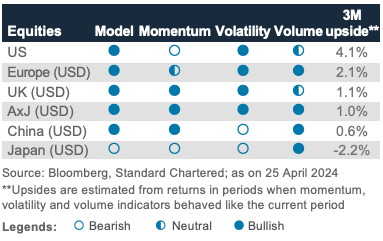
How large could a potential pullback turn out to be? Of the 3 key indicators in our short-term technical model, momentum has turned modestly negative. However, volatility and volume indicators remain supportive. Our short-term technical model overall remains bullish on the S&P500 over a 3-month horizon. This suggests that while near-term risks have risen, the chances of a deep and prolonged sell-off remains low.
This context, together with the well-known difficulty in precisely timing market peaks and troughs, is why we believe this is an opportunity to add exposure to diversified Foundation allocations that would benefit from the pullback in both equities and bonds. Investors who can hold on – and preferably add – to a diversified allocation through a market downswing are quite likely to outperform most other investors.
Taking a regional lens
Within equities, our regional preferences remain largely unchanged. We remain Overweight the US for its growth resilience, sensitivity to rate cuts and earnings. We are also Overweight Japan for its ongoing focus on shareholder-friendly reforms and continued JPY weakness – factors that give us confidence that the recent weakness is likely temporary. In contrast, we remain Underweight Euro area equities given the region’s downside growth risks and likely
Fig. 2 US inflation has surprised on the upside in recent months
US inflation surprises index
underperformance of value-style equities in the current environment. However, we close our Underweight on UK equities given higher bond yields may not be as much of a headwind as we previously expected.
Within bonds, we raise our allocation to EM USD government bonds to Overweight while reduce EM local currency bonds to Underweight. On the first, we see the recent rebound in bond yields creating an opportunity of a still-attractive yield pick-up over US government bonds and improving fiscal balances. On the second, we believe EM currencies are relatively more vulnerable to recent USD strength, a factor that risks overwhelming the asset class’s otherwise attractive yield.
Gold and other hedges
Gold has performed unusually well in 2024, rising about 13% year-to-date, on the back of US inflation surprises, demand for havens against geopolitical risk and short-covering after gold broke above its previous record high. Our concern is investor positioning, which seems crowded (usually indicative of a short-term reversal). This means that while we continue to like gold’s properties as a hedge against some of today’s key risks, we are happy to maintain a core allocation for now.
For those looking for either a hedge against the risk of higher oil prices, or an otherwise attractive opportunistic idea, we would look towards energy sector equities. In the US, we believe they are likely to outperform the broader market on improving earnings expectations. However, their correlation to oil prices means they also offer a potential hedge against any worsening of geopolitical risks that could disrupt oil supply.
Multi-Asset Income: Adding loans
While the recent rebound in US bond yields has been a near-term headwind for asset class returns, the rise improves the outlook for income-focused investors. Our Multi-Asset Income strategy continues to offer what we see as an attractive yield.
This month, we increase our allocation to leveraged loans. In our view, this segment offers some mitigation against the risk of bond yields climbing higher in the short term, while taking advantage of attractive yields in short maturities.
Foundation asset allocation models
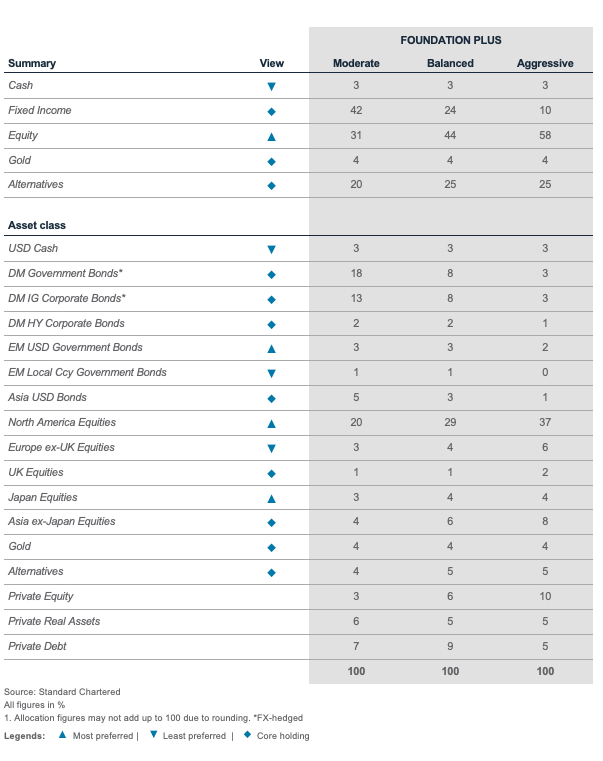
The Foundation and Foundation+ models are allocations that you can use as the starting point for building a diversified investment portfolio. The Foundation model showcases a set of allocations focusing on traditional asset classes that are accessible to most investors, while the Foundation+ model includes allocations to private assets that may be accessible to investors in some jurisdictions, but not others.
Fig. 3 Foundation asset allocation for a balanced risk profile
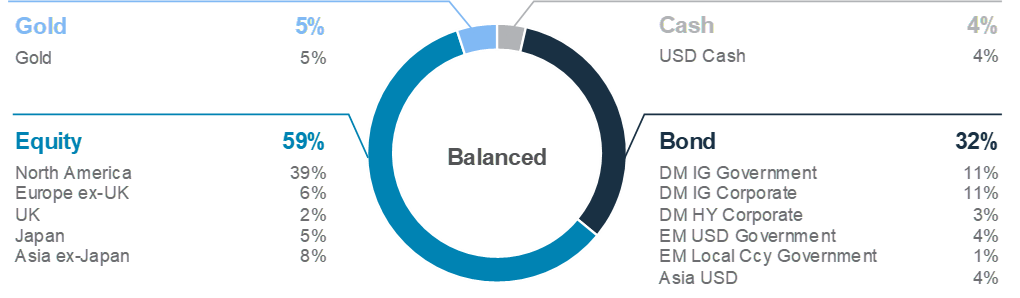
Fig. 4 Foundation+ asset allocation for a balanced risk profile

Fig. 5 Multi-asset income allocation for a moderate risk profile

Foundation: Our tactical asset allocation views
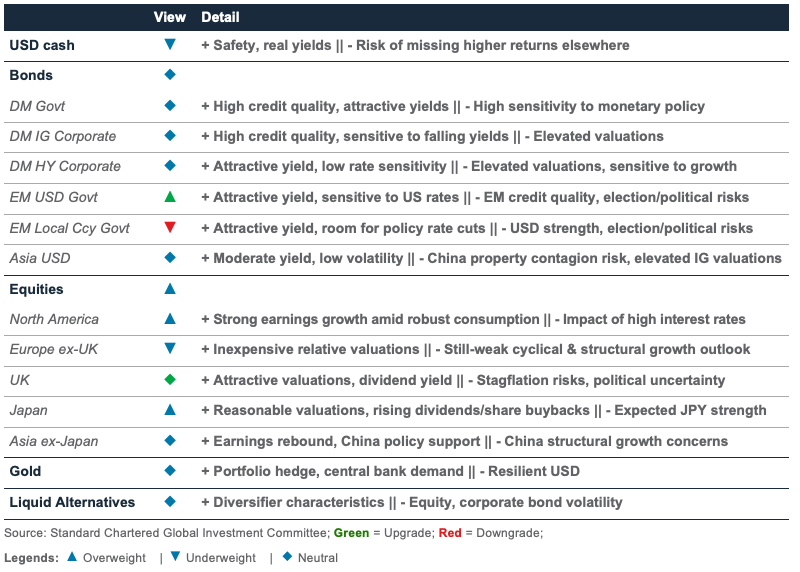
Fig. 6 Performance of our Foundation Allocations*
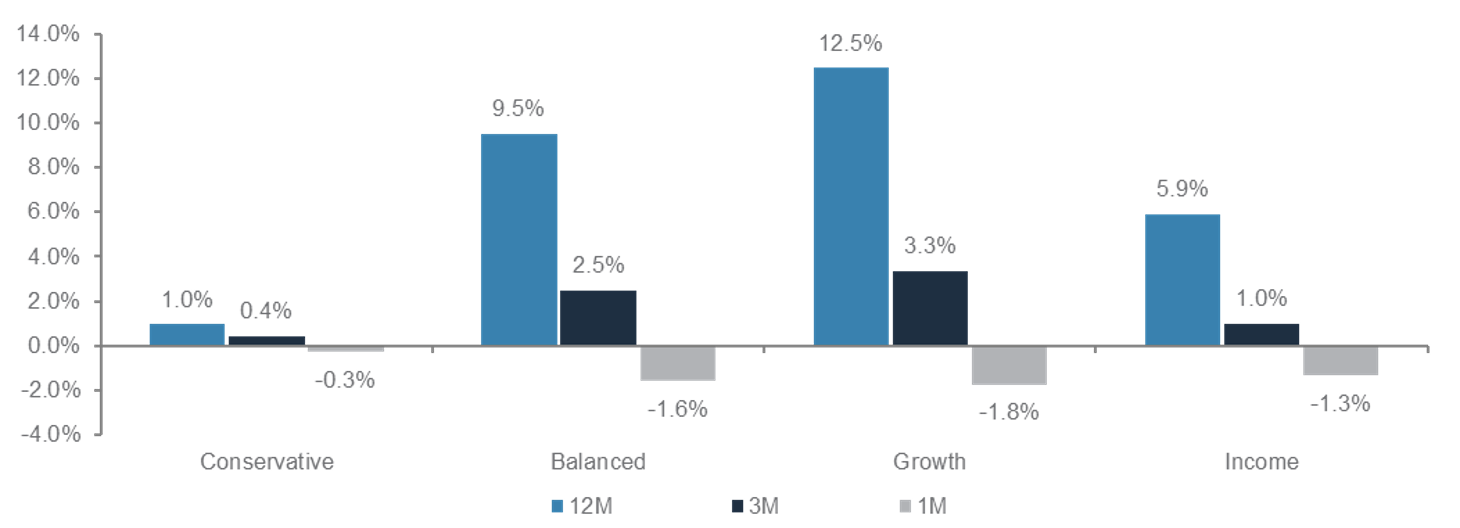
*12-month performance data from 27 March 2023 to 27 March 2024, 3-month performance from 27 December 2023 to 27 March 2024, 1-month performance from 27 February 2024 to 27 March 2024.
Perspectives on key client questions
|
|
||||
How to navigate an uncertain market environment?
The US stock market’s bull run has hit a rough patch of late. Successive higher inflation readings have challenged the disinflation thesis, and expectations of imminent Fed policy rate cuts have been pared. Bond yields have surged alongside the retreat in equity markets, raising concerns that there could be limited places for investors to seek refuge. In the face of renewed inflation risks, how should investors navigate the shifting and volatile environment ahead? Our views are as follow:
- It is important to recognise that it is normal for equity markets to experience bouts of volatility. Stay calm and do not resort to panic selling.
- A well-diversified portfolio is key to navigating the volatility ahead, as it lowers portfolio risks and outperforms a 60/40 stock-bond portfolio in most inflation/growth regimes.
- While there is a risk of a pullback in gold prices, the precious metal’s role in the portfolio as a hedge against geopolitical and inflation risks remains compelling.
- Adding Energy equity sector exposures would serve as a buffer against correlated declines in both stocks and bonds when inflation is persistent
Stay calm and do not resort to panic selling
It is important to recognise that it is normal for equity markets to experience bouts of volatility. History has shown that the worst days in equity markets have tended to be followed by its best days (Chart 7). Therefore, panic selling during periods of declines and heightened volatility can significantly lower returns for long-term investors. Drawdowns in the S&P500 have also rarely exceeded 10% in non-recession periods. This means that further downsides in the S&P500 would likely be limited, especially if our view of a soft-landing holds true.
A well-diversified portfolio is key to navigating the uncertainties ahead
A well-diversified portfolio that allocates across a range of asset classes, each with varying characteristics and performing differently under diverse market conditions, is key to navigating the uncertainties ahead. This is particularly crucial as we see the US economy heading towards crossroads.

Fig. 7 Staying invested through downturns tends to generate better returns than trying to time the market
S&P500 returns, including after leaving out the best ‘up’ days*
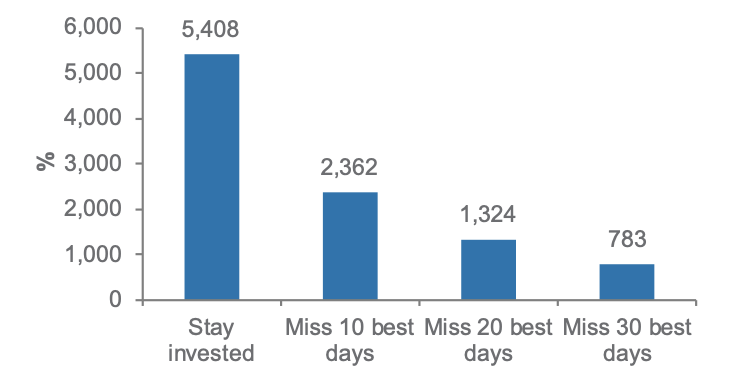
Fig. 8 The drawdown in the S&P 500 has thus far been relatively minor
Drawdown of the S&P500 index

Source: Bloomberg, Standard Chartered. *Data dating back to 1970.
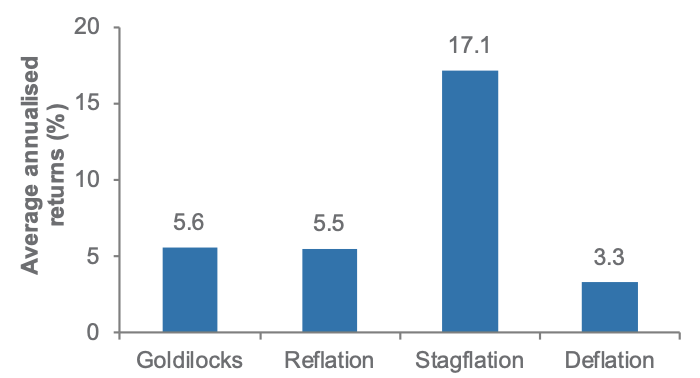
Investors need to maintain an allocation to equities to benefit from the upside should economic conditions remain resilient. They also need to allocate to bonds to hedge against the risk of a recession, to energy commodities and gold to protect the portfolio against the risk of inflation, and to cash and liquid alternatives for a source of less correlated returns. In fact, the risk-adjusted returns of a diversified portfolio have exceeded those of a 60/40 stock-bond portfolio in most growth and inflation regimes, underperforming the 60/40 portfolio only in a Goldilocks environment where a larger equity allocation tends to be more beneficial.
Fig. 9 A diversified portfolio outperforms a 60/40 portfolio in most growth/inflation regimes
Risk-adjusted returns of 60/40 vs a diversified portfolio*

Gold’s role in the portfolio remains compelling, even as the risk of a pullback remains high
DGold has decoupled from historical fundamental drivers such as real rates and the USD in recent months to rally to a fresh record high. And while we would not recommend chasing the rally (see page 14), gold’s role in the portfolio as a hedge against geopolitical tensions and inflation risks remains compelling. Gold has shown the tendency to be an all-weather asset, with the ability to provide positive returns during any growth and inflation regimes. (Chart 10) Gold’s outperformance during stagflationary environments, when growth is slowing and inflation is rising, stands out, and an allocation to gold in the portfolio would be a good hedge against the risk of inflation staying persistent.
Oil as a hedge against geopolitical tensions and inflation
While we expect the conflict in the Middle East to be contained, the situation on the ground remains fluid, and a further escalation in the conflict cannot be ruled out. Should Iranian oil production or the passage of tankers through the Strait of Hormuz come under risks, oil prices may spike, and a geopolitical risk premium in oil prices may persist. Exposure to energy commodities in the portfolio is thus vital to hedge against an escalation in tensions.
Fig. 12 US equities perform well during election
Energy equity sector as a complement to the 60/40% stock-bond portfolio
Beyond geopolitics, the energy equity sector is also well-placed to complement a 60/40% stock-bond portfolio during periods of sticky inflation and elevated stock and bond correlation. Rising inflation and real bond yields tend to weigh on both stocks and bonds, especially if they are not accompanied by better growth. This was true in 2022, when bonds did not act as a buffer to equity sell-offs, and the 60/40% stock-bond portfolio recorded its worst performance in decades. However, our analysis has shown that when the correlation between stocks and bonds turned positive, the correlation of the 60/40% portfolio with the US energy sector was more negative. The US energy sector is thus well-placed to serve as a buffer against a correlated decline in both stocks and bonds, especially if the disinflation thesis comes under increasing challenge.
Fig. 11 In periods when the equity-bond correlation has been positive, the energy equities sector has usually acted as a buffer for 60/40 portfolios
3-month correlation of weekly returns

Macro overview – at a glance
Our macroeconomic outlook and key questions
|
Key themes
Sustained US growth: US growth estimates have been revised higher as a burst of immigration last year helped in easing a labour supply crunch and sustained consumption. A recovery in global trade to also likely to help sustain the economic expansion over the next 12 months. In Europe, growth remains below trend as record high ECB rates tighten financial conditions, especially in Germany, which also faces structural challenges, such as higher energy costs and the green transition. Nevertheless, Spain and Italy are likely to benefit from the sustained fiscal support. China’s economy is gradually recovering, aided by policy support.
US heating up again: US inflation has surprised on the upside lately as shelter prices and some service sector inflation remain sticky. We expect inflation to resume last year’s downtrend in H2 as official shelter prices catch up with declining market rents. Euro area inflation is likely to cool further as growth slows. China’s disinflationary trend is linked to its property market downturn.
Pushing back Fed rate cuts: We now expect the Fed to start cutting rates in H2 (instead of June). A gradual decline in inflation in H2, albeit ending the year above the Fed’s 2% target, is likely to allow a total 50bps of cuts this year. The ECB is likely to start easing in June as inflation declines further. China is likely to ease policy again in H2 to support growth.
Key chart
US growth and inflation estimates have been revised higher lately due to sustained consumption and sticky shelter and service sector inflation; other economies, especially China, continue to see a disinflationary trend
Fig. 12 US growth, inflation estimates upgraded; China struggles with disinflation
Consensus 2024 GDP growth and inflation estimates across major economies

Macro factors to watch
US expansion continues. US 2024 growth estimates have been revised higher. Although the pace is slowing (Q1 24 q/q annualised growth slowed to 1.6%, from 3.4% growth in Q4 23 and 4.9% in Q3 23) and April’s PMIs softened, underlying growth remains robust, despite the Fed’s prior rate hikes. The resilience can be partly explained by robust corporate and household balance sheets, initially due to post-pandemic stimulus, followed by easing financial conditions since Q4 23.
The economy has received an additional boost since last year from a surge in immigration, easing labour shortages and wage pressures, while sustaining consumption. We see these trends extending into H2 and thus assign an 85% probability the US expansion will continue in the next 12 months. Resilient growth and a revival in service sector inflation are likely to cause the Fed to delay rate cuts to H2. We expect growth and inflation to eventually slow later this year as high rates start to hurt the weaker economic segments. The Fed is then likely to cut rates by 50bps by December to aid growth.
Euro area diverges. Euro area growth remains below trend and inflation continues to slow. The region faces headwinds from tightening lending conditions and record high policy rates. Additionally, Germany faces structural challenges from higher energy costs and green energy transition. While this is likely to be partly offset by sustained fiscal support in Italy and Spain, we expect the ECB to start easing policy in June to help sustain the expansion. Heightened geopolitical risks are leading Europe to boost defence spending. Any relaxation in the EU’s fiscal rules could be positive for the region’s growth.
China recovering. China’s growth rebounded to 5.3% in Q1, beating estimates. The upturn has been led by the industrial and export sectors, the latter aided by a rebound in global trade. A series of monetary and fiscal support since last year appears to have stabilised the economy. Nevertheless, a continued downturn in the property sector remains the biggest drag on business and consumer confidence, which is also reflected in sustained disinflationary pressures and depressed domestic consumption. We expect further easing of monetary policy in H2 to revive confidence and support growth.
Asset Classes
Bonds – at a glance
|
|
||||
Key themes
We have a Neutral allocation to Developed Market (DM) Investment Grade (IG) government bonds. The rise in US government bond yields has further improved the risk-reward balance, although upside inflation surprises are headwinds that are likely to keep the Fed on hold for longer than previously anticipated. We revise our 3-month target and 12-month target of the benchmark 10-year US government bond yield higher to 4.50-4.75% and 4.0%, respectively.
Higher government bond yields have naturally pushed DM IG corporate bond yields higher. However, a low yield premium over underlying government bonds, relative to history, leads us to maintain a Neutral allocation here as well. The same rationale is extended to DM High Yield (HY) corporate bonds, where we also have a Neutral allocation.
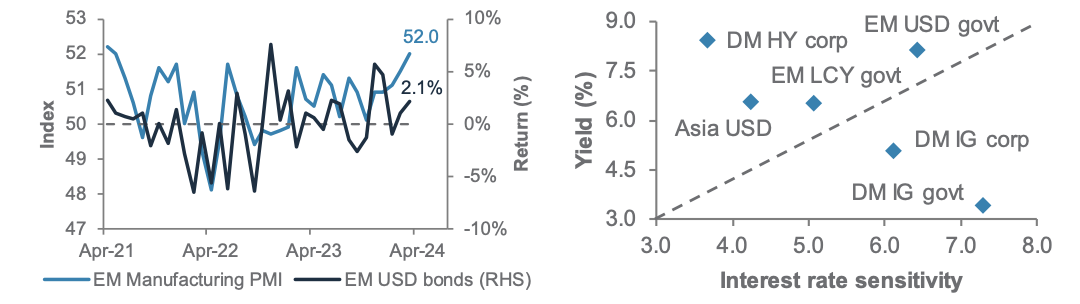
In Emerging Markets (EM), we have upgraded USD government bonds to an Overweight. EM fundamentals continue to strengthen, with fiscal balances improving to pre-pandemic levels. We view the current yield and asset class sensitivity to US bond yields as attractive. Separately, the differentiation in fiscal policies and EM currency volatility have led us to have an Underweight allocation to EM local currency government bonds. We remain tactically bullish on INR-denominated bonds.
In Asia, a mixed economic backdrop among regional countries leads us to have a Neutral Asia USD bonds allocation. Within this, we have a slight tilt towards Asia HY bonds over Asia IG bonds.
Key chart
Stronger EM fundamental backdrop is a key driver of EM USD government bonds’ outperformance; EM USD government bonds offer attractive yields comparable to DM High Yield corporate bonds
Fig. 13 Fundamental backdrop of Emerging Market has been improving
EM manufacturing PMI and MoM EM USD bonds returns; Bond asset classes yield and interest rate sensitivity
Tactical idea: Buy EUR-denominated government bonds
Inflation outlook in Euro area appears to be less sticky than the US, offering buffer for the ECB to loosen monetary policy ahead of the Fed. The weaker economic data released in recent weeks suggests Euro area economic outlook has been weakening. The dovish signal delivered by the ECB governing members this month reinforced our expectation that the ECB could cut interest rate in June. We retain our tactical buy in EUR-denominated government bonds.
Tactical idea: Buy US inflation-protected government bonds
We retain our tactical buy on US inflation-protected government bonds (TIPS) as a hedge against risks of reflation. Although our base case scenario is a disinflationary
outlook in a soft-landing economic backdrop, which typically supresses TIPS performance. In the near term, we anticipate that the rise in commodity prices will likely cloud the inflation outlook. As such, we retain our tactical buy in US inflation-protected government bonds.
Tactical idea: Buy INR-denominated bonds
India’s better-than-expected GDP growth and trade deficit data released this month continue to bolster the macroeconomic outlook. Our expectation for Indian Rupee to remain largely rangebound over the next 12 months (USD/INR forecast: 84), coupled with the fact that INR volatility remains the lowest among EM peers, has provided a stable foundation. We maintain our view that the risk-reward balance of INR-denominated bonds remains attractive and, therefore, we retain our tactical buy recommendation.
Equity – at a glance
|
|
||||
|
|
||||
Key themes
Short-term volatility can create buying opportunities. We are Overweight US equities. US macro data has been solid, offsetting the less supportive Fed outlook. US companies continue to display strong pricing power, resulting in solid net margins. We are also Overweight Japan equities. The earnings outlook is improving, ROE is rising and valuations are still attractive. The hawkish Fed is soothing some concerns about the risk of a significant rise in JPY against the USD.
We are Neutral Asia ex-Japan equities. India is our biggest Overweight. Its economy is growing the fastest among key markets within the region, and its companies have strong ROEs, justifying its expensive valuation. Korea and Taiwan are our two other Overweight positions. The tailwinds from semiconductor and AI-themes justify their heavy positioning. We are Neutral China equities. There is low expectations on the macro data, and positioning is very light – these counteract against deflationary risks and issues with its property markets. We are Neutral China onshore versus offshore. Lastly, we are Underweight ASEAN, which is overly defensive in a growth environment.
We are upgrading UK equities to Neutral. A higher-yield environment help value sectors. Euro area equities is our Underweight. Cheap valuation reflects weak EPS growth. Consumer confidence remains weak, and service inflation remains sticky.
Key chart
US equities broadening out. Earnings growth remains strong in US companies, as also in Japan equities

Fig. 14 US corporate earnings broadening out from the Magnificent-7 into other sectors. US and Japan economies and company earnings growth remain strong
US projected earnings growth by quarters; 12-month forward EPS growth in the US, Japan and Europe

Volatility creates opportunities
We retain an Overweight allocation to global equities in view of a resilient macro growth outlook. The resurgence in market volatility because of excessive positioning is likely to underscore buying opportunities in the medium term.
We are Overweight US equities amid solid corporate margins. Declining earnings growth expectations by the technology sector are offset by the broadening out of growth estimates to other value equities, in our view. Consensus forecasts are for the broader S&P500 index to climb to 17.6% by Q4 24, surpassing those of the ‘Magnificent-7’ stocks. We also have an Overweight allocation to Japan equities. The recent pullback in major benchmarks is an attractive opportunity to add to the region amid catalysts of a weakening JPY, improving corporate governance, and favourable BoJ policies, despite its termination of negative interest rate policy in March. Valuations are reasonable, with the MSCI Japan
index trading at an 11% discount to global equities, still in line with its long-term average.
We have a Neutral allocation to Asia ex-Japan equities. We are Overweight Korea and Taiwan within AxJ to benefit from the AI frenzy. We also favour India on its strong domestic growth. In contrast, we are Underweight ASEAN in view of subdued fund inflows. We retain a Neutral allocation to China equities, while we see the recent China State Council’s draft guidelines on tightening stock trading regulations as supportive of onshore equities in the near term.
We are upgrading UK equities to Neutral. They are defensive and valuations are appealing – MSCI UK index is trading at a 12m forward P/E of 11x, 0.5 SD below its long-term average. However, bearish EPS growth remain as key downside risk.
We are Underweight Euro area equities on subdued economic environment and downward-revised earnings growth expectations.
Equity opportunistic views
|
Adding to Opportunistic buy ideas
- We target positive absolute returns in our Opportunistic buy ideas. On top of the existing five ideas, we add two more: Europe energy sector and Korea equities.
New buy ideas
Europe energy: Oil demand, disciplined supply and geopolitical tensions have supported crude oil prices this year. This is supporting strong free cash flows at the integrated oil companies that dominate the Europe energy sector. The sector offers the highest dividend and share buyback yield that we believe can be sustained. A fall in the oil price is a risk.
Korea equities: The pullback in April 2024 offers an attractive buying opportunity, in our view. We expect a rise in semiconductor chip prices to drive an earnings rebound, given their large weight in Korea. We also expect the ‘Value-up’ programme to improve corporate governance and attract inflows as valuation remains attractive. Any weakness in memory chip prices is a risk.
Existing buy ideas
US technology: Inflation concerns weighed on the valuation of growth stocks in April 2024, but we expect this to reverse, as inflation resumes its decline. In addition, we continue to see strong earnings growth driven by AI spending and cloud computing. Any weakness in AI spending is a risk.
US communication services: Similarly, we expect this growth sector to benefit when inflation falls. The ongoing recovery in digital advertising and the demand for online entertainment continue to support earnings momentum in the sector. A downturn in digital advertising is a risk.
US energy sector: As we expect the oil price to be supported around the current levels, we continue to see upside risks to the consensus estimate for a drop in 2024 earnings. The sector continues to offer strong cash flows and presidential candidate Trump is a supporter of the energy industry. A fall in the oil price is a risk.
India large cap stocks: We expect the uptrend to continue with policy continuity through the ongoing elections. India’s structural story of superior growth in Asia continues to be the driver of returns, in our view. A risk is weaker-than-expected growth.
China non-financial high dividend SOEs: We continue to see investor demand for high dividend yielding SOEs. SOE
Fig. 15 Opportunistic buy ideas
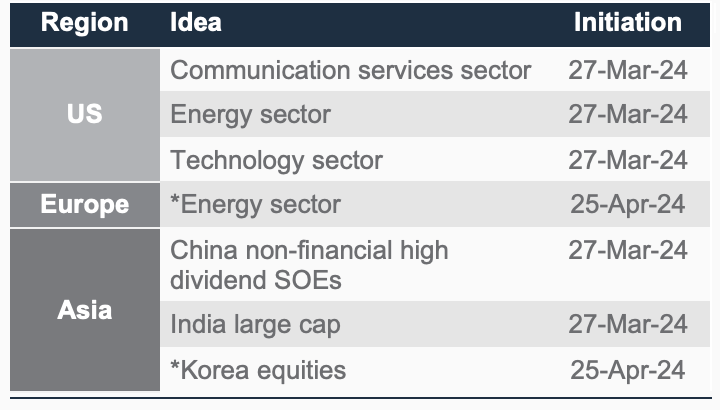
management continues to have an incentive to improve their market value and we focus on non-financial SOEs due to the lack of clarity on the financial sector’s support for the distressed property sector. Adverse regulatory changes are a risk.
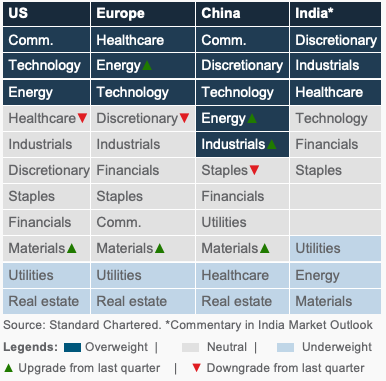
Sector views: Growth and inflation barbell
Our sector barbell strategy is evolving. We prefer sectors with secular growth exposure to the US and Europe, balanced by energy, which would benefit from inflation and geopolitical factors. In China, we continue to look for growth in consumer spending along with a cyclical recovery in technology hardware and industrials.
Fig. 16 Our sector views by region
FX – at a glance
|
Key themes
We are modestly bullish on USD over the next three months. Resilient US data is delaying the likely timing and magnitude of US monetary policy easing this year. Meanwhile, geopolitical tensions in the Middle East have triggered a safe haven bid for the greenback. However, the USD has been showing signs of exhaustion lately with the likely peaking of US government bond yields and easing of geopolitical tensions. Therefore, we expect the DXY’s upside to be capped and the index to consolidate with a three-month target of 107. We maintain our rangebound 12-month USD view, with a bearish bias, but revise the 12 month USD index (DXY) forecast to 105. The USD is likely to lose momentum once the Fed starts to cut rate in H2 24. Additionally, we expect a faster decline in Euro area inflation than the US, which may lead to further compression of the USD’s real interest rate differentials against other major economies and push the USD lower.
We revise our EUR/USD forecasts lower to 1.04 and 1.05 on 3-month and 12-month horizons, respectively. A few ECB Governing Council members have suggested June may be the right moment to cut interest rates. Furthermore, the potential negative impact of higher energy prices may act as a headwind for the region and the EUR. We expect GBP/USD to remain largely rangebound with a bearish bias over the next 3-month and 12-month horizons, as dovish MPC comments, political uncertainty and lower inflation weigh on the currency.
USD/JPY is expected to plateau around 156 over the next three months as expectations for potential official FX intervention mounts. We are bearish on the pair over 12-month horizons as we expect a gradual rise in Japan government bond yields to narrow interest rate differentials. USD/CNH is likely to remain stable in the near term as a convergence in China’s monetary policy and those of Developed Markets is likely to be counteracted by policy support around the 7.30 level. However, China’s modest growth should push the pair towards 7.28 in the next 12 months. We remain bullish on commodity currencies (especially the AUD and the NZD) as they are likely to benefit from higher commodity prices, especially if geopolitical tension rises in the Middle East.
Key chart
The real rate differentials suggest the USD is at its fair value. A further compression of USD’s real interest rate differentials in mid- to long-term is likely to put downward pressure on the USD
Our revised 3-month and 12-month FX forecasts
Fig. 17 Real interest rate differentials, a key driver of USD
DXY index, DXY-weighted interest rate differentials*; Table of forecasts

*Derived using 10-year inflation-linked government bonds; As of 23 April 2024
Existing buy ideas
The Middle East tension has been closely watched by the market. Historically, escalating tensions pose an upside risk to safe-haven currencies. However, we have seen temporary aberrations lately, i.e., the JPY and the CHF have not benefitted significantly compared with the USD. In Japan, the BoJ policy normalisation magnitude has been gradual and minimal in March. While USD/JPY broke above its previous
intervention risk level of 152, there has been no official action yet. It is likely the JPY will only regain strength once the BoJ raises rates again in autumn 2024 and the Fed starts to cut rates. The market is also suspecting that the SNB is no longer supporting the currency with purchases as Swiss foreign reserves have rebounded from a 7-year low. The market is pricing in a c70% rate cut possibility from the SNB in June 2024. Thus, we see USD/CHF at 0.92 within three months.
Gold, crude oil – at a glance
|
Key themes
We revise higher our 3-month gold forecast to USD 2,300/oz and continue to have a Neutral allocation in our portfolios. The yellow metal defied rising real yields to scale fresh all-time highs on the back of continued strong official sector and physical demand, particularly in China. Tactical positioning has also risen as investors added gold to hedge against the heightened geopolitical risks and reflationary signs. In our view, the recent price action suggests that real yields are less of a headwind at least for now. Put together, we see continued resiliency in the precious metal. Over the longer term, while we still expect the next leg of rally to be driven by rate cuts, our expectations of delayed rate cuts and the reduced role of the real yields mean that the gains are likely to be limited. Therefore, our 12-month forecast is only slightly higher at USD 2,325/oz.
We expect WTI oil to remain volatile around USD 89/bbl in the near term on tighter demand-supply. Crude oil prices have receded from the 5-month high posted during the initial Iran attack on Israel. It appears that the geopolitical risk premium is easing, but oil prices could spike on any bad tidings. The risk of further escalation and even a broader fallout, while low, is not negligible. Furthermore, the second-order effects of the conflict, such as the ramp-up of sanctions on Iranian crude oil, could exert upward pressure on oil prices. Elsewhere, there are downside supply risks lingering in the background. Demand, on the other hand, is creeping up in recent months. In the long run, the focus would return to the longer-term demand-supply forces, which we assess to be finely balanced, fading the WTI oil to around USD 82/bbl.
Key chart
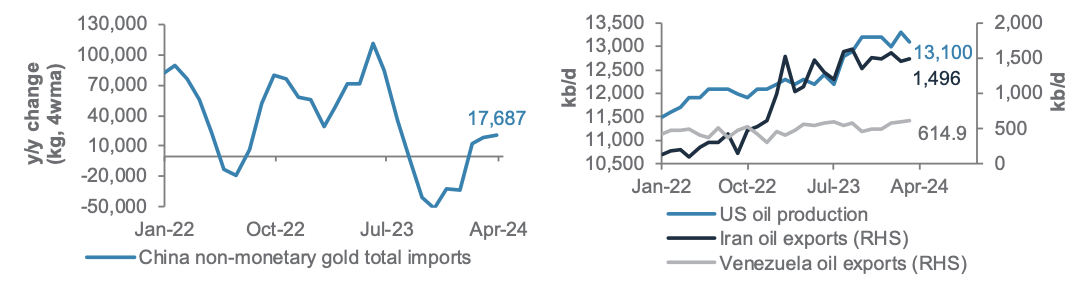
Gold demand in China is robust, supporting gold prices
Global crude oil supply sees new downside risks
Fig. 18 China gold imports surged in Q2, reflecting strong retail demand; Supply risks in the US, Iran and Venezuela are upside risks to oil prices
LHS chart: China non-monetary gold imports
RHS chart: US crude oil production, Iran oil exports and Venezuela oil exports
Chinese demand powers the rally
Earlier in the year, we wrote about how China would be a key source of gold demand this year. That is coming through in the recent data. First, the PBoC reported 17th straight monthly purchase (5 tonnes) in March, adding to the 22 tonnes purchases in the first two months of 2024. Second, retail shoppers also accumulated gold in the lead up to Lunar New Year as imports surged 34% y/y in Q1 and local market premium jumped. Third, Chinese gold ETFs saw the fourth consecutive monthly inflows in March, a stark contrast to the weak global trend. Coupled with the surge in gold prices, Chinese gold ETF AUM hit a record high of USD 5bn at the end of last month.
All this data reflects robust demand from retail buyers, investors, and central bank as they seek to diversify their assets to bullion as a store of value in these uncertain times.
Oil supply risks skewed to the downside
Oil supply has been constrained going into this year after OPEC+ announced 2.2mb/d of supply cuts last November, followed by an extension in March. Some of the offsetting factors were US’s record-high production, the return of Iranian and Venezuelan oil flows following the relaxation of sanctions. However, there were some material developments in these factors: 1) US production appears to be peaking out as Q1 supply weakened; 2) US has moved to broaden curbs on Iranian oil; 3) US re-imposed sanctions on Venezuelan oil after the temporary relief, disrupting its 600kb/d exports. Furthermore, Mexico is also reported to be reducing its exports by 330kb/d due to strong domestic demand. That said, the net impact to supply would be less than what the numbers suggest as Biden could grant waivers to the sanctions and sanctioned countries could redirect its flows.
Additional perspectives
Quant perspective
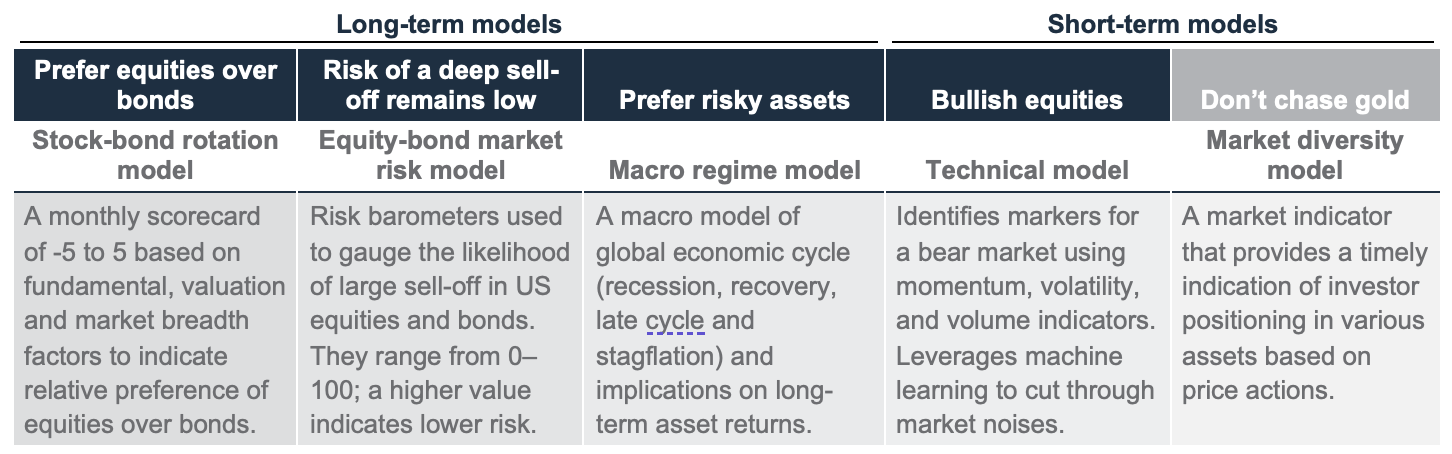
Prefers equities over bonds, do not chase gold
|
|
||||
Summary
Fundamental factors in our quantitative model remain supportive of equities over the next 3 to 6 months. Our stock-bond rotation model has generated 2.0% YTD alpha relative to a 60/40 equity/bond portfolio, despite slightly underperforming in April due to recent equity weakness. Fundamentals remain key supportive factors as macro risk remains contained and most economic data continues to surprise to the upside. Falling net-earnings upgrades is a counter factor, but any upside surprises in the ongoing US earnings season could turn this around and further strengthen the model’s conviction.
Probability of a deep sell-off in equities remains low over the next 1 to 3 months. The S&P500 retreated by 3.9% from its all-time high in March following a repricing of Fed cut expectations and the anxiety surrounding the Middle East conflict. However, it will take another 6.1% fall to even reach a correction territory and the current level is already near the channel-line support. While near-term risks have risen, our technical model, which relies on momentum, volatility and volume indicators, stays bullish for the next 3 months.
Do not chase Gold as investor positioning looks stretched. Gold had a tremendous rally since March as the recent market events have shifted investors’ focus towards safe-haven and inflation-hedge assets. Our diversity indicator has flagged for stretched investor positioning in gold since early April, which implies limited upside in chasing the rally. Gold has already retraced by 2.4% after rising 7.3% initially since March.
Key chart
Fundamental and valuation factors remain pro-risk despite recent global equity weakness
Fig. 19 Breakdown of stock-bond rotation model’s scores since inception in Feb-2023
Model scores as the sum total of fundamental, valuation and market breadth factors
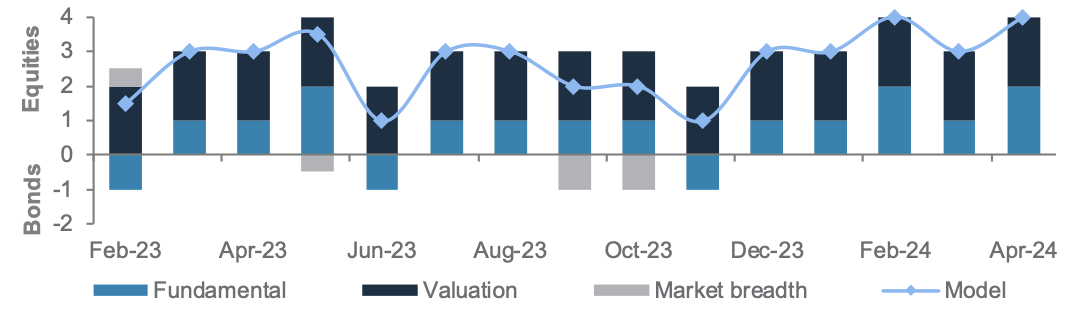
Fig. 20 Long- and short-term quantitative models are bullish risky assets
Long-term models below have a typical time horizon of 3 – 6 months, while short-term models have 1 – 3 months horizon
Stock-bond model: Still prefer equities
Our stock-bond model is scoring 4, which is bullish for equities. Since its inception in February 2023, the model has been OW global equities and UW global bonds. This has paid off with its 19% absolute return (or 3.9% in alpha). In April, the model slightly underperformed by 25bps given a 3.5% retreat in global equities (vs. 2.4% retreat in global bonds).
Fig. 21 Macro risk is still contained while economic surprises remain positive and rising
Still-supportive macro backdrop
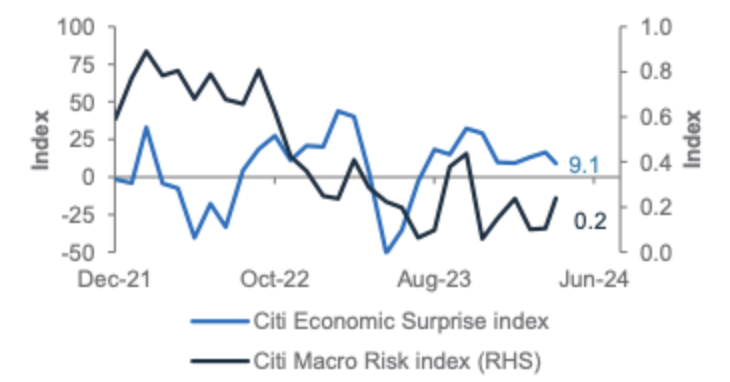
Fundamental: Bullish equities. The macro backdrop is positive as risks remain largely contained and economic surprises remain positive. The recovery in ISM manufacturing sector new orders is likely to support the earnings momentum, which has been slowing and detracting from the model’s view.
Valuation: Bullish equities. Global and Asian equities are trading within 1 standard deviation of their 5-year historical average of forward price-to-earnings ratio (lagged).
Market breadth: Neutral. Global equities were supported by a broadening of performance across equity markets, but our contrarian indicator shows net-advances in stocks are already at 2 standard deviations above the 5-year historical average.
Equity-bond risk: Deep sell-off unlikely
Our equity-bond market risk (EBMR) model continues to indicate low probabilities of a sharp sell-off in both US equities and US government bonds. Momentum indicators remain the key supportive factors for the equity barometer (73). While higher interest rates have been negative, their effects have been diminishing since Q4 23. A clearer improvement in economic data such as the US housing starts will likely solidify the barometer’s current position on equity market risks.
Meanwhile, the bond barometer (57) has maintained a low market risk stance since May 2022. Despite continued gyrations in the US government bond index, the current environment is far better than the 12% drawdown in 2020–2022, when the bond barometer suggested high bond market risks. Currently, the rise in commodity prices and the nascent recovery in ISM manufacturing sector activity are yet to cause the bond barometer to fall into the high-risk territory (due to inflationary concerns).
Fig. 22 EBMR expects low market risks
US equity and bond market risk barometers
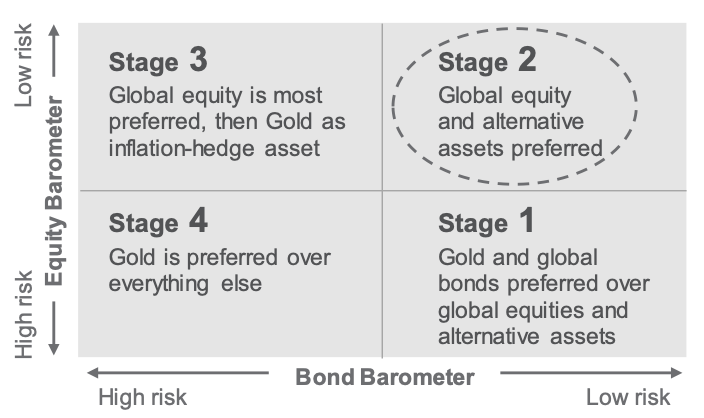
Based on our quadrant analysis of the equity and bond risk barometers, we are in the Stage 2 environment where global equities and liquid alternatives have historically performed.
Technical: Bullish equities for next 3 months
Our technical model takes learning from the past behaviours of momentum, volatility and volume indicators to identify a bear market. These models maintained an overall bullish view on equities despite their recent pullbacks, as longer-term momentum and still-low volatility levels remain supportive. The exception is Japan, where short- and medium-term momentum has turned negative along with volatility rising closer to levels seen in past bear markets.
Fig. 23 Our technical model suggests S&P500 has the highest upside despite recent weakness
S&P500 challenging channel-line support
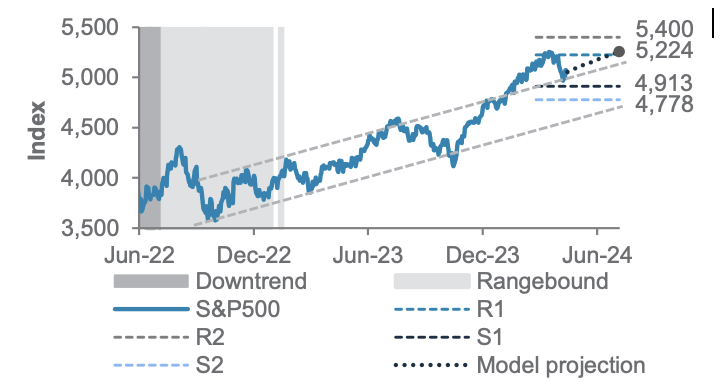
Fig. 24 Technical model’s 3-month view across equities
Refreshing our long-term SAAs
|
About Strategic Asset Allocation
A strategic asset allocation is a long-term investment strategy that sets how much one allocates to various asset classes in a portfolio. Our Strategic Asset Allocation models (SAA) are at the core of our decision-making process. Our SAAs are key to building healthy foundation portfolios with optimal risk-adjusted returns. Think of these as a ‘through-the-cycle’ guide on how you should allocate to each asset class based on your financial goals, risk tolerance and investment horizons. SAAs are optimised based on a combination of risk and long-term expected returns on asset classes. Studies suggest that over 90% of the variability in a portfolio’s performance over time is due to its strategic allocations. Given its importance, we have optimised our SAAs to deliver better expected risk-adjusted returns. The next few pages highlight the changes we have made.
We are navigating through a shifting economic landscape. Recent years have brought significant economic shifts, prompting us to reassessment of our long-term investment strategies. Factors such as rising multi-polarity, increasing inflation pressures and decarbonisation have reshaped the investment landscape, creating both opportunities and risks to our portfolio strategies.
While inflation has eased from pandemic highs, it remains a concern globally, with rising risks of prolonged higher interest rates. The complex interplay of expansive fiscal policies during the pandemic, supply chain disruptions and shift in consumer behaviours have all contributed to sustained inflation, challenges both policymakers and consumers alike. Amidst these developments, we are adjusting our SAA models, guided by our understanding of prevailing economic forces and our long-term capital market assumptions.
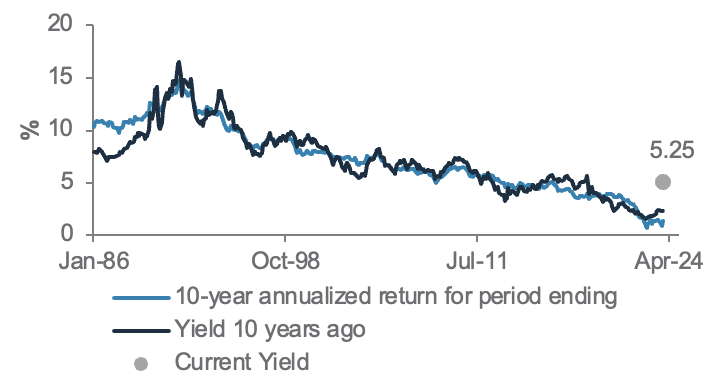
Fig. 25 Higher starting yields point towards higher bond returns in subsequent years
Bloomberg US Aggregate Bond Index returns vs starting yields*
Kept broad equity and bond exposure unchanged
Our expected returns on a 60/40 global stock-bond portfolio stands at 5.6%. Despite a slight (27bps) decline versus last year, long-term returns remain roughly in line with their historical norm of c.6.3% after hitting a high in late 2021. This
continues to indicate a reasonable starting point for a long-term investor.
Kept broad equity and bond exposure unchanged
We have increased our allocations to Developed markets (DM) at the expense of Emerging markets (EM)/Asia ex-Japan equities. Although EMs are anticipated to maintain higher returns, the premium of EM over DM has steadily diminished due to a combination of narrowing growth and the expected returns differential between EM and DM. This was also further exacerbated by the disappointing transmission of growth to earnings in EMs, particularly in China, over the past decade. In the post-pandemic era, while EM equities have been cheaper, they are more susceptible to the structural rise in multi-polarity and climate change, in contrast to the more resilient and diversified DM. The latter could also benefit from optimism surrounding AI, boosting productivity and margins.
Upping quality in fixed income; less DM HY and EM bond
We raised our allocations to DM government and Investment Grade corporate bonds, lowering exposure to DM HY and EM. Recent negative fixed income returns due to inflation and policy shocks are an anomaly, not a trend. Higher yields have improved expected returns in bonds. However, the structural shift in decarbonisation and geopolitical instability may increase growth volatility. Quality fixed income can balance the portfolio through these episodes given higher yield. As growth stabilises, these bonds may also offer attractive income potential, leading to better returns with reduced risks
Better expected returns with lower risk across SAAs
With these shifts, we expect our SAAs to deliver better risk-adjusted returns. To navigate the complexities of today’s markets, investors must be prepared to adopt a more nimble approach to their portfolios. This may involve a regular review of these long-term allocations and actively reallocating across different asset classes, sectors and regions to provide additional source of returns and portfolio diversifications.
Fig. 26 Our Strategic Asset Allocations (SAA) are the building blocks that you can use as the starting point for building diversified investment portfolios. Our basic SAAs focus on traditional asset classes that are accessible to most investors

Fig. 27 Our SAA+ model includes allocations to private assets that may be accessible to investors in some jurisdictions.

Fig. 28 The Multi-asset Income SAA contains the building blocks used as a starting point for a diversified income allocation

Fig. 29 Return assumptions for high quality bonds have been revised higher due to higher starting yields
Our seven-year capital market assumptions of key assets

Today, Tomorrow and Forever

Performance Review
Foundation: Asset allocation summary

Foundation+: Asset allocation summary
Market performance summary
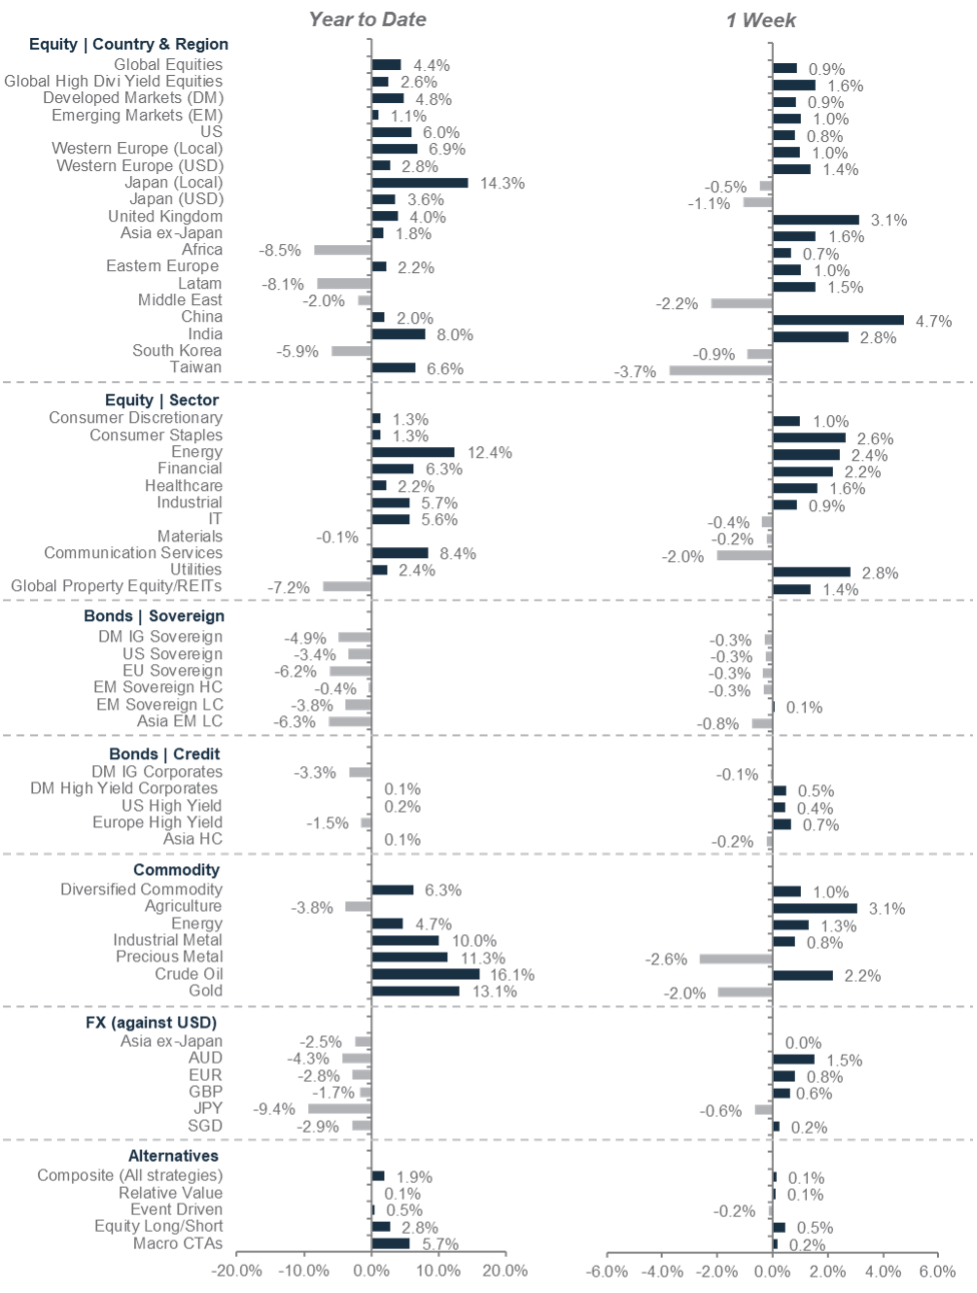
*All performance shown in USD terms, unless otherwise stated
*YTD performance data from 31 December 2023 to 27 March 2024 and 1-week performance from 21 March 2024 to 27 March 2024
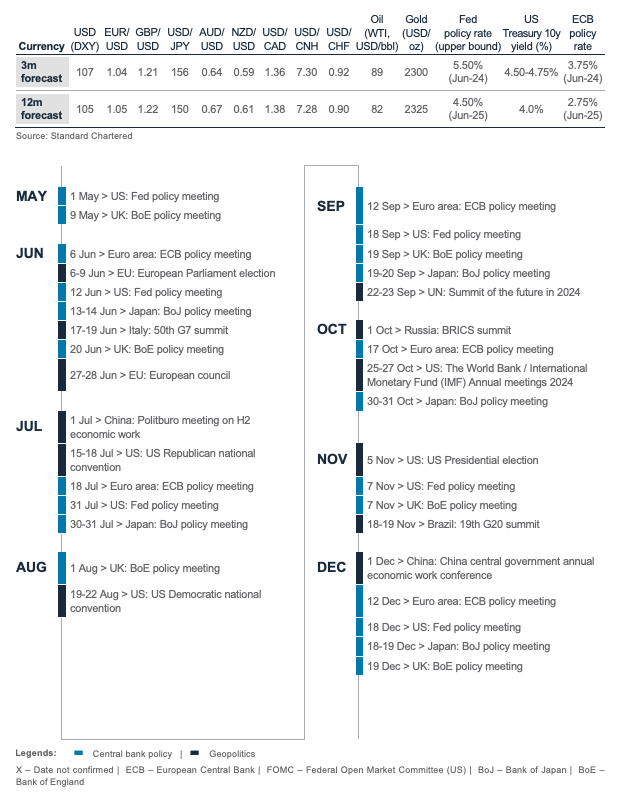
Our key forecasts and calendar events
For more CIO Office insights

Explanatory notes
1. The figures on page 5 show allocations for a moderately aggressive risk profile only – different risk profiles may produce significantly different asset allocation results. Page 5 is only an example, provided for general information only and they do not constitute investment advice, an offer, recommendation or solicitation. They do not take into account the specific investment objectives, needs or risk tolerances of a particular person or class of persons and they have not been prepared for any particular person or class of persons.
2. Contingent Convertibles are complex financial instruments and are not a suitable or appropriate investment for all investors. This document is not an offer to sell or an invitation to buy any securities or any beneficial interests therein. Contingent convertible securities are not intended to be sold and should not be sold to retail clients in the European Economic Area (EEA) (each as defined in the Policy Statement on the Restrictions on the Retail Distribution of Regulatory Capital Instruments (Feedback to CP14/23 and Final Rules) (“Policy Statement”), read together with the Product Intervention (Contingent Convertible Instruments and Mutual Society Shares) Instrument 2015 (“Instrument”, and together with the Policy Statement, the “Permanent Marketing Restrictions”), which were published by the United Kingdom’s Financial Conduct Authority in June 2015), other than in circumstances that do not give rise to a contravention of the Permanent Marketing Restrictions.
Disclosure
This document is confidential and may also be privileged. If you are not the intended recipient, please destroy all copies and notify the sender immediately. This document is being distributed for general information only and is subject to the relevant disclaimers available at our Standard Chartered website under Regulatory disclosures. It is not and does not constitute research material, independent research, an offer, recommendation or solicitation to enter into any transaction or adopt any hedging, trading or investment strategy, in relation to any securities or other financial instruments. This document is for general evaluation only. It does not take into account the specific investment objectives, financial situation or particular needs of any particular person or class of persons and it has not been prepared for any particular person or class of persons. You should not rely on any contents of this document in making any investment decisions. Before making any investment, you should carefully read the relevant offering documents and seek independent legal, tax and regulatory advice. In particular, we recommend you to seek advice regarding the suitability of the investment product, taking into account your specific investment objectives, financial situation or particular needs, before you make a commitment to purchase the investment product. Opinions, projections and estimates are solely those of SC at the date of this document and subject to change without notice. Past performance is not indicative of future results and no representation or warranty is made regarding future performance. The value of investments, and the income from them, can go down as well as up, and you may not recover the amount of your original investment. You are not certain to make a profit and may lose money. Any forecast contained herein as to likely future movements in rates or prices or likely future events or occurrences constitutes an opinion only and is not indicative of actual future movements in rates or prices or actual future events or occurrences (as the case may be). This document must not be forwarded or otherwise made available to any other person without the express written consent of the Standard Chartered Group (as defined below). Standard Chartered Bank is incorporated in England with limited liability by Royal Charter 1853 Reference Number ZC18. The Principal Office of the Company is situated in England at 1 Basinghall Avenue, London, EC2V 5DD. Standard Chartered Bank is authorised by the Prudential Regulation Authority and regulated by the Financial Conduct Authority and Prudential Regulation Authority. Standard Chartered PLC, the ultimate parent company of Standard Chartered Bank, together with its subsidiaries and affiliates (including each branch or representative office), form the Standard Chartered Group. Standard Chartered Private Bank is the private banking division of Standard Chartered. Private banking activities may be carried out internationally by different legal entities and affiliates within the Standard Chartered Group (each an “SC Group Entity”) according to local regulatory requirements. Not all products and services are provided by all branches, subsidiaries and affiliates within the Standard Chartered Group. Some of the SC Group Entities only act as representatives of Standard Chartered Private Bank and may not be able to offer products and services or offer advice to clients.
Copyright © 2026, Accounting Research & Analytics, LLC d/b/a CFRA (and its affiliates, as applicable). Reproduction of content provided by CFRA in any form is prohibited except with the prior written permission of CFRA. CFRA content is not investment advice and a reference to or observation concerning a security or investment provided in the CFRA SERVICES is not a recommendation to buy, sell or hold such investment or security or make any other investment decisions. The CFRA content contains opinions of CFRA based upon publicly-available information that CFRA believes to be reliable and the opinions are subject to change without notice. This analysis has not been submitted to, nor received approval from, the United States Securities and Exchange Commission or any other regulatory body. While CFRA exercised due care in compiling this analysis, CFRA, ITS THIRD-PARTY SUPPLIERS, AND ALL RELATED ENTITIES SPECIFICALLY DISCLAIM ALL WARRANTIES, EXPRESS OR IMPLIED, INCLUDING, BUT NOT LIMITED TO, ANY WARRANTIES OF MERCHANTABILITY OR FITNESS FOR A PARTICULAR PURPOSE OR USE, to the full extent permitted by law, regarding the accuracy, completeness, or usefulness of this information and assumes no liability with respect to the consequences of relying on this information for investment or other purposes. No content provided by CFRA (including ratings, credit-related analyses and data, valuations, model, software or other application or output therefrom) or any part thereof may be modified, reverse engineered, reproduced or distributed in any form by any means, or stored in a database or retrieval system, without the prior written permission of CFRA, and such content shall not be used for any unlawful or unauthorized purposes. CFRA and any third-party providers, as well as their directors, officers, shareholders, employees or agents do not guarantee the accuracy, completeness, timeliness or availability of such content. In no event shall CFRA, its affiliates, or their third-party suppliers be liable for any direct, indirect, special, or consequential damages, costs, expenses, legal fees, or losses (including lost income or lost profit and opportunity costs) in connection with a subscriber’s, subscriber’s customer’s, or other’s use of CFRA’s content.
Market Abuse Regulation (MAR) Disclaimer
Banking activities may be carried out internationally by different branches, subsidiaries and affiliates within the Standard Chartered Group according to local regulatory requirements. Opinions may contain outright “buy”, “sell”, “hold” or other opinions. The time horizon of this opinion is dependent on prevailing market conditions and there is no planned frequency for updates to the opinion. This opinion is not independent of Standard Chartered Group’s trading strategies or positions. Standard Chartered Group and/or its affiliates or its respective officers, directors, employee benefit programmes or employees, including persons involved in the preparation or issuance of this document may at any time, to the extent permitted by applicable law and/or regulation, be long or short any securities or financial instruments referred to in this document or have material interest in any such securities or related investments. Therefore, it is possible, and you should assume, that Standard Chartered Group has a material interest in one or more of the financial instruments mentioned herein. Please refer to our Standard Chartered website under Regulatory disclosures for more detailed disclosures, including past opinions/ recommendations in the last 12 months and conflict of interests, as well as disclaimers. A covering strategist may have a financial interest in the debt or equity securities of this company/issuer. All covering strategist are licensed to provide investment recommendations under Monetary Authority of Singapore or Hong Kong Monetary Authority. This document must not be forwarded or otherwise made available to any other person without the express written consent of Standard Chartered Group.
Sustainable Investments
Any ESG data used or referred to has been provided by Morningstar, Sustainalytics, MSCI or Bloomberg. Refer to 1) Morningstar website under Sustainable Investing, 2) Sustainalytics website under ESG Risk Ratings, 3) MCSI website under ESG Business Involvement Screening Research and 4) Bloomberg green, social & sustainability bonds guide for more information. The ESG data is as at the date of publication based on data provided, is for informational purpose only and is not warranted to be complete, timely, accurate or suitable for a particular purpose, and it may be subject to change. Sustainable Investments (SI): This refers to funds that have been classified as ‘ESG Intentional Investments – Overall’ by Morningstar. SI funds have explicitly stated in their prospectus and regulatory filings that they either incorporate ESG factors into the investment process or have a thematic focus on the environment, gender diversity, low carbon, renewable energy, water or community development. For equity, it refers to shares/stocks issued by companies with Sustainalytics ESG Risk Rating of Low/Negligible. For bonds, it refers to debt instruments issued by issuers with Sustainalytics ESG Risk Rating of Low/Negligible, and/or those being certified green, social, sustainable bonds by Bloomberg. For structured products, it refers to products that are issued by any issuer who has a Sustainable Finance framework that aligns with Standard Chartered’s Green and Sustainable Product Framework, with underlying assets that are part of the Sustainable Investment universe or separately approved by Standard Chartered’s Sustainable Finance Governance Committee. Sustainalytics ESG risk ratings shown are factual and are not an indicator that the product is classified or marketed as “green”, “sustainable” or similar under any particular classification system or framework.
Country/Market Specific Disclosures
Bahrain: This document is being distributed in Bahrain by Standard Chartered Bank, Bahrain Branch, having its address at P.O. 29, Manama, Kingdom of Bahrain, is a branch of Standard Chartered Bank and is licensed by the Central Bank of Bahrain as a conventional retail bank. Botswana: This document is being distributed in Botswana by, and is attributable to, Standard Chartered Bank Botswana Limited which is a financial institution licensed under the Section 6 of the Banking Act CAP 46.04 and is listed in the Botswana Stock Exchange. Brunei Darussalam: This document is being distributed in Brunei Darussalam by, and is attributable to, Standard Chartered Bank (Brunei Branch) | Registration Number RFC/61 and Standard Chartered Securities (B) Sdn Bhd | Registration Number RC20001003. Standard Chartered Bank is incorporated in England with limited liability by Royal Charter 1853 Reference Number ZC18. Standard Chartered Securities (B) Sdn Bhd is a limited liability company registered with the Registry of Companies with Registration Number RC20001003 and licensed by Brunei Darussalam Central Bank as a Capital Markets Service License Holder with License Number BDCB/R/CMU/S3-CL and it is authorised to conduct Islamic investment business through an Islamic window. China Mainland: This document is being distributed in China by, and is attributable to, Standard Chartered Bank (China) Limited which is mainly regulated by National Financial Regulatory Administration (NFRA), State Administration of Foreign Exchange (SAFE), and People’s Bank of China (PBOC). Hong Kong: In Hong Kong, this document, except for any portion advising on or facilitating any decision on futures contracts trading, is distributed by Standard Chartered Bank (Hong Kong) Limited (“SCBHK”), a subsidiary of Standard Chartered PLC. SCBHK has its registered address at 32/F, Standard Chartered Bank Building, 4-4A Des Voeux Road Central, Hong Kong and is regulated by the Hong Kong Monetary Authority and registered with the Securities and Futures Commission (“SFC”) to carry on Type 1 (dealing in securities), Type 4 (advising on securities), Type 6 (advising on corporate finance) and Type 9 (asset management) regulated activity under the Securities and Futures Ordinance (Cap. 571) (“SFO”) (CE No. AJI614). The contents of this document have not been reviewed by any regulatory authority in Hong Kong and you are advised to exercise caution in relation to any offer set out herein. If you are in doubt about any of the contents of this document, you should obtain independent professional advice. Any product named herein may not be offered or sold in Hong Kong by means of any document at any time other than to “professional investors” as defined in the SFO and any rules made under that ordinance. In addition, this document may not be issued or possessed for the purposes of issue, whether in Hong Kong or elsewhere, and any interests may not be disposed of, to any person unless such person is outside Hong Kong or is a “professional investor” as defined in the SFO and any rules made under that ordinance, or as otherwise may be permitted by that ordinance. In Hong Kong, Standard Chartered Private Bank is the private banking division of SCBHK, a subsidiary of Standard Chartered PLC. Ghana: Standard Chartered Bank Ghana Limited accepts no liability and will not be liable for any loss or damage arising directly or indirectly (including special, incidental or consequential loss or damage) from your use of these documents. Past performance is not indicative of future results and no representation or warranty is made regarding future performance. You should seek advice from a financial adviser on the suitability of an investment for you, taking into account these factors before making a commitment to invest in an investment. To unsubscribe from receiving further updates, please send an email to feedback.ghana@sc.com. Please do not reply to this email. Call our Priority Banking on 0302610750 for any questions or service queries. You are advised not to send any confidential and/or important information to Standard Chartered via e-mail, as Standard Chartered makes no representations or warranties as to the security or accuracy of any information transmitted via e-mail. Standard Chartered shall not be responsible for any loss or damage suffered by you arising from your decision to use e-mail to communicate with the Bank. India: This document is being distributed in India by Standard Chartered in its capacity as a distributor of mutual funds and referrer of any other third party financial products. Standard Chartered does not offer any ‘Investment Advice’ as defined in the Securities and Exchange Board of India (Investment Advisers) Regulations, 2013 or otherwise. Services/products related securities business offered by Standard Charted are not intended for any person, who is a resident of any jurisdiction, the laws of which imposes prohibition on soliciting the securities business in that jurisdiction without going through the registration requirements and/or prohibit the use of any information contained in this document. Indonesia: This document is being distributed in Indonesia by Standard Chartered Bank, Indonesia branch, which is a financial institution licensed and supervised by Otoritas Jasa Keuangan (Financial Service Authority) and Bank Indonesia. Jersey: In Jersey, Standard Chartered Private Bank is the Registered Business Name of the Jersey Branch of Standard Chartered Bank. The Jersey Branch of Standard Chartered Bank is regulated by the Jersey Financial Services Commission. Copies of the latest audited accounts of Standard Chartered Bank are available from its principal place of business in Jersey: PO Box 80, 15 Castle Street, St Helier, Jersey JE4 8PT. Standard Chartered Bank is incorporated in England with limited liability by Royal Charter in 1853 Reference Number ZC 18. The Principal Office of the Company is situated in England at 1 Basinghall Avenue, London, EC2V 5DD. Standard Chartered Bank is authorised by the Prudential Regulation Authority and regulated by the Financial Conduct Authority and Prudential Regulation Authority. The Jersey Branch of Standard Chartered Bank is also an authorised financial services provider under license number 44946 issued by the Financial Sector Conduct Authority of the Republic of South Africa. Jersey is not part of the United Kingdom and all business transacted with Standard Chartered Bank, Jersey Branch and other SC Group Entity outside of the United Kingdom, are not subject to some or any of the investor protection and compensation schemes available under United Kingdom law. Kenya: This document is being distributed in Kenya by and is attributable to Standard Chartered Bank Kenya Limited. Investment Products and Services are distributed by Standard Chartered Investment Services Limited, a wholly owned subsidiary of Standard Chartered Bank Kenya Limited that is licensed by the Capital Markets Authority in Kenya, as a Fund Manager. Standard Chartered Bank Kenya Limited is regulated by the Central Bank of Kenya. Malaysia: This document is being distributed in Malaysia by Standard Chartered Bank Malaysia Berhad (“SCBMB”). Recipients in Malaysia should contact SCBMB in relation to any matters arising from, or in connection with, this document. This document has not been reviewed by the Securities Commission Malaysia. The product lodgement, registration, submission or approval by the Securities Commission of Malaysia does not amount to nor indicate recommendation or endorsement of the product, service or promotional activity. Investment products are not deposits and are not obligations of, not guaranteed by, and not protected by SCBMB or any of the affiliates or subsidiaries, or by Perbadanan Insurans Deposit Malaysia, any government or insurance agency. Investment products are subject to investment risks, including the possible loss of the principal amount invested. SCBMB expressly disclaim any liability and responsibility for any loss arising directly or indirectly (including special, incidental or consequential loss or damage) arising from the financial losses of the Investment Products due to market condition. Nigeria: This document is being distributed in Nigeria by Standard Chartered Bank Nigeria Limited (SCB Nigeria), a bank duly licensed and regulated by the Central Bank of Nigeria. SCB Nigeria accepts no liability for any loss or damage arising directly or indirectly (including special, incidental or consequential loss or damage) from your use of these documents. You should seek advice from a financial adviser on the suitability of an investment for you, taking into account these factors before making a commitment to invest in an investment. To unsubscribe from receiving further updates, please send an email to clientcare.ng@sc.com requesting to be removed from our mailing list. Please do not reply to this email. Call our Priority Banking on 02 012772514 for any questions or service queries. SCB Nigeria shall not be responsible for any loss or damage arising from your decision to send confidential and/or important information to Standard Chartered via e-mail. SCB Nigeria makes no representations or warranties as to the security or accuracy of any information transmitted via e-mail. Pakistan: This document is being distributed in Pakistan by, and attributable to Standard Chartered Bank (Pakistan) Limited having its registered office at PO Box 5556, I.I Chundrigar Road Karachi, which is a banking company registered with State Bank of Pakistan under Banking Companies Ordinance 1962 and is also having licensed issued by Securities & Exchange Commission of Pakistan for Security Advisors. Standard Chartered Bank (Pakistan) Limited acts as a distributor of mutual funds and referrer of other third-party financial products. Singapore: This document is being distributed in Singapore by, and is attributable to, Standard Chartered Bank (Singapore) Limited (Registration No. 201224747C/ GST Group Registration No. MR-8500053-0, “SCBSL”). Recipients in Singapore should contact SCBSL in relation to any matters arising from, or in connection with, this document. SCBSL is an indirect wholly owned subsidiary of Standard Chartered Bank and is licensed to conduct banking business in Singapore under the Singapore Banking Act, 1970. Standard Chartered Private Bank is the private banking division of SCBSL. IN RELATION TO ANY SECURITY OR SECURITIES-BASED DERIVATIVES CONTRACT REFERRED TO IN THIS DOCUMENT, THIS DOCUMENT, TOGETHER WITH THE ISSUER DOCUMENTATION, SHALL BE DEEMED AN INFORMATION MEMORANDUM (AS DEFINED IN SECTION 275 OF THE SECURITIES AND FUTURES ACT, 2001 (“SFA”)). THIS DOCUMENT IS INTENDED FOR DISTRIBUTION TO ACCREDITED INVESTORS, AS DEFINED IN SECTION 4A(1)(a) OF THE SFA, OR ON THE BASIS THAT THE SECURITY OR SECURITIES-BASED DERIVATIVES CONTRACT MAY ONLY BE ACQUIRED AT A CONSIDERATION OF NOT LESS THAN S$200,000 (OR ITS EQUIVALENT IN A FOREIGN CURRENCY) FOR EACH TRANSACTION. Further, in relation to any security or securities-based derivatives contract, neither this document nor the Issuer Documentation has been registered as a prospectus with the Monetary Authority of Singapore under the SFA. Accordingly, this document and any other document or material in connection with the offer or sale, or invitation for subscription or purchase, of the product may not be circulated or distributed, nor may the product be offered or sold, or be made the subject of an invitation for subscription or purchase, whether directly or indirectly, to persons other than a relevant person pursuant to section 275(1) of the SFA, or any person pursuant to section 275(1A) of the SFA, and in accordance with the conditions specified in section 275 of the SFA, or pursuant to, and in accordance with the conditions of, any other applicable provision of the SFA. In relation to any collective investment schemes referred to in this document, this document is for general information purposes only and is not an offering document or prospectus (as defined in the SFA). This document is not, nor is it intended to be (i) an offer or solicitation of an offer to buy or sell any capital markets product; or (ii) an advertisement of an offer or intended offer of any capital markets product. Deposit Insurance Scheme: Singapore dollar deposits of non-bank depositors are insured by the Singapore Deposit Insurance Corporation, for up to S$100,000 in aggregate per depositor per Scheme member by law. Foreign currency deposits, dual currency investments, structured deposits and other investment products are not insured. This advertisement has not been reviewed by the Monetary Authority of Singapore. Taiwan: SC Group Entity or Standard Chartered Bank (Taiwan) Limited (“SCB (Taiwan)”) may be involved in the financial instruments contained herein or other related financial instruments. The author of this document may have discussed the information contained herein with other employees or agents of SC or SCB (Taiwan). The author and the above-mentioned employees of SC or SCB (Taiwan) may have taken related actions in respect of the information involved (including communication with customers of SC or SCB (Taiwan) as to the information contained herein). The opinions contained in this document may change, or differ from the opinions of employees of SC or SCB (Taiwan). SC and SCB (Taiwan) will not provide any notice of any changes to or differences between the above-mentioned opinions. This document may cover companies with which SC or SCB (Taiwan) seeks to do business at times and issuers of financial instruments. Therefore, investors should understand that the information contained herein may serve as specific purposes as a result of conflict of interests of SC or SCB (Taiwan). SC, SCB (Taiwan), the employees (including those who have discussions with the author) or customers of SC or SCB (Taiwan) may have an interest in the products, related financial instruments or related derivative financial products contained herein; invest in those products at various prices and on different market conditions; have different or conflicting interests in those products. The potential impacts include market makers’ related activities, such as dealing, investment, acting as agents, or performing financial or consulting services in relation to any of the products referred to in this document. UAE: DIFC – Standard Chartered Bank is incorporated in England with limited liability by Royal Charter 1853 Reference Number ZC18.The Principal Office of the Company is situated in England at 1 Basinghall Avenue, London, EC2V 5DD. Standard Chartered Bank is authorised by the Prudential Regulation Authority and regulated by the Financial Conduct Authority and Prudential Regulation Authority. Standard Chartered Bank, Dubai International Financial Centre having its offices at Dubai International Financial Centre, Building 1, Gate Precinct, P.O. Box 999, Dubai, UAE is a branch of Standard Chartered Bank and is regulated by the Dubai Financial Services Authority (“DFSA”). This document is intended for use only by Professional Clients and is not directed at Retail Clients as defined by the DFSA Rulebook. In the DIFC we are authorised to provide financial services only to clients who qualify as Professional Clients and Market Counterparties and not to Retail Clients. As a Professional Client you will not be given the higher retail client protection and compensation rights and if you use your right to be classified as a Retail Client we will be unable to provide financial services and products to you as we do not hold the required license to undertake such activities. For Islamic transactions, we are acting under the supervision of our Shariah Supervisory Committee. Relevant information on our Shariah Supervisory Committee is currently available on the Standard Chartered Bank website in the Islamic banking section. For residents of the UAE – Standard Chartered UAE (“SC UAE”) is licensed by the Central Bank of the U.A.E. SC UAE is licensed by Securities and Commodities Authority to practice Promotion Activity. SC UAE does not provide financial analysis or consultation services in or into the UAE within the meaning of UAE Securities and Commodities Authority Decision No. 48/r of 2008 concerning financial consultation and financial analysis. Uganda: Our Investment products and services are distributed by Standard Chartered Bank Uganda Limited, which is licensed by the Capital Markets Authority as an investment adviser. United Kingdom: In the UK, Standard Chartered Bank is authorised by the Prudential Regulation Authority and regulated by the Financial Conduct Authority and Prudential Regulation Authority. This communication has been approved by Standard Chartered Bank for the purposes of Section 21 (2) (b) of the United Kingdom’s Financial Services and Markets Act 2000 (“FSMA”) as amended in 2010 and 2012 only. Standard Chartered Bank (trading as Standard Chartered Private Bank) is also an authorised financial services provider (license number 45747) in terms of the South African Financial Advisory and Intermediary Services Act, 2002. The Materials have not been prepared in accordance with UK legal requirements designed to promote the independence of investment research, and that it is not subject to any prohibition on dealing ahead of the dissemination of investment research. Vietnam: This document is being distributed in Vietnam by, and is attributable to, Standard Chartered Bank (Vietnam) Limited which is mainly regulated by State Bank of Vietnam (SBV). Recipients in Vietnam should contact Standard Chartered Bank (Vietnam) Limited for any queries regarding any content of this document. Zambia: This document is distributed by Standard Chartered Bank Zambia Plc, a company incorporated in Zambia and registered as a commercial bank and licensed by the Bank of Zambia under the Banking and Financial Services Act Chapter 387 of the Laws of Zambia.