26 September 2025
Global Market Outlook
Global Market Outlook
The equities melt-up
We expect the US economy to achieve a soft landing, supported by Fed rate cuts. This, together with policy easing in most major economies, supports our positive earnings growth outlook. We favour global equities and gold over bonds and cash.
We raise US equities to Overweight and remain Overweight Asia ex-Japan. We expect US equities to be supported by resilient earnings growth and Fed rate cuts, while Asia ex-Japan should benefit from earnings growth and a weak USD.
Overweight EM local currency bonds. Add to gold. We see value in adding non-USD bonds, especially in EMs where rate cuts offer additional support. We add to our gold allocation as diversification demand increases.
Irrational exuberance like it’s 1996 or 2000?
What are the drivers of your soft-landing view?
Are your quant models still positive on risk assets?
Strategy
Investment strategy and key themes
|
|
||||
|

12m Foundation Overweights:
- Global equities, gold
- US, Asia ex-Japan equities
- Emerging Market (EM) local currency bonds
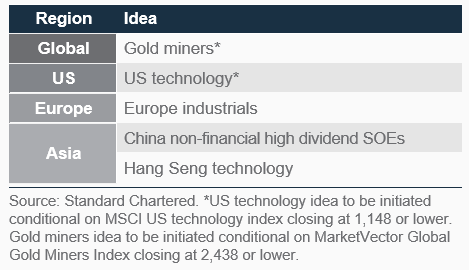
Opportunistic ideas – Equities
- Global Gold Miners^
- US Technology sector^
- China non-financial high-dividend state-owned entities (SOEs) and Hang Seng Technology index
- Europe industrials
Sector Overweights:
- US: Tech, comms, healthcare
- Europe: Industrials, financials, tech
- China: Comm, tech, discretionary
Opportunistic ideas – Bonds
- UK Gilts (FX-unhedged)
- US Treasury Inflation-Protected Securities (TIPS), US short duration High Yield bonds
The equities melt-up
- We expect the Fed cuts to support a soft landing of the US economy. This, together with policy easing in most major economies, supports our positive earnings growth outlook. We favour global equities and gold over bonds and cash.
- We raise US equities to Overweight and remain Overweight Asia ex-Japan. We expect US equities to be supported by resilient earnings growth and Fed rate cuts, while Asia ex-Japan should benefit from earnings growth and a weak USD.
- Overweight EM local currency bonds. Add to gold. We see value in adding non-USD bonds, especially in EMs where rate cuts offer additional support. We add to our gold allocation as diversification demand increases.
Fed rate cuts to support a soft landing
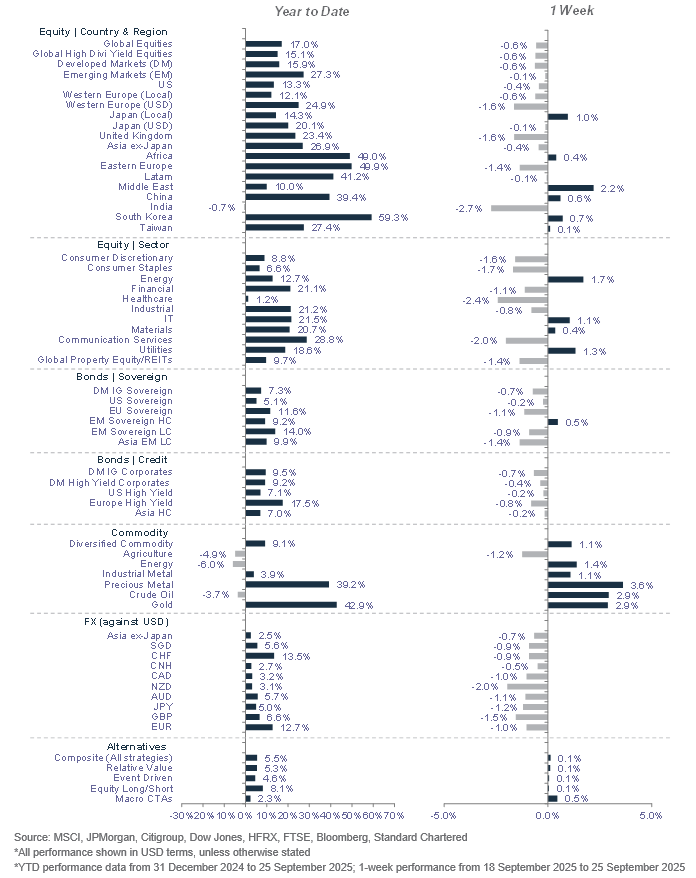
Major asset class performance in Q3 to date paints a picture of optimism laced with caution. Global equities have risen more than 6% even as global bonds struggled to generate positive returns. Gold, however, has delivered double-digit returns. Overall, our balanced allocation is up over 5%, with Asia ex-Japan equities starting to outperform again.
Thus far, the macro and market outcomes have turned out largely along expected lines as laid out in our H2 Outlook. There has been weakness in US economic growth, most so in the job markets, but the Fed has started to cut interest rates. Policy support, together with slow-but-not-recessionary data, strengthens our base case scenario of a soft landing. A recession remains our main risk scenario, but job markets would have to weaken considerably further in the coming months for this to become a greater concern. We expect the Fed to cut rates twice more (25bps each policy meeting) in 2025 and twice further in 2026, bringing policy rates closer to its own estimate of a more neutral level (3%). The continued reduction in US rates means downward pressure on the USD will likely continue.
Policy support remains a common theme in key non-US markets as well. In India, policymakers simplified (and effectively cut) goods and services tax (GST) rates, helping make fiscal policy more stimulatory. In China, the steady pace of targeted support measures continued.
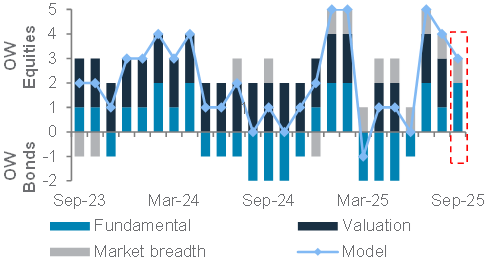
Fig. 1 Our long-term quantitative model is positive on equities over bonds, despite near-term challenges
Our quantitative stock-bond model; currently OW equities
Fundamentals support equities melt-up
We believe recent macro data and policy efforts support staying Overweight global equities relative to bonds and cash.
A soft landing for the US economy and significant policy support outside the US remain key assumptions behind our expectations for continued corporate earnings growth. Pessimists argue that event risk from a looming potential US government shutdown, elevated equity market valuations, weak seasonality (historically in September-October) and increasingly stretched investor positioning are risks. However, while some short-term volatility or consolidation cannot be ruled out, the still-strong fundamental indicators balance out the negative case, in our view, as indicated by our quantitative stock-bond model, which still favours stocks over bonds.
We hold the view that, in this environment, growth equities will outperform high dividend equities.
The regional trade-offs
Within global equities, Asia ex-Japan remains a preferred region. We are Overweight based on our expectation of a weak USD and continued policy support, especially in the larger economies of China and India. Within Asia, we are Overweight China (with a preference for offshore equities), given growth-supportive policies. We have a core holding for Indian equities and expect recent policy stimulus to help corporate earnings growth to bottom out.
We upgrade US equities to Overweight. The market has witnessed resilient earnings momentum following the last earnings season, led by artificial intelligence-related sectors. This, together with a Fed rate cut supporting our soft-landing view, is why we expect the US to outperform global equities over the next 6-12 months, despite our weak USD view.
We balance these with Underweights in UK and Euro area equities. This is by no means a negative view – indeed we expect both regions can still deliver respectable absolute returns – but the bar to outperform Asia ex-Japan or the US appears more formidable. Indeed, this has been the experience since 2 April: European equities have gained more than 10%, but they have lagged US and Asian peers.
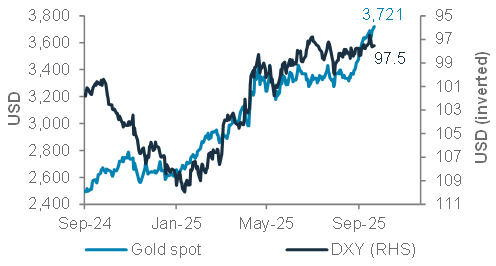
Fig. 2 Gold expected to sustain gains amid central bank reserve diversification demand and a weak USD
Gold price vs. USD index (DXY, inverted)
Adding to Gold allocations
We are adding to our gold allocation. The precious metal has continued to record strong gains since its break above a tight trading range in September. We expect gains to extend, led by a resumption of central bank reserve diversification demand and a weak USD. We expect the gold price to rise to USD 4,100/oz over the next 6-12 months.
Over a shorter horizon, gold also offers an attractive hedge against risks of a rebound in inflation worries, short-term equity volatility or unexpected policy events.
Prefer non-USD bonds
Our forecast for continued USD weakness means we remain Overweight EM local currency bonds. In an environment where downward pressure on the USD persists, we continue to see value in holding a tilt to non-USD bonds. Besides the currency exposure, rate cuts also lend support. As recently witnessed in several EMs, a rising need for policy measures to support growth, relatively muted inflation and reduced downside pressure on currencies in a weak-USD environment mean central banks are likely to continue cutting rates.
We balance this with an Underweight view on US/European High Yield (HY) bonds. While we acknowledge this asset class should remain well supported in our soft-landing scenario, we believe limited scope for further compression in yield premiums over government bonds makes them less attractive relative to equities in a pro-risk scenario.
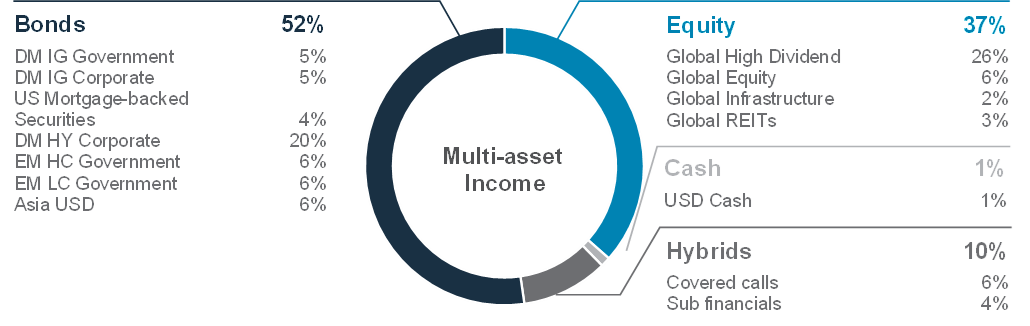
In our multi-asset income portfolio, we maintain positive views on US Mortgage-Backed Securities (MBS) and subordinated financial bonds. The government bond-like credit quality and yield premium over government bonds are leading the performance of MBS bonds. Meanwhile, subordinated financial bond valuations continue to be expensive relative to history and other major bonds. However, we still see them as a pocket of relative value, given broadly elevated valuations across most types of corporate bonds.
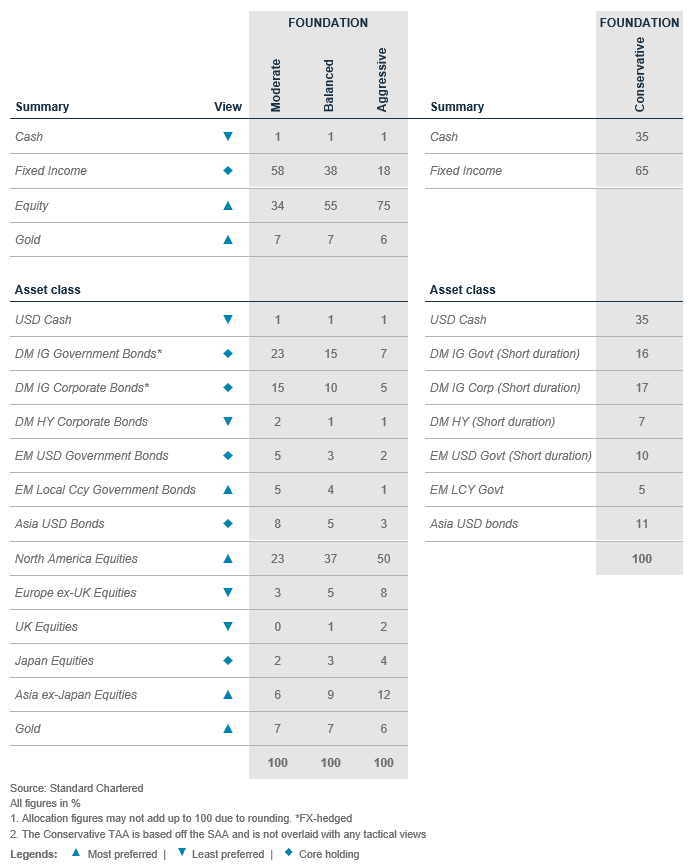
Foundation asset allocation models
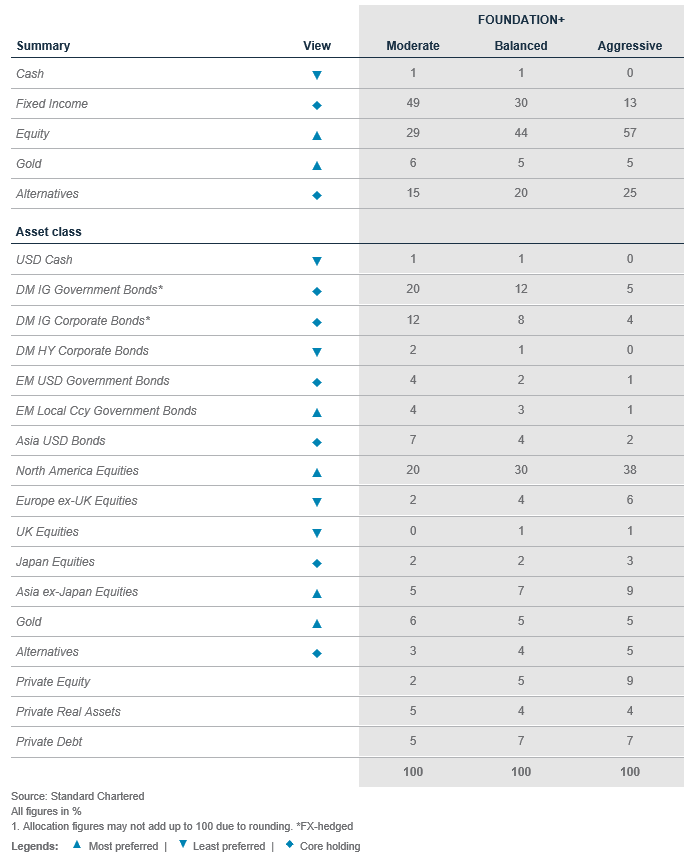
The Foundation and Foundation+ models are allocations that you can use as the starting point for building a diversified investment portfolio. The Foundation model showcases a set of allocations focusing on traditional asset classes that are accessible to most investors, while the Foundation+ model includes allocations to private assets that may be accessible to investors in some jurisdictions, but not others.
Fig. 3 Foundation asset allocation for a balanced risk profile
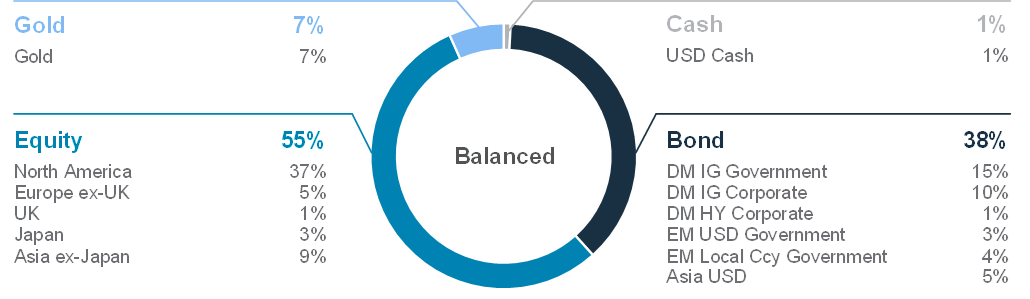
Fig. 4 Foundation+ asset allocation for a balanced risk profile
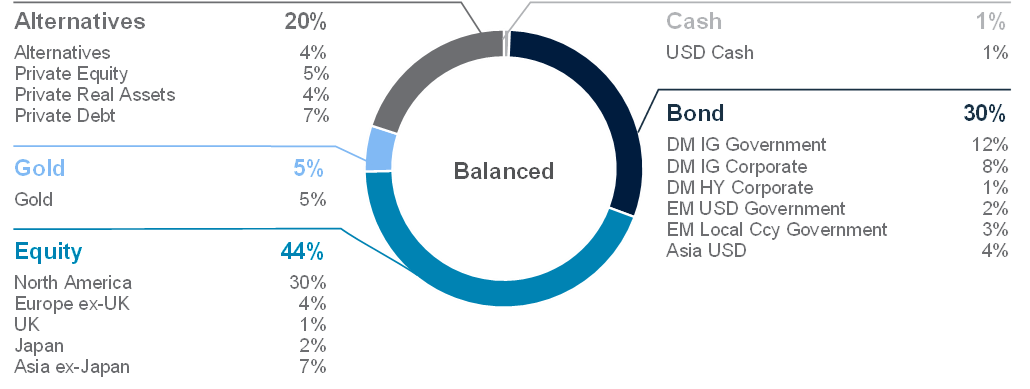
Fig. 5 Multi-asset income allocation for a moderate risk profile
Source: Standard Chartered
Foundation: Our tactical asset allocation views
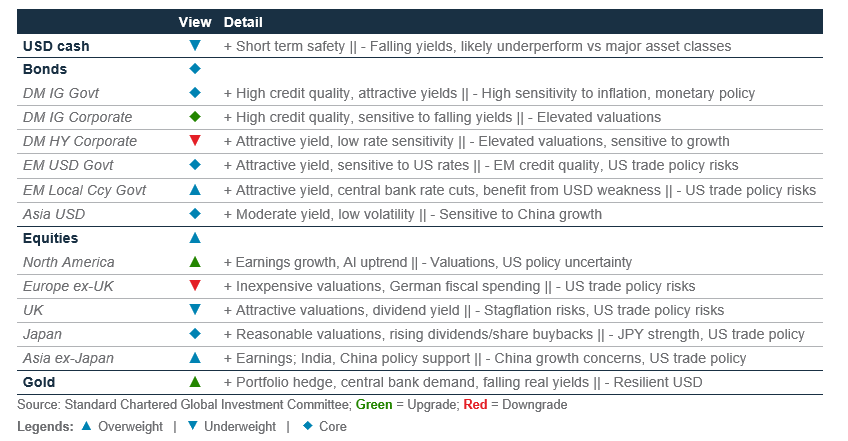
Fig. 6 Performance of our Foundation Allocations*
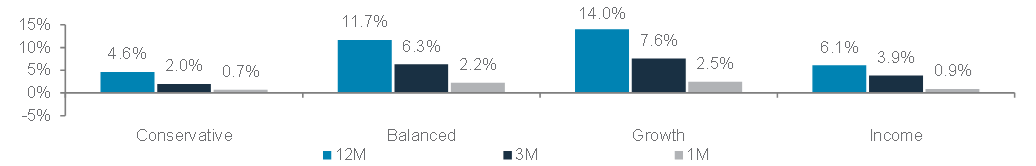
Source: Bloomberg, Standard Chartered; *12-month performance data from 24 September 2024 to 24 September 2025, 3-month performance from 24 June 2025 to 24 September 2025, 1-month performance from 22 August 2025 to 24 September 2025
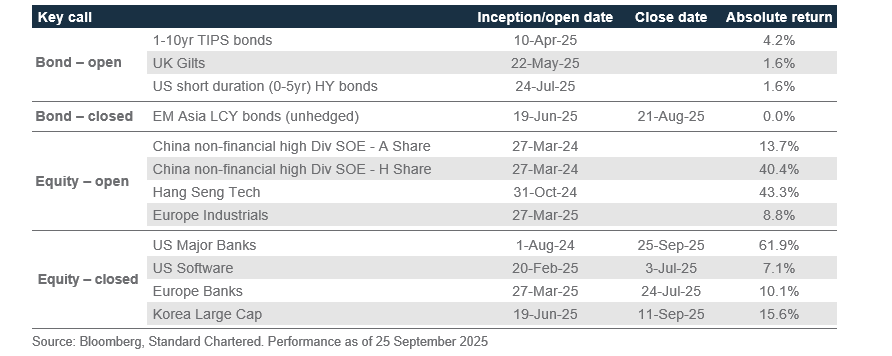
Fig. 7 Opportunistic ideas performance
Perspectives on key client questions
|
|
||||
Irrational exuberance like it’s 1996 or 2000?
Questions over whether markets are in a state of “irrational exuberance” have resurfaced of late. The phrase, first used by then Fed Chair Alan Greenspan in 1996, is remembered as a warning of the dot-com bubble. Back then, it was the power of the internet and its revolutionary impact on businesses that drove valuations to dizzying heights, making people circumspect of chasing the rally. Today, it is artificial intelligence (AI) that is dominating conversations, allowing the S&P500 to stage an impressive 37% rally since the April lows.
Yet, history shows that after Greenspan’s speech, US equities more than doubled, peaking in 2000, before suffering a sharp correction. The lesson is clear: markets can remain buoyant for far longer than expected and attempts to time peaks and troughs can prove costly.
Why markets run too far, then fall too hard
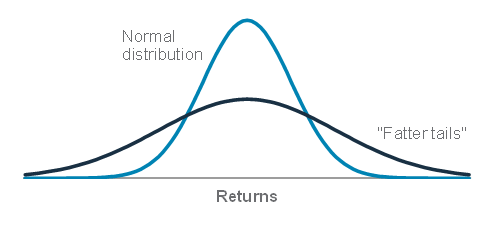
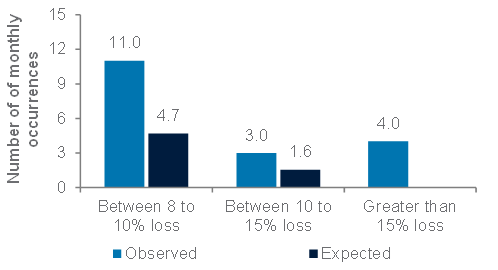
One way to understand why markets can overshoot fundamental anchors is through the lens of “fat tails”. Traditional finance is based on the idea that returns are based on a normal distribution – a neat bell curve where returns are clustered and symmetric around the mean. In practice, however, market returns are more skewed, with a higher probability of extreme moves in both directions. For instance, there have been four occasions since 1900 where monthly losses exceeded 15%. In theory, the probability of this occurring should be close to zero. Yet, outsized losses do occur, highlighting the tendency for markets to confound theory. Equally so, extended rallies, like that in the late 1990s, can go beyond what valuations suggest as returns deviate in terms of scale and how long they last, from what is expected.
Policy, geopolitics and AI reinforce fat-tailed dynamics
We believe the environment today reinforces this fat-tailed dynamic, and the reasons for this are multiple.
First, policy uncertainty is a key factor. In the US, decision-making appears increasingly concentrated and conducted absent of public discourse, resulting in a higher risk of policy surprises. The impact of new policy decisions is

Fig. 8 US stocks currently trade at valuations rivalled only by dot-com era highs
S&P Composite index cyclically adjusted P/E ratio*
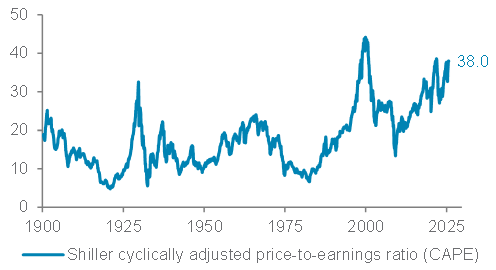
Fig. 9 However, valuations are often a poor indicator of future equity returns
Period-ahead returns when valuations were previously at current levels
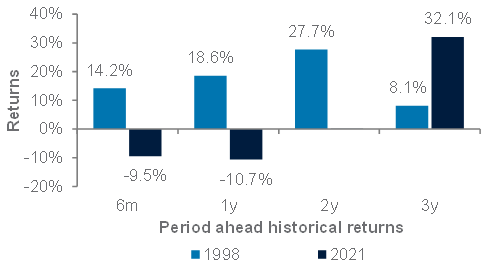
*A measure of S&P Composite index stock valuation defined as price divided by the average of 10 years of earnings, adjusted for inflation. Source: Shiller dataset, Bloomberg, Standard Chartered
also difficult to quantify, due in part to a lack of precedence. For instance, we expect import duties to be inflationary in the US and disinflationary in the rest of the world, but the quantum and length of impact is unclear. This comes at a time when government finances are stretched in much of the western world, adding another level of complexity.
Fig. 10 A fat-tailed distribution shows the tendency for big market swings to occur more often than expected
Illustrative example of a fat-tailed distribution
At the same time, the global geopolitical order is being rewired. The US’s assertive stance risks a gradual erosion of its influence as countries diversify their alliances, with recent engagement between China and India serving as an example of shifting dynamics.
Fig. 11 There have been four occasions since 1900 when US equities saw monthly losses exceeding 15%
Observed vs theoretical outsized monthly market losses
Finally, AI is both a source of optimism and potential disruption. Current narratives emphasise productivity gains, stronger growth and disinflationary benefits. Yet, longer-term risks remain, given the potential for AI to displace jobs. In our view, as long as corporate earnings remain robust, the impact of AI on employment conditions is not expected to be overly damaging. However, should a recession occur, AI could accelerate job losses and amplify the severity of downturns.
- Staying invested matters more than timing the market
Against this backdrop, investors should resist the instinct to retreat from markets. Historical precedent shows that even in
periods of elevated valuations, markets can continue to rise for an extended period. Sitting on the sideline risks missing these gains, particularly if the rally extends substantially from current levels.
Instead, the recommended course of action is to remain invested while using diversification across asset classes and geographies as the first line of defence. In addition, selective use of option strategies to provide downside protection can also be considered.
Fig. 12 Adding lowly correlated streams of returns to the portfolio will improve risk-adjusted returns
Risk-adjusted returns of various portfolios*
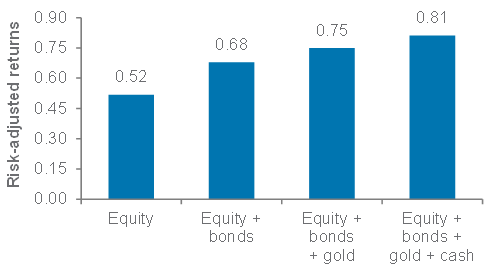
*Based on 20 years of historical data. Equal weighed portfolios. Source: Bloomberg, Standard Chartered
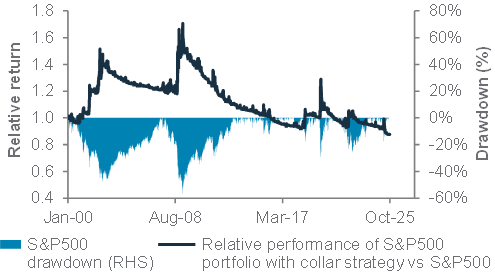
Balancing protection and participation
Downside protection is, however, costly. A premium in implied volatility relative to realised volatility, along with elevated skew, point to expensive put protection that can drag on performance if mistimed. One way to reduce costs and mitigate timing risks is through collar strategies, where call options are sold to help fund put purchases. This cushions portfolios against sharp losses while reducing the costs of outright puts, though it does cap upside potential. In our view, a partial collar overlay of 20-30% offers a sensible balance between cost, protection and equity participation.
Fig. 13 A S&P500 portfolio overlaid with a Collar strategy offers protection while reducing hedging costs
S&P500 with collar strategy and S&P500 drawdowns*
Macro overview – at a glance
Our macroeconomic outlook and key questions
|
Our view
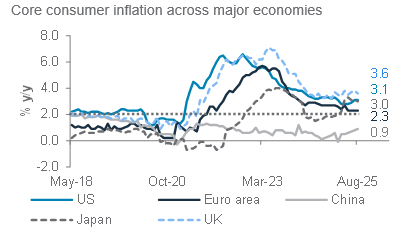
Core scenario (soft landing, 55% probability): The resumption of Fed rate cuts, fiscal easing in the US, Germany and China and monetary easing across EMs sustain the case for an economic soft landing over the next 6-12 months. We expect the Fed to cut rates by another 50bps in 2025 and a total 100bps over the next 12 months to support jobs, as the inflation impact of tariffs appears limited. Trade tensions have eased significantly after the US reached tentative agreements with key partners.
Downside risk (hard landing, 30% probability): We see a 30% chance of a US hard landing/recession in the next 12 months if policy uncertainty worsens consumer and business confidence, causing job losses. A brief US government shutdown is a near-term risk, while a US bond and USD sell-off on concerns about the fiscal deficit or Fed independence are medium-term risks.
Upside risk (no landing, 15% probability): We reduce the probability of a no-landing scenario from 20%, in favour of a hard landing, given residual trade and policy risks. As trade tensions ease, policy stimulus worldwide could revive consumer and business sentiment, leading to a more balanced global economy. A US-China grand bargain could provide further upside.
Key chart
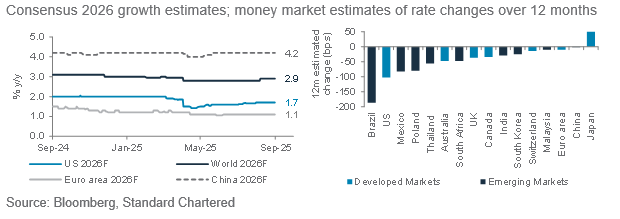
As global trade tensions ease, we expect central bank rate cuts in the US and key EMs and fiscal easing in the US, Germany and China to help the global economy achieve a soft landing.
Fig. 14 Monetary and fiscal policy easing likely to lead to an economic soft landing
Top macro questions
What are the drivers of your US soft-landing view?
Our base case: We expect US economic growth to slow below its 1.8% y/y long-term trend in the coming year, as the highest import tariffs in almost a century and policy uncertainty hurt consumer and business confidence, job creation and real wages. However, the economy is likely to avoid a recession as the impact of tax cuts and corporate investment incentives (from the One Big Beautiful Bill) and the resumption of Fed rate cuts kick in from late-2025. With trade tensions largely contained, the focus will turn to deregulation of banking, energy and other sectors, which, along with fiscal stimulus, a weak USD and lower borrowing costs, should lift consumer and business spending.
Easing trade tensions: After a turbulent H1, the world (except for China, India and Brazil) is coming to terms with a more aggressive US trade policy. Trade tensions have eased significantly after the US reached preliminary deals with major allies, with the EU, Japan and Korea facing 15% tariffs, the UK 10% and key ASEAN partners facing 19-20% tariffs. A US-China deal, after their earlier agreements on semiconductor chips and rare-earths trade, would ease a significant overhang, potentially reviving business investments.
Tax and rate cuts: The budget for the fiscal year starting in October (OBBBA) provides significant tax incentives for business investments, expanded personal tax deductions (besides permanent extension of Trump 1.0 personal tax cuts) and higher estate and gift tax exemptions. We expect these to revive private investment next year once businesses have more clarity on tariffs. We also expect the Fed to cut rates by another 100bps over the next 12 months to 3.25% (just above the Fed’s neutral rate of 3%). Lower borrowing costs should also help revive business and consumer confidence.
Productivity boost? The Atlanta Fed’s GDPNow model shows US growth is accelerating above a 3% annualised rate in Q3, even as job creation has decisively slowed. This dichotomy can be explained either by an acceleration in productivity growth or that the job market is about to catch up with the growth acceleration. The former would be positive, as it would ease inflation concerns, allowing the Fed to keep cutting rates. The latter explanation, against the backdrop of immigration curbs, could be inflationary, slowing rate cuts.
Near-term risks: The immediate risks are a brief government shutdown and the impact of tariffs on growth and inflation. US job creation has slowed to a near-stall speed, with non-healthcare sector jobs contracting. Fed Chair Jerome Powell suggested the job creation rate to keep the overall jobless rate steady could be less than 50,000 (instead of 75,000-100,000 estimated earlier), given immigration curbs reducing labour supply. Nevertheless, the healthcare sector is set to shed jobs amid impending Medicare spending cuts, potentially worsening the outlook. A medium-term risk is the Fed’s independence. President Trump is seeking to control a majority in the Fed’s seven-member governing board and eventually the 12-member Federal Open Market Committee, with an aim to drastically cut rates even as inflation remains well above the Fed’s 2% target. A Trump control of the Fed could potentially upend bond markets and undermine the USD.
Will the ECB cut rates further?
We expect the ECB to cut its deposit rate by 25bps to 1.75% by year-end. Euro area growth is slowing, with forward-looking surveys of growth and investor sentiment (ZEW and Sentix) reversing H1 gains as US tariffs start to bite. While Germany’s fiscal spending plans are likely to lift Euro area growth by 0.3-0.5ppt, they will take effect mainly from next year. Additional defence spending by other Euro area members could provide further support to growth, although fiscal constraints facing major Euro area economies (eg France, Italy) limit the scope of such spending. Given this, we see the ECB delivering one more rate cut before pausing to assess the impact of German fiscal stimulus next year.
Will China ease policy further as economy slows again?
China’s economy is slowing again after a boost in H1 from the impact of a fiscal stimulus (equal to almost 2% of GDP), the front-loading of a consumer goods trade-in programme and an export boost before US tariffs kicked in from Q3. Nevertheless, exports are likely to be more resilient than initially expected, even after the US tariffs, thanks to a planned diversification of supply chains and export markets. The property market downturn continues, feeding deflationary pressures. Unlike previous years, we expect Beijing to fully implement this year’s planned stimulus. The Communist Party’s October plenum to discuss the next five-year plan will be closely watched for signs of further stimulus measures.
Fig. 15 The US job market slowed sharply in Q3
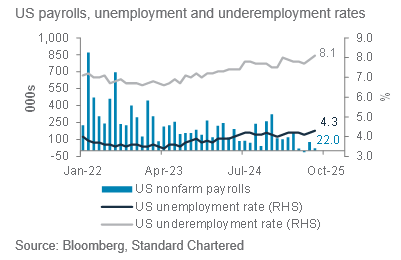
Fig. 16 Above-target US, UK inflation remain key risks
Asset Classes
Bonds – at a glance
|
|
||||
|
Our view
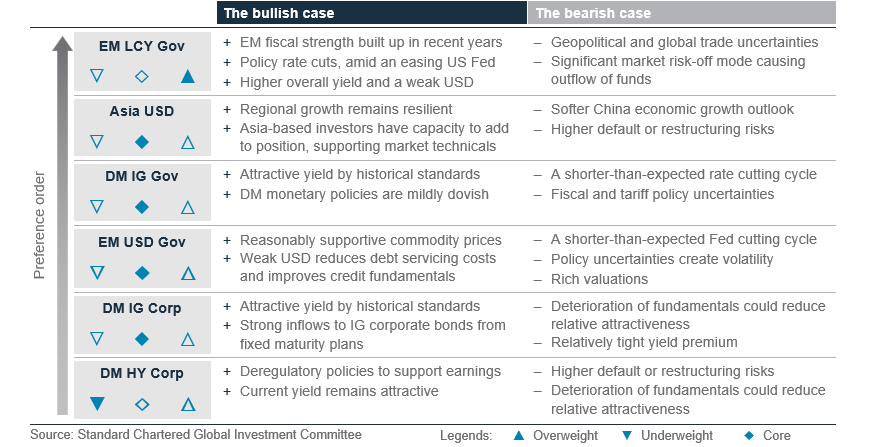
Global bonds remain a core allocation in our foundation portfolios. We expect short-term yields to decline more than long-term yields: our 12-month target for the Fed Funds rate is 3.25%, while we expect the US 10-year government bond yield to range between 3.75% and 4%. Concerns about US fiscal policy, tariffs and Fed independence will keep rates volatility high. However, we would view any jump in long-term yields as transitory and as an opportunity to lock in still-high absolute yields. Bonds with 5-7-year maturities offer the most attractive balance between attractive yields and fiscal and inflation risks. We maintain an Overweight in EM local currency (LCY) government bonds, driven by a benign local inflation and rate cut outlook, improvement in fiscal positions and our expectation of a weak USD. We raise Developed Market Investment Grade (DMIG)corporate bonds to Neutral, while downgrading DM HY bonds to Underweight. Longer-maturity IG bonds should outperform HY peers in our base scenario of short-term yields falling more than long-term yields (a ‘bull steepening’ scenario).
Opportunistic ideas: We remain bullish on UK government bonds (FX-unhedged), US Treasury Inflation-Protected Securities (TIPS) and short-duration US HY bonds.
Key chart
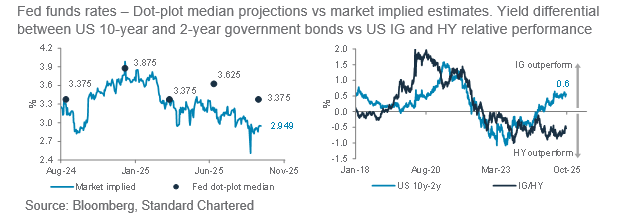
Fed’s median rate cut projection for December 2026 likely too conservative. We expect Fed to cut by more.
Fig. 17 IG bonds usually outperform HY peers when the yield curve bull steepens
Steeper yield curve favours DM IG bonds
We expect the Fed to cut rates by an additional 50bps by the end of 2025 and a total of 100bps over the next 12 months, bringing the Fed funds rates to 3.25% by September 2026. Against this backdrop, we expect the US 10-year government bond to trade in the 4-4.25% range over the next 3 months and 3.75-4% over the next 12 months.
Overall, we expect a steeper yield curve and continued interest rate volatility. The market’s expectation of nearly three Fed rate cuts in 2026 contrasts with the Fed’s projection of just one, but we believe jobs data will allow the Fed to ultimately align closer to the market. IG bonds are more sensitive to rates than HY bonds. As interest rates fall, IG bonds should outperform HY. This prompts our upgrade of DM IG to Neutral and our downgrade of DM HY to Underweight. The Underweight in DM HY also aligns with our preference to take more risk exposure via equities rather than HY bonds, given equities offer more exposure to potential upside in a bullish scenario than bonds at current valuations.
We continue to favour the 5-7-year bond maturity bucket and believe it offers the best balance between exposure to attractive yields and potential price gains from falling yields, while avoiding excessive exposure to inflation or fiscal risks associated with very long maturities.
Overweight EM LCY government bonds
We stay Overweight EM LCY government bonds. In addition to providing high real (net-of-inflation) yields, we view the asset class as well-suited for a risk-on environment in bonds. The resumption of the Fed’s rate cutting cycle provides more flexibility for EM central banks to ease their monetary policies. Our expectation of a weak USD is also supportive. EM LCY government bonds provide diversification benefits, with a low-to-moderate correlation with major DM bonds. However, we acknowledge that EMs remain susceptible to market volatility and geopolitical uncertainty, with weaker US demand and higher tariffs posing risks to these economies.
EM USD government bonds a core holding
Despite recent cheapening, bond yield premiums remain tight. This asset class is sensitive to market volatility and geopolitical uncertainty. However, a weak USD and easing US interest rates should reduce debt servicing costs for EM economies. Additionally, the improvement in fiscal and current account positions in major EM countries mitigates the need for offshore bond issuance.
DM IG government bonds a core holding
Major DM central banks are anticipated to deliver more policy rate cuts (more in the US, less in Europe, though Japan is expected to raise rates). This can support the sub-asset class and help lower short-end yields, while longer-end yields may stay elevated due to fiscal and inflation concerns. Government bonds remain very sensitive to interest rate volatility.
DM IG corporate bonds a core holding
We upgrade DM IG corporate bonds to Neutral (core holding) from an Underweight allocation. Inflows into IG bonds have been robust, particularly in the 5-7-year maturity bucket, as investors are keen to lock in relatively high yields as the Fed restarts rate cuts. The relatively high sensitivity to falling bond yields is expected to contribute positively to returns, but tight yield premiums compared to historical averages will cap performance. This leads us to assign a Neutral allocation to the sub-asset class.
Asia USD bonds a core holding
EM Asia remains vulnerable to US tariff risk. Like other markets, Asia bond valuations are currently high. However, strong external balances, flexible monetary policy and robust refinancing capabilities support rich valuations, in our view. Domestic demand for Asia USD bonds remains strong, as seen in strong allocations within Asia to new bond issuance.
Underweight DM HY corporate bonds
We are Underweight DM HY corporate bonds. Yield premiums are tight and there is wide dispersion within industry sectors, making it increasingly challenging for the sub-asset class to outperform other major bond asset classes.
Opportunistically bullish: Short-duration US HY bonds
We prefer positioning in HY bonds through our opportunistic bullish idea on short-duration US HY bonds. These offer attractive absolute yields with relatively low expected default rates given their short maturities. Historical performance also argues for more attractive risk-adjusted returns than the broader asset class.
Opportunistically bullish: US TIPS
With market inflation expectations still rangebound, we find it attractive to add to inflation-protected bonds (TIPS). TIPS provide protection against upside risks to longer-term inflation amid fiscal concerns, tariff-driven inflation and commodity-driven inflation due to any flare up in geopolitical risks.
Opportunistically bullish: UK government bonds (Gilts, FX-unhedged)
We favour the nominal yield pick-up offered by Gilts over other DM government bonds. UK labour market data continues to weaken, likely leading to weaker wage growth and contributing to disinflationary pressures.
While inflation expectations may remain elevated in the near term, tight financial conditions should keep growth subdued and inflation in check. These factors would likely enable the BoE to cut rates further over the next 6-12 months, especially if the upcoming budget leads to a tighter fiscal policy.
Equity – at a glance
|
|
||||
|
|
||||
Our view
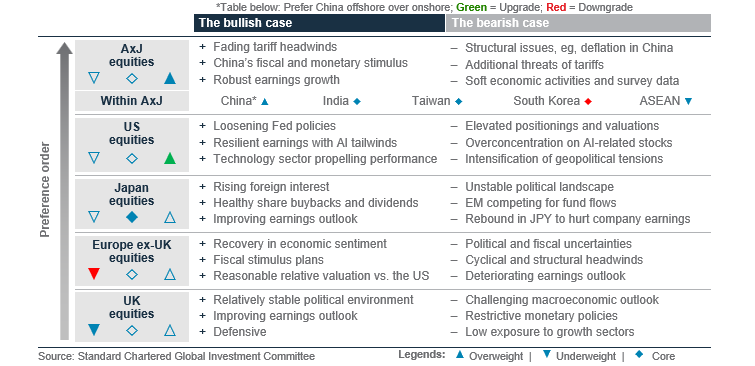
We remain Overweight global equities. We upgrade US equities to Overweight on sustained earnings momentum from AI-related investments and accommodative monetary policy, which can help the US economy glide to a soft landing. Any near-term consolidation, driven by elevated valuations and seasonality, would present attractive opportunities.
We retain an Overweight allocation on Asia ex-Japan (AxJ) equities, given US tariff risk is in the price. We are Overweight China equities within the region, with key catalysts being fiscal support and domestic AI development. Indian equities are a core holding, with the recent simplification in regulations – effectively a goods and services tax cut – lending tailwind to growth.
We have a Neutral allocation to Japan equities, underpinned by continual improvements in corporate governance, though uncertainties arising from the upcoming Liberal Democratic Party leadership election is a near-term risk.
We downgrade Europe ex-UK to an Underweight allocation due to heightened political and fiscal uncertainties. UK equities also remain an Underweight allocation, given the market’s low exposure to growth sectors.
Key chart
US and AxJ equities are buoyed by AI-driven earnings
Fig. 18 US and Asia ex-Japan equities’ 12-month forward earnings growth rates are leading other regions; US equities remain resilient amid a rate cut cycle
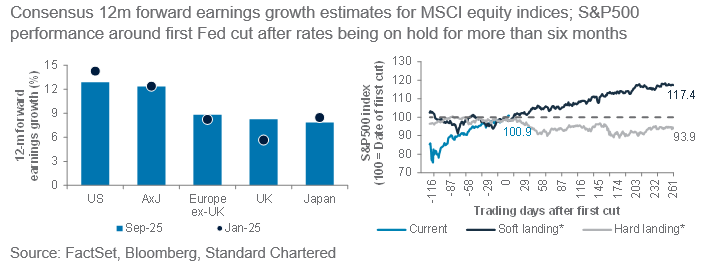
US equities – Overweight
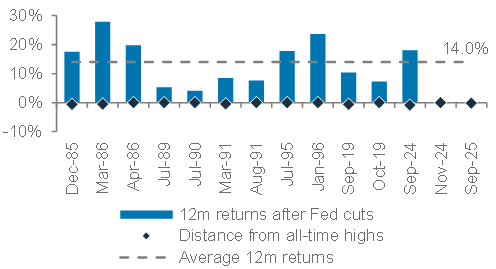
We upgrade US equities to Overweight. While there can be a short-term pullback amid elevated valuations and seasonality, the resilient earnings outlook across growth sector stocks will likely support a continued share price uptrend in the coming 6-12 months. Our expectation of a soft-landing scenario and contained inflation risks suggest room for further Fed cuts to support growth. Despite continued re-rating, we believe the Fed rate cuts lend new impetus for US equities to go higher. There are 12 instances in the last 40 years of the Fed cutting rates when equity markets were within 1% of their all-time high. In all instances, US equities rose over the subsequent 12 months.
Fig. 19 Fed rate cuts near equity market all-time highs have historically resulted in further gains
12-month return in S&P 500, when the Fed cut rates within 1% of stock markets’ all-time high.
Overweight Asia ex-Japan equities
We are Overweight Asia ex-Japan equities. The region gains from strengthening Asian currencies against the USD, which is expected to reduce input costs and boost earnings for domestic corporations. De-escalating trade tensions and still-reasonable valuations are major tailwinds.
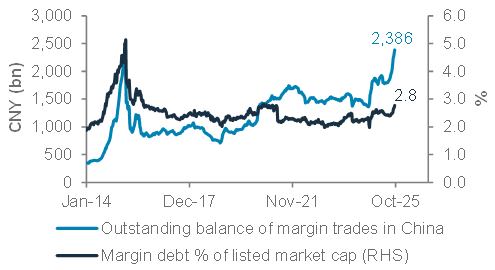
Within Asia, we retain our Overweight China allocation. Despite lacklustre economic figures in August, a potential fiscal stimulus from next month’s Politburo meeting could support earnings growth expectations. The 12m forward EPS growth projection of 11% also outperforms major DMs. Within China, we are Overweight offshore equities relative to onshore peers. Offshore equities have higher weightings in growth sectors, where we see upside potential amid cheaper valuations versus US counterparts. Moreover, there is a possibility of Chinese policymakers adding cooling measures for onshore markets – though we note margin financing, adjusted for market cap, is still not at an alarming level.
We downgrade Korea equities to a core holding. While corporate reform initiatives remain tailwinds, the KOSPI index is up by over 40% year to date (YTD). Valuations are no longer compelling, with MSCI Korea’s 12-month forward P/E trading at 11x, in line with its historical average. Taiwan warrants a core allocation, in our view. There is continued development on AI infrastructure, but overall earnings revisions are negative.
Fig. 20 Outstanding balance of margin trades remains unalarming, after adjusting for listed market capitalisation
Outstanding balance of margin trades on absolute level and as a % of listed market cap in China
We have a core allocation to India. The strong structural story remains, with fiscal measures such as the income and GST tax cuts supportive of corporate profits. The market is less expensive after the consolidation through 2025; in USD terms, the market is down 1% versus Asia ex-Japan’s over 25% return YTD. That said, the 50% US tariff on Indian exports – significantly above Asian peers – illustrate that tariff risks remain in place. We favour mid-cap stocks given they offer robust growth potential at more reasonable valuations.
We are Underweight ASEAN on a weak EPS momentum and currency outlook. The price/earnings-to-growth ratio of 2.6x is also significantly higher than the broader AxJ region’s 1.2x.
Japan equities – Core holding
Japan equities remain a core holding. Corporate governance reforms remain a catalyst, while economic resilience and a reflationary environment should continue to support growth across domestically exposed cyclical sectors. The election for leadership in Japan is a near-term risk. Further BoJ hikes resulting in a stronger JPY could also curtail earnings projections, given Japanese equities’ exposure to foreign earnings.
Europe ex-UK equities – Underweight
We downgrade Europe ex-UK equities to Underweight. We believe it is difficult for the region’s markets to outperform Asia ex-Japan and the US. Economic growth projections remain subdued while trade tariffs and geopolitical tensions continue to lurk in the background. Valuations are elevated, with the 12m forward P/E ratio for the MSCI Europe ex-UK index at around 1 standard deviation above its long-term average.
UK equities – Underweight
We are Underweight UK equities. Its defensive composition is likely to underperform the more growth-oriented regions, such as Asia ex-Japan and the US. Subdued fund inflows and a challenging macro backdrop will likely dampen investor sentiment on a 6-12 month horizon.
Equity opportunistic views
|
Add US technology, gold miners on a pullback
- We would initiate an opportunistic position in the US technology sector after a 5%* pullback. Some indicators of equity market positioning are looking stretched, which could lead to consolidation and entry opportunities. We are positive on the sector as AI spending spurs earnings growth. Mega projects are supporting the semiconductor industry and cloud service providers.
- Similarly, we would initiate an opportunistic position in gold miners after a 5%* pullback. We are positive on gold prices with structural central bank purchases and ETF inflows. Meanwhile, gold miners are enjoying higher profit margins and surging free cash flows, which are being used to fund attractive share buybacks.
- We take profit on US major banks with a gain of 61.9% since 1 August 2024, ahead of potential market volatility as the Fed embarks on a rate cutting cycle, which could impact banks’ interest income.
Fig. 21 Opportunistic ideas
Open bullish ideas
Europe industrials: We continue to see gains with the infrastructure and defence spending catalyst as Europe makes up for years of underinvestment. Germany is leading the charge, while other countries may face more budget constraints. However, we see geopolitical pressures sustaining this multi-year fiscal tailwind that would support the aerospace and defence, electrical equipment, machinery and construction industries, which form the bulk of the industrials sector. A sharp slowdown in Europe’s economy is a risk.
Hang Seng technology: We expect the valuation re-rating to continue as the earnings outlook and operating environment improve heading into next year. Policymakers continue drive AI adoption and technology development, while major technology platforms are investing heavily and seeing some fruits in monetisation and increased efficiency. Adverse regulatory changes are a risk.
Sector views: Staying constructive
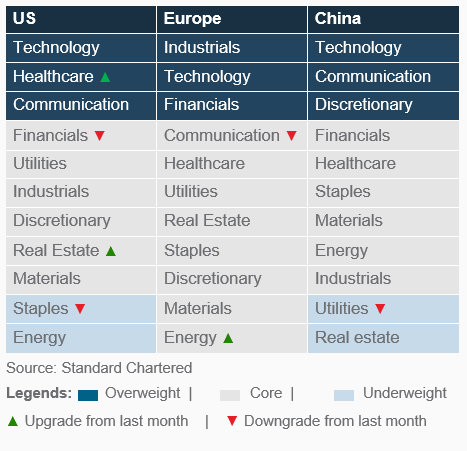
We continue to prefer growth exposure, with an Overweight on technology in the US, Europe and China, supported by AI investments and software development. In the US, we downgrade financials to Neutral, while we upgrade healthcare to Overweight. Healthcare has been the worst-performing US sector this year, but we see signs of stabilisation as the valuation discount appears enticing. We upgrade real estate to Neutral, as lower rates are a tailwind, while we downgrade staples to Underweight as we expect higher costs and tariffs to weigh on profit margins. In Europe, we remain Overweight financials as a value play, and we upgrade energy to Neutral as value is emerging with rising dividend yields. In China, we maintain exposure to improving consumption and AI adoption, with preference for technology, communication and discretionary. Companies in these sectors have strong balance sheets, generate strong cash flows and are investing heavily in AI infrastructure amid strong demand.
Fig. 22 Our sector views by region
FX – at a glance
|
Our view
We expect the USD to remain weak, pushing the USD index (DXY) to 96.5, over the next three months amid growing evidence of a softening labour market. We expect the Fed to cut interest rates by 50bps by year-end, outpacing cuts by other major central banks and narrowing interest rate differentials vs. other major economies to the detriment of the USD. The weighted rate differential has fallen rapidly from the start of the year and is currently below its 5-year average. We also expect the USD to be particularly sensitive to negative US economic surprises.
We expect USD weakness to extend towards 95 over a 6-12-month horizon. US import prices, excluding tariffs, have declined modestly, indicating US importers have largely absorbed most of the additional costs of tariffs. We expect the Fed to deliver a cumulative 100bps cut over the next 12-months, supporting a US soft landing. Meanwhile, the structural drivers of USD strength over the past few years, including US exceptionalism, high real rates and safe-haven flows, are fading. Risks to our view include a renewed surge in inflation, hawkish Fed policy and geopolitical shocks that could reignite USD demand.
Key charts
Fig. 23 USD index (DXY) falling in line with interest rate differentials; we expect this trend to continue
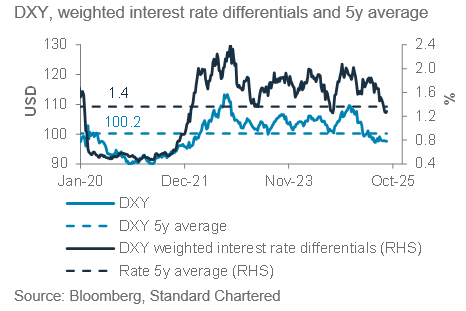
Fig. 25 Currency volatility largely below 5y average
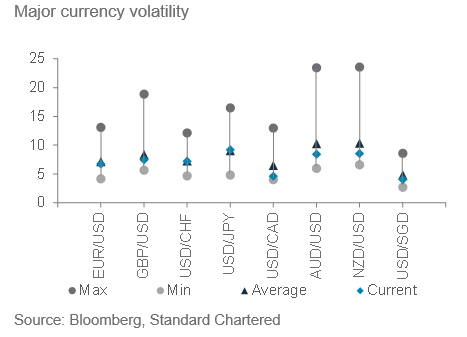
Fig. 24 Fed likely to outpace other central bank in magnitude of rate cuts
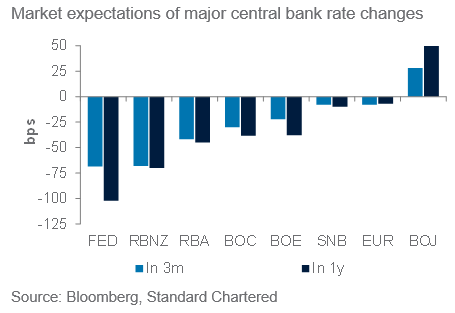
Fig. 26 Rate differentials point to further downside for USD/JPY
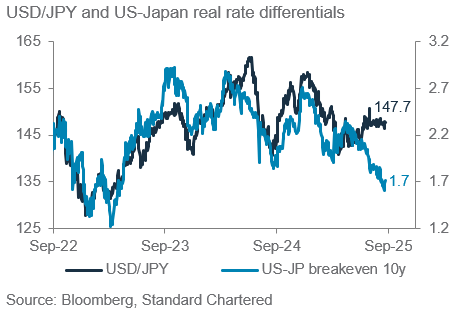
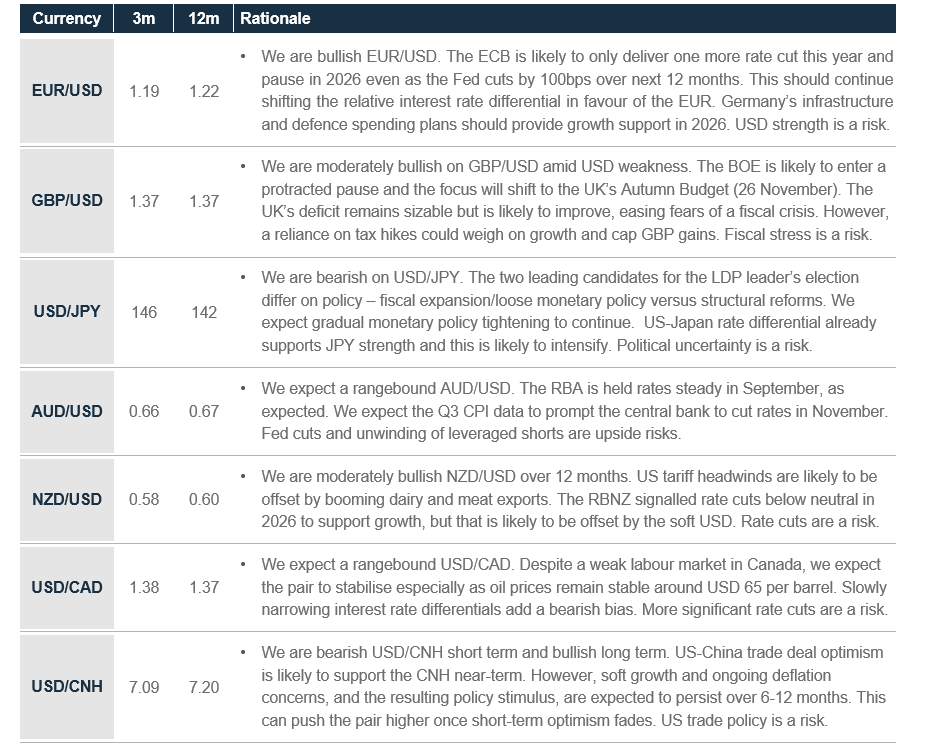
Fig. 27 Summary of currency forecasts and drivers
Gold, crude oil – at a glance
|
|
||||
Our view
We raise our 3- and 12-month gold price targets to USD 3,850/oz and USD 4,100/oz, respectively.
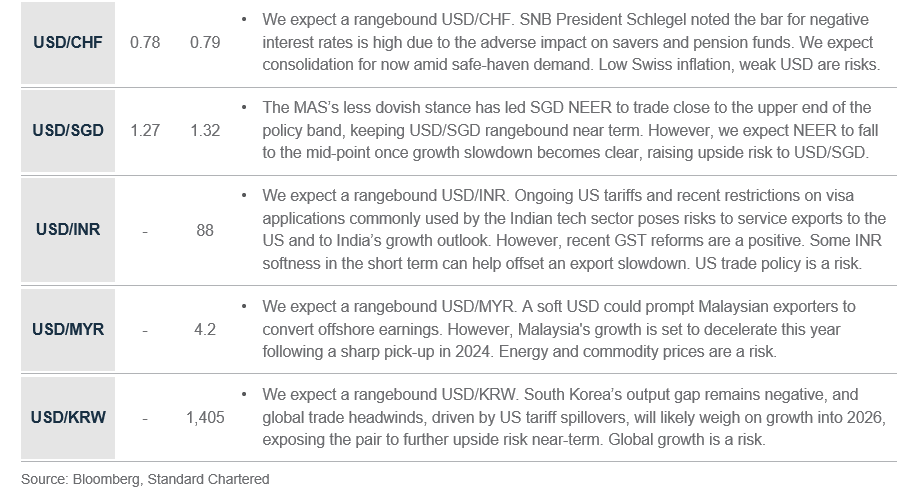
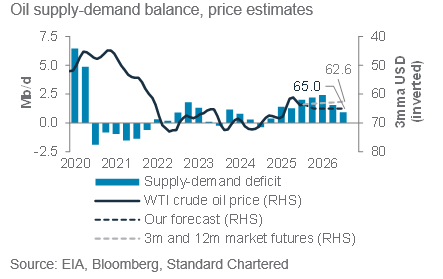
We expect West Texas Intermediate (WTI) oil to remain in a range around USD 65/bbl. We continue to expect excess supply to be the dominant factor. This should cap temporary rebounds in prices due to potential geopolitical risks.
Key chart
Fig. 28 Inflation-adjusted gold prices are now at the highest ever level in modern history
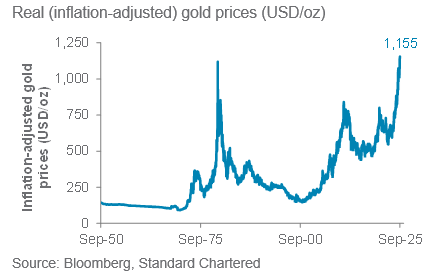
Fig. 30 Fed rate cuts will coincide with seasonal strength in Indian and Chinese jewellery demand
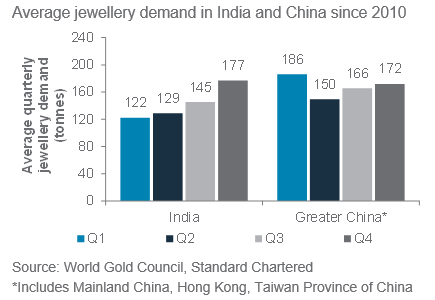
Fig. 29 Historically, the start of the Fed easing cycle supports gold prices
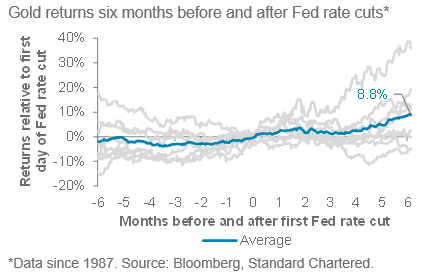
Fig. 31 The oil market is likely to remain in surplus this year, keeping prices in check
Gold outlook: We are optimistic on gold and expect prices to sustain a “higher-for-longer” trajectory. Supporting factors include: 1) the resumption of the Fed rate cuts, 2) seasonal jewellery demand from India and China and 3) a backdrop of US policy and geopolitical concerns. Stretched positioning raises near-term risks, but we expect pullbacks to be met with “buy-on-dip” demand, with prices ultimately surpassing USD 4,000/oz over the next 12 months.
Oil outlook: We continue to expect WTI oil prices to remain rangebound around USD 65/bbl over 6-12 months. Excess supply means short-term spikes (led by geopolitics, for example) are likely to be quickly capped. Sentiment is somewhat bearish, with the emergence of a rising number of forecasts below USD 60.
Additional perspectives
Quant perspective
Bullish equities short term and long term
|
|
||||
Summary
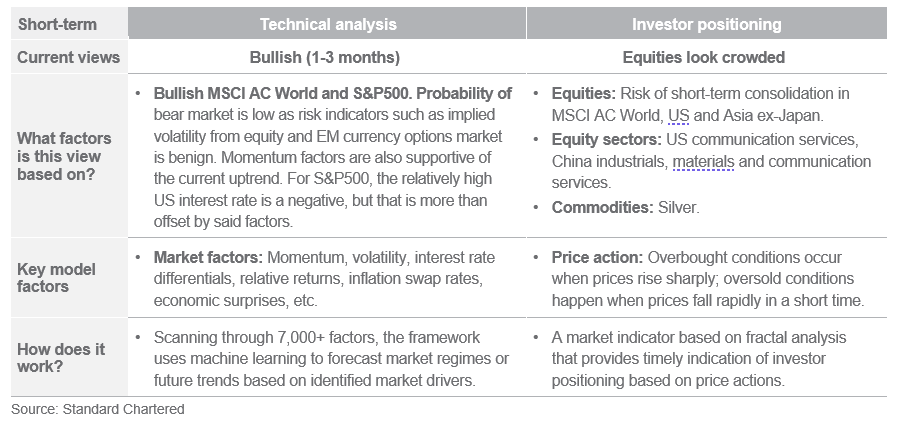
Long-term and short-term indicators are bullish risk assets.
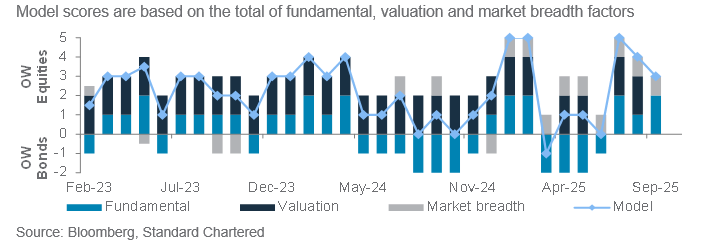
Long term: Our stock-bond model continues to prefer equities over bonds Since its OW view on equities in July outlook, the model has generated an absolute return of 6.4%, outperforming the 60/40 equity by 1.4%. In our latest update, the model has adjusted its Overweight allocation to equities lower, as Developed Market (DM) valuations are starting to look expensive. Fundamental factors remain strongly supportive of equities, with the latest ISM new orders signalling a recovery in economic sentiment. The market breadth factor is also healthy, as there is strong participation by global markets in the current equity rally.
Short term: Our new market model is bullish on S&P500 and MSCI AC World indices as momentum signals are bullish and risk indicators such as implied volatility from equity and EM currency options market remained low. The model, introduced in August, scans through 7,000+ factors to identify long-term drivers of equity-market regimes and forecast these regimes via machine learning algorithms. Since our publication of the model in August, the bullish view on the S&P500 has gained 3.7%, with the latest estimated probability of a bear market remaining low at only 1.1%. The MSCI AC World model is similar, as the estimated probability of a bear market is only 0.8%.
But risk of a short-term consolidation in equities is likely after recent strong gains. Our market diversity indicator shows that investor positioning for global equities looks increasingly stretched. However, deep corrections are unlikely, given the supportive signals from our short-term and long-term quantitative models. US communication services and China materials and communication services are also currently being flagged.
Key chart
Our stock-bond model is Overweight equities, as the model score sits at +3 (out of 5). Fundamental and technical factors are bullish equities.
Fig. 32 Breakdown of our stock-bond rotation model’s scores since inception in Feb-23
Our new market model for the S&P500 is bullish, as equity and EM currency volatilities are low, while momentum dynamics are positive.
Fig. 33 Our technical model turned bullish on the S&P500
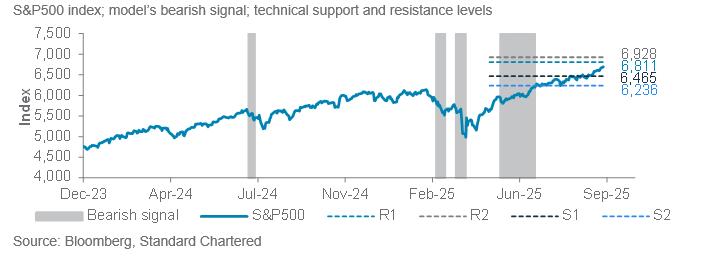
Fig. 34 Long- and short-term quantitative models are bullish risky assets
Long-term models below have a typical time horizon of 3-6 months, while short-term models have a 1-3 month horizon
Performance review
Foundation: Asset allocation summary
Foundation+: Asset allocation summary
Market performance summary
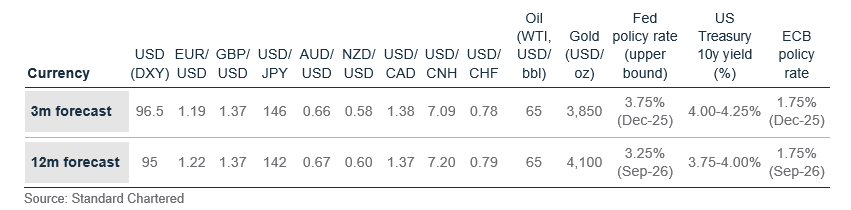
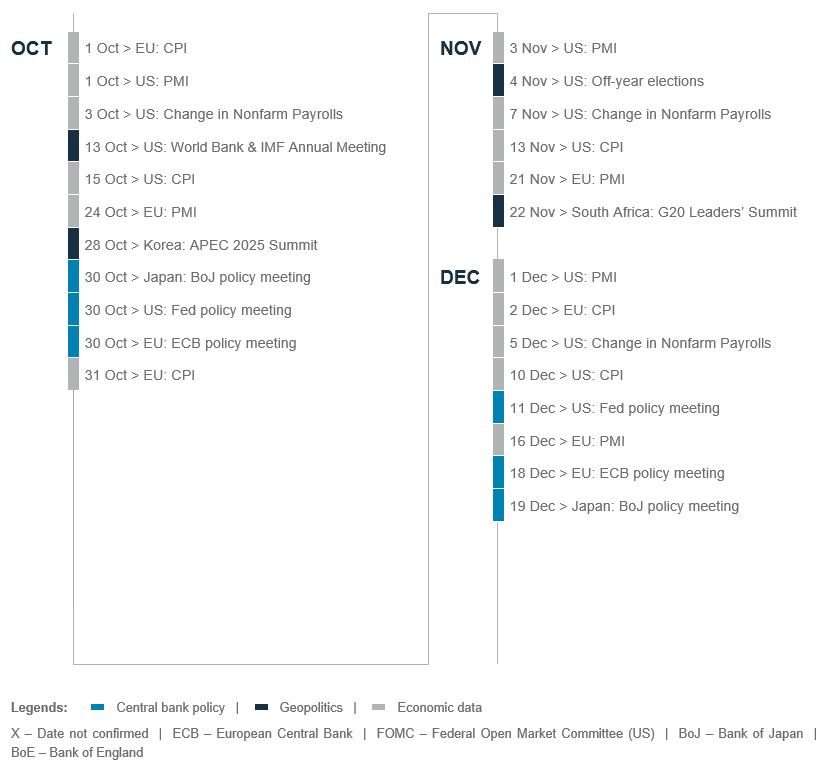
Our key forecasts and calendar events
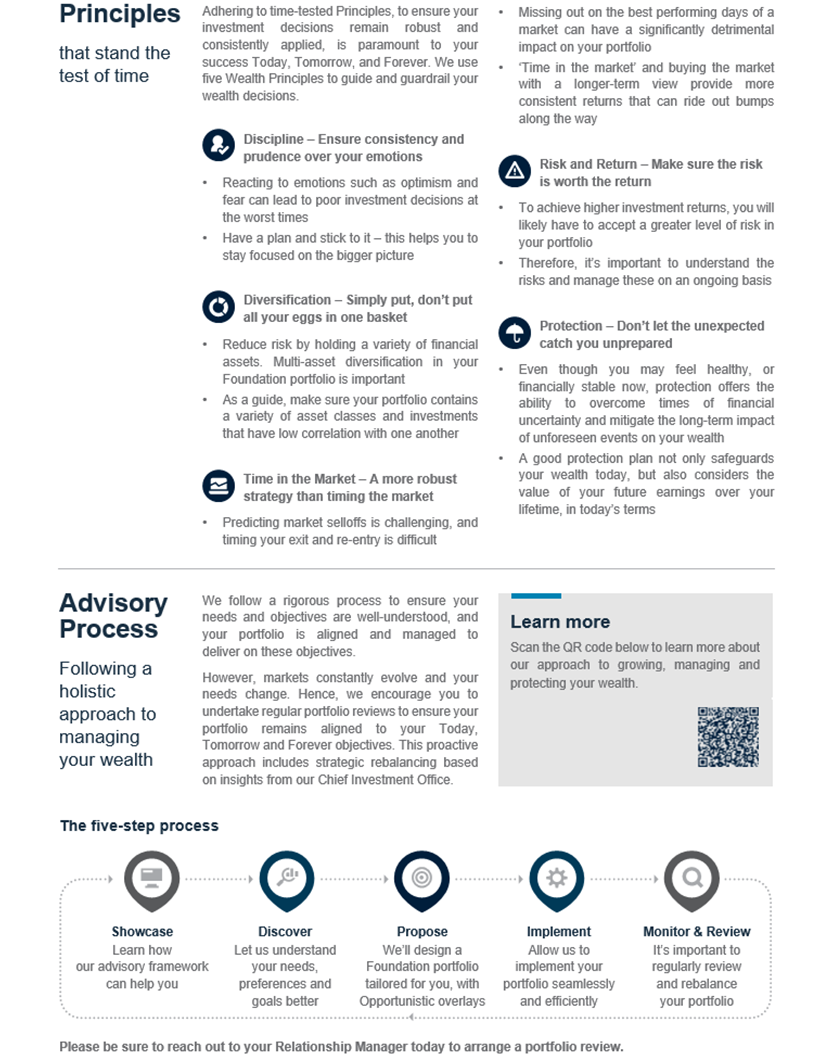
Today, Tomorrow and Forever


Explanatory notes
1. The figures on page 5 show allocations for a moderately aggressive risk profile only – different risk profiles may produce significantly different asset allocation results. Page 5 is only an example, provided for general information only and they do not constitute investment advice, an offer, recommendation or solicitation. They do not take into account the specific investment objectives, needs or risk tolerances of a particular person or class of persons and they have not been prepared for any particular person or class of persons.
2. Contingent Convertibles are complex financial instruments and are not a suitable or appropriate investment for all investors. This document is not an offer to sell or an invitation to buy any securities or any beneficial interests therein. Contingent convertible securities are not intended to be sold and should not be sold to retail clients in the European Economic Area (EEA) (each as defined in the Policy Statement on the Restrictions on the Retail Distribution of Regulatory Capital Instruments (Feedback to CP14/23 and Final Rules) (“Policy Statement”), read together with the Product Intervention (Contingent Convertible Instruments and Mutual Society Shares) Instrument 2015 (“Instrument”, and together with the Policy Statement, the “Permanent Marketing Restrictions”), which were published by the United Kingdom’s Financial Conduct Authority in June 2015), other than in circumstances that do not give rise to a contravention of the Permanent Marketing Restrictions.
Disclosure
This document is confidential and may also be privileged. If you are not the intended recipient, please destroy all copies and notify the sender immediately. This document is being distributed for general information only and is subject to the relevant disclaimers available at our Standard Chartered website under Regulatory disclosures. It is not and does not constitute research material, independent research, an offer, recommendation or solicitation to enter into any transaction or adopt any hedging, trading or investment strategy, in relation to any securities or other financial instruments. This document is for general evaluation only. It does not take into account the specific investment objectives, financial situation or particular needs of any particular person or class of persons and it has not been prepared for any particular person or class of persons. You should not rely on any contents of this document in making any investment decisions. Before making any investment, you should carefully read the relevant offering documents and seek independent legal, tax and regulatory advice. In particular, we recommend you to seek advice regarding the suitability of the investment product, taking into account your specific investment objectives, financial situation or particular needs, before you make a commitment to purchase the investment product. Opinions, projections and estimates are solely those of SC at the date of this document and subject to change without notice. Past performance is not indicative of future results and no representation or warranty is made regarding future performance. The value of investments, and the income from them, can go down as well as up, and you may not recover the amount of your original investment. You are not certain to make a profit and may lose money. Any forecast contained herein as to likely future movements in rates or prices or likely future events or occurrences constitutes an opinion only and is not indicative of actual future movements in rates or prices or actual future events or occurrences (as the case may be). This document must not be forwarded or otherwise made available to any other person without the express written consent of the Standard Chartered Group (as defined below). Standard Chartered Bank is incorporated in England with limited liability by Royal Charter 1853 Reference Number ZC18. The Principal Office of the Company is situated in England at 1 Basinghall Avenue, London, EC2V 5DD. Standard Chartered Bank is authorised by the Prudential Regulation Authority and regulated by the Financial Conduct Authority and Prudential Regulation Authority. Standard Chartered PLC, the ultimate parent company of Standard Chartered Bank, together with its subsidiaries and affiliates (including each branch or representative office), form the Standard Chartered Group. Standard Chartered Private Bank is the private banking division of Standard Chartered. Private banking activities may be carried out internationally by different legal entities and affiliates within the Standard Chartered Group (each an “SC Group Entity”) according to local regulatory requirements. Not all products and services are provided by all branches, subsidiaries and affiliates within the Standard Chartered Group. Some of the SC Group Entities only act as representatives of Standard Chartered Private Bank and may not be able to offer products and services or offer advice to clients.
Copyright © 2025, Accounting Research & Analytics, LLC d/b/a CFRA (and its affiliates, as applicable). Reproduction of content provided by CFRA in any form is prohibited except with the prior written permission of CFRA. CFRA content is not investment advice and a reference to or observation concerning a security or investment provided in the CFRA SERVICES is not a recommendation to buy, sell or hold such investment or security or make any other investment decisions. The CFRA content contains opinions of CFRA based upon publicly-available information that CFRA believes to be reliable and the opinions are subject to change without notice. This analysis has not been submitted to, nor received approval from, the United States Securities and Exchange Commission or any other regulatory body. While CFRA exercised due care in compiling this analysis, CFRA, ITS THIRD-PARTY SUPPLIERS, AND ALL RELATED ENTITIES SPECIFICALLY DISCLAIM ALL WARRANTIES, EXPRESS OR IMPLIED, INCLUDING, BUT NOT LIMITED TO, ANY WARRANTIES OF MERCHANTABILITY OR FITNESS FOR A PARTICULAR PURPOSE OR USE, to the full extent permitted by law, regarding the accuracy, completeness, or usefulness of this information and assumes no liability with respect to the consequences of relying on this information for investment or other purposes. No content provided by CFRA (including ratings, credit-related analyses and data, valuations, model, software or other application or output therefrom) or any part thereof may be modified, reverse engineered, reproduced or distributed in any form by any means, or stored in a database or retrieval system, without the prior written permission of CFRA, and such content shall not be used for any unlawful or unauthorized purposes. CFRA and any third-party providers, as well as their directors, officers, shareholders, employees or agents do not guarantee the accuracy, completeness, timeliness or availability of such content. In no event shall CFRA, its affiliates, or their third-party suppliers be liable for any direct, indirect, special, or consequential damages, costs, expenses, legal fees, or losses (including lost income or lost profit and opportunity costs) in connection with a subscriber’s, subscriber’s customer’s, or other’s use of CFRA’s content.
Market Abuse Regulation (MAR) Disclaimer
Banking activities may be carried out internationally by different branches, subsidiaries and affiliates within the Standard Chartered Group according to local regulatory requirements. Opinions may contain outright “buy”, “sell”, “hold” or other opinions. The time horizon of this opinion is dependent on prevailing market conditions and there is no planned frequency for updates to the opinion. This opinion is not independent of Standard Chartered Group’s trading strategies or positions. Standard Chartered Group and/or its affiliates or its respective officers, directors, employee benefit programmes or employees, including persons involved in the preparation or issuance of this document may at any time, to the extent permitted by applicable law and/or regulation, be long or short any securities or financial instruments referred to in this document or have material interest in any such securities or related investments. Therefore, it is possible, and you should assume, that Standard Chartered Group has a material interest in one or more of the financial instruments mentioned herein. Please refer to our Standard Chartered website under Regulatory disclosures for more detailed disclosures, including past opinions/ recommendations in the last 12 months and conflict of interests, as well as disclaimers. A covering strategist may have a financial interest in the debt or equity securities of this company/issuer. All covering strategist are licensed to provide investment recommendations under Monetary Authority of Singapore or Hong Kong Monetary Authority. This document must not be forwarded or otherwise made available to any other person without the express written consent of Standard Chartered Group.
Sustainable Investments
Any ESG data used or referred to has been provided by Morningstar, Sustainalytics, MSCI or Bloomberg. Refer to 1) Morningstar website under Sustainable Investing, 2) Sustainalytics website under ESG Risk Ratings, 3) MCSI website under ESG Business Involvement Screening Research and 4) Bloomberg green, social & sustainability bonds guide for more information. The ESG data is as at the date of publication based on data provided, is for informational purpose only and is not warranted to be complete, timely, accurate or suitable for a particular purpose, and it may be subject to change. Sustainable Investments (SI): This refers to funds that have been classified as ‘ESG Intentional Investments – Overall’ by Morningstar. SI funds have explicitly stated in their prospectus and regulatory filings that they either incorporate ESG factors into the investment process or have a thematic focus on the environment, gender diversity, low carbon, renewable energy, water or community development. For equity, it refers to shares/stocks issued by companies with Sustainalytics ESG Risk Rating of Low/Negligible. For bonds, it refers to debt instruments issued by issuers with Sustainalytics ESG Risk Rating of Low/Negligible, and/or those being certified green, social, sustainable bonds by Bloomberg. For structured products, it refers to products that are issued by any issuer who has a Sustainable Finance framework that aligns with Standard Chartered’s Green and Sustainable Product Framework, with underlying assets that are part of the Sustainable Investment universe or separately approved by Standard Chartered’s Sustainable Finance Governance Committee. Sustainalytics ESG risk ratings shown are factual and are not an indicator that the product is classified or marketed as “green”, “sustainable” or similar under any particular classification system or framework.
Country/Market Specific Disclosures
Bahrain: This document is being distributed in Bahrain by Standard Chartered Bank, Bahrain Branch, having its address at P.O. 29, Manama, Kingdom of Bahrain, is a branch of Standard Chartered Bank and is licensed by the Central Bank of Bahrain as a conventional retail bank. Botswana: This document is being distributed in Botswana by, and is attributable to, Standard Chartered Bank Botswana Limited which is a financial institution licensed under the Section 6 of the Banking Act CAP 46.04 and is listed in the Botswana Stock Exchange. Brunei Darussalam: This document is being distributed in Brunei Darussalam by, and is attributable to, Standard Chartered Bank (Brunei Branch) | Registration Number RFC/61 and Standard Chartered Securities (B) Sdn Bhd | Registration Number RC20001003. Standard Chartered Bank is incorporated in England with limited liability by Royal Charter 1853 Reference Number ZC18. Standard Chartered Securities (B) Sdn Bhd is a limited liability company registered with the Registry of Companies with Registration Number RC20001003 and licensed by Brunei Darussalam Central Bank as a Capital Markets Service License Holder with License Number BDCB/R/CMU/S3-CL and it is authorised to conduct Islamic investment business through an Islamic window. China Mainland: This document is being distributed in China by, and is attributable to, Standard Chartered Bank (China) Limited which is mainly regulated by National Financial Regulatory Administration (NFRA), State Administration of Foreign Exchange (SAFE), and People’s Bank of China (PBOC). Hong Kong: In Hong Kong, this document, except for any portion advising on or facilitating any decision on futures contracts trading, is distributed by Standard Chartered Bank (Hong Kong) Limited (“SCBHK”), a subsidiary of Standard Chartered PLC. SCBHK has its registered address at 32/F, Standard Chartered Bank Building, 4-4A Des Voeux Road Central, Hong Kong and is regulated by the Hong Kong Monetary Authority and registered with the Securities and Futures Commission (“SFC”) to carry on Type 1 (dealing in securities), Type 4 (advising on securities), Type 6 (advising on corporate finance) and Type 9 (asset management) regulated activity under the Securities and Futures Ordinance (Cap. 571) (“SFO”) (CE No. AJI614). The contents of this document have not been reviewed by any regulatory authority in Hong Kong and you are advised to exercise caution in relation to any offer set out herein. If you are in doubt about any of the contents of this document, you should obtain independent professional advice. Any product named herein may not be offered or sold in Hong Kong by means of any document at any time other than to “professional investors” as defined in the SFO and any rules made under that ordinance. In addition, this document may not be issued or possessed for the purposes of issue, whether in Hong Kong or elsewhere, and any interests may not be disposed of, to any person unless such person is outside Hong Kong or is a “professional investor” as defined in the SFO and any rules made under that ordinance, or as otherwise may be permitted by that ordinance. In Hong Kong, Standard Chartered Private Bank is the private banking division of SCBHK, a subsidiary of Standard Chartered PLC. Ghana: Standard Chartered Bank Ghana Limited accepts no liability and will not be liable for any loss or damage arising directly or indirectly (including special, incidental or consequential loss or damage) from your use of these documents. Past performance is not indicative of future results and no representation or warranty is made regarding future performance. You should seek advice from a financial adviser on the suitability of an investment for you, taking into account these factors before making a commitment to invest in an investment. To unsubscribe from receiving further updates, please send an email to feedback.ghana@sc.com. Please do not reply to this email. Call our Priority Banking on 0302610750 for any questions or service queries. You are advised not to send any confidential and/or important information to Standard Chartered via e-mail, as Standard Chartered makes no representations or warranties as to the security or accuracy of any information transmitted via e-mail. Standard Chartered shall not be responsible for any loss or damage suffered by you arising from your decision to use e-mail to communicate with the Bank. India: This document is being distributed in India by Standard Chartered in its capacity as a distributor of mutual funds and referrer of any other third party financial products. Standard Chartered does not offer any ‘Investment Advice’ as defined in the Securities and Exchange Board of India (Investment Advisers) Regulations, 2013 or otherwise. Services/products related securities business offered by Standard Charted are not intended for any person, who is a resident of any jurisdiction, the laws of which imposes prohibition on soliciting the securities business in that jurisdiction without going through the registration requirements and/or prohibit the use of any information contained in this document. Indonesia: This document is being distributed in Indonesia by Standard Chartered Bank, Indonesia branch, which is a financial institution licensed and supervised by Otoritas Jasa Keuangan (Financial Service Authority) and Bank Indonesia. Jersey: In Jersey, Standard Chartered Private Bank is the Registered Business Name of the Jersey Branch of Standard Chartered Bank. The Jersey Branch of Standard Chartered Bank is regulated by the Jersey Financial Services Commission. Copies of the latest audited accounts of Standard Chartered Bank are available from its principal place of business in Jersey: PO Box 80, 15 Castle Street, St Helier, Jersey JE4 8PT. Standard Chartered Bank is incorporated in England with limited liability by Royal Charter in 1853 Reference Number ZC 18. The Principal Office of the Company is situated in England at 1 Basinghall Avenue, London, EC2V 5DD. Standard Chartered Bank is authorised by the Prudential Regulation Authority and regulated by the Financial Conduct Authority and Prudential Regulation Authority. The Jersey Branch of Standard Chartered Bank is also an authorised financial services provider under license number 44946 issued by the Financial Sector Conduct Authority of the Republic of South Africa. Jersey is not part of the United Kingdom and all business transacted with Standard Chartered Bank, Jersey Branch and other SC Group Entity outside of the United Kingdom, are not subject to some or any of the investor protection and compensation schemes available under United Kingdom law. Kenya: This document is being distributed in Kenya by and is attributable to Standard Chartered Bank Kenya Limited. Investment Products and Services are distributed by Standard Chartered Investment Services Limited, a wholly owned subsidiary of Standard Chartered Bank Kenya Limited that is licensed by the Capital Markets Authority in Kenya, as a Fund Manager. Standard Chartered Bank Kenya Limited is regulated by the Central Bank of Kenya. Malaysia: This document is being distributed in Malaysia by Standard Chartered Bank Malaysia Berhad (“SCBMB”). Recipients in Malaysia should contact SCBMB in relation to any matters arising from, or in connection with, this document. This document has not been reviewed by the Securities Commission Malaysia. The product lodgement, registration, submission or approval by the Securities Commission of Malaysia does not amount to nor indicate recommendation or endorsement of the product, service or promotional activity. Investment products are not deposits and are not obligations of, not guaranteed by, and not protected by SCBMB or any of the affiliates or subsidiaries, or by Perbadanan Insurans Deposit Malaysia, any government or insurance agency. Investment products are subject to investment risks, including the possible loss of the principal amount invested. SCBMB expressly disclaim any liability and responsibility for any loss arising directly or indirectly (including special, incidental or consequential loss or damage) arising from the financial losses of the Investment Products due to market condition. Nigeria: This document is being distributed in Nigeria by Standard Chartered Bank Nigeria Limited (SCB Nigeria), a bank duly licensed and regulated by the Central Bank of Nigeria. SCB Nigeria accepts no liability for any loss or damage arising directly or indirectly (including special, incidental or consequential loss or damage) from your use of these documents. You should seek advice from a financial adviser on the suitability of an investment for you, taking into account these factors before making a commitment to invest in an investment. To unsubscribe from receiving further updates, please send an email to clientcare.ng@sc.com requesting to be removed from our mailing list. Please do not reply to this email. Call our Priority Banking on 02 012772514 for any questions or service queries. SCB Nigeria shall not be responsible for any loss or damage arising from your decision to send confidential and/or important information to Standard Chartered via e-mail. SCB Nigeria makes no representations or warranties as to the security or accuracy of any information transmitted via e-mail. Pakistan: This document is being distributed in Pakistan by, and attributable to Standard Chartered Bank (Pakistan) Limited having its registered office at PO Box 5556, I.I Chundrigar Road Karachi, which is a banking company registered with State Bank of Pakistan under Banking Companies Ordinance 1962 and is also having licensed issued by Securities & Exchange Commission of Pakistan for Security Advisors. Standard Chartered Bank (Pakistan) Limited acts as a distributor of mutual funds and referrer of other third-party financial products. Singapore: This document is being distributed in Singapore by, and is attributable to, Standard Chartered Bank (Singapore) Limited (Registration No. 201224747C/ GST Group Registration No. MR-8500053-0, “SCBSL”). Recipients in Singapore should contact SCBSL in relation to any matters arising from, or in connection with, this document. SCBSL is an indirect wholly owned subsidiary of Standard Chartered Bank and is licensed to conduct banking business in Singapore under the Singapore Banking Act, 1970. Standard Chartered Private Bank is the private banking division of SCBSL. IN RELATION TO ANY SECURITY OR SECURITIES-BASED DERIVATIVES CONTRACT REFERRED TO IN THIS DOCUMENT, THIS DOCUMENT, TOGETHER WITH THE ISSUER DOCUMENTATION, SHALL BE DEEMED AN INFORMATION MEMORANDUM (AS DEFINED IN SECTION 275 OF THE SECURITIES AND FUTURES ACT, 2001 (“SFA”)). THIS DOCUMENT IS INTENDED FOR DISTRIBUTION TO ACCREDITED INVESTORS, AS DEFINED IN SECTION 4A(1)(a) OF THE SFA, OR ON THE BASIS THAT THE SECURITY OR SECURITIES-BASED DERIVATIVES CONTRACT MAY ONLY BE ACQUIRED AT A CONSIDERATION OF NOT LESS THAN S$200,000 (OR ITS EQUIVALENT IN A FOREIGN CURRENCY) FOR EACH TRANSACTION. Further, in relation to any security or securities-based derivatives contract, neither this document nor the Issuer Documentation has been registered as a prospectus with the Monetary Authority of Singapore under the SFA. Accordingly, this document and any other document or material in connection with the offer or sale, or invitation for subscription or purchase, of the product may not be circulated or distributed, nor may the product be offered or sold, or be made the subject of an invitation for subscription or purchase, whether directly or indirectly, to persons other than a relevant person pursuant to section 275(1) of the SFA, or any person pursuant to section 275(1A) of the SFA, and in accordance with the conditions specified in section 275 of the SFA, or pursuant to, and in accordance with the conditions of, any other applicable provision of the SFA. In relation to any collective investment schemes referred to in this document, this document is for general information purposes only and is not an offering document or prospectus (as defined in the SFA). This document is not, nor is it intended to be (i) an offer or solicitation of an offer to buy or sell any capital markets product; or (ii) an advertisement of an offer or intended offer of any capital markets product. Deposit Insurance Scheme: Singapore dollar deposits of non-bank depositors are insured by the Singapore Deposit Insurance Corporation, for up to S$100,000 in aggregate per depositor per Scheme member by law. Foreign currency deposits, dual currency investments, structured deposits and other investment products are not insured. This advertisement has not been reviewed by the Monetary Authority of Singapore. Taiwan: SC Group Entity or Standard Chartered Bank (Taiwan) Limited (“SCB (Taiwan)”) may be involved in the financial instruments contained herein or other related financial instruments. The author of this document may have discussed the information contained herein with other employees or agents of SC or SCB (Taiwan). The author and the above-mentioned employees of SC or SCB (Taiwan) may have taken related actions in respect of the information involved (including communication with customers of SC or SCB (Taiwan) as to the information contained herein). The opinions contained in this document may change, or differ from the opinions of employees of SC or SCB (Taiwan). SC and SCB (Taiwan) will not provide any notice of any changes to or differences between the above-mentioned opinions. This document may cover companies with which SC or SCB (Taiwan) seeks to do business at times and issuers of financial instruments. Therefore, investors should understand that the information contained herein may serve as specific purposes as a result of conflict of interests of SC or SCB (Taiwan). SC, SCB (Taiwan), the employees (including those who have discussions with the author) or customers of SC or SCB (Taiwan) may have an interest in the products, related financial instruments or related derivative financial products contained herein; invest in those products at various prices and on different market conditions; have different or conflicting interests in those products. The potential impacts include market makers’ related activities, such as dealing, investment, acting as agents, or performing financial or consulting services in relation to any of the products referred to in this document. UAE: DIFC – Standard Chartered Bank is incorporated in England with limited liability by Royal Charter 1853 Reference Number ZC18.The Principal Office of the Company is situated in England at 1 Basinghall Avenue, London, EC2V 5DD. Standard Chartered Bank is authorised by the Prudential Regulation Authority and regulated by the Financial Conduct Authority and Prudential Regulation Authority. Standard Chartered Bank, Dubai International Financial Centre having its offices at Dubai International Financial Centre, Building 1, Gate Precinct, P.O. Box 999, Dubai, UAE is a branch of Standard Chartered Bank and is regulated by the Dubai Financial Services Authority (“DFSA”). This document is intended for use only by Professional Clients and is not directed at Retail Clients as defined by the DFSA Rulebook. In the DIFC we are authorised to provide financial services only to clients who qualify as Professional Clients and Market Counterparties and not to Retail Clients. As a Professional Client you will not be given the higher retail client protection and compensation rights and if you use your right to be classified as a Retail Client we will be unable to provide financial services and products to you as we do not hold the required license to undertake such activities. For Islamic transactions, we are acting under the supervision of our Shariah Supervisory Committee. Relevant information on our Shariah Supervisory Committee is currently available on the Standard Chartered Bank website in the Islamic banking section. For residents of the UAE – Standard Chartered UAE (“SC UAE”) is licensed by the Central Bank of the U.A.E. SC UAE is licensed by Securities and Commodities Authority to practice Promotion Activity. SC UAE does not provide financial analysis or consultation services in or into the UAE within the meaning of UAE Securities and Commodities Authority Decision No. 48/r of 2008 concerning financial consultation and financial analysis. Uganda: Our Investment products and services are distributed by Standard Chartered Bank Uganda Limited, which is licensed by the Capital Markets Authority as an investment adviser. United Kingdom: In the UK, Standard Chartered Bank is authorised by the Prudential Regulation Authority and regulated by the Financial Conduct Authority and Prudential Regulation Authority. This communication has been approved by Standard Chartered Bank for the purposes of Section 21 (2) (b) of the United Kingdom’s Financial Services and Markets Act 2000 (“FSMA”) as amended in 2010 and 2012 only. Standard Chartered Bank (trading as Standard Chartered Private Bank) is also an authorised financial services provider (license number 45747) in terms of the South African Financial Advisory and Intermediary Services Act, 2002. The Materials have not been prepared in accordance with UK legal requirements designed to promote the independence of investment research, and that it is not subject to any prohibition on dealing ahead of the dissemination of investment research. Vietnam: This document is being distributed in Vietnam by, and is attributable to, Standard Chartered Bank (Vietnam) Limited which is mainly regulated by State Bank of Vietnam (SBV). Recipients in Vietnam should contact Standard Chartered Bank (Vietnam) Limited for any queries regarding any content of this document. Zambia: This document is distributed by Standard Chartered Bank Zambia Plc, a company incorporated in Zambia and registered as a commercial bank and licensed by the Bank of Zambia under the Banking and Financial Services Act Chapter 387 of the Laws of Zambia.