16 December 2022
Outlook 2023
Outlook 2023
Playing it SAFE
In 2023, we expect recessions in the US and Europe, a recovery in China, a slowdown in global inflation, and a pause in Fed rates in H1 23, followed by cuts in H2 23. In this fast-changing environment, sequencing asset class preferences is likely to be key.
We prefer a SAFE approach to building foundation portfolios by: (i) Securing your yield via income strategies, (ii) Allocating to Asian assets that offer long-term value, (iii) Fortifying against surprises via defensive assets, and (iv) Expanding through alternative strategies.
We see opportunities in consumer-focused equity sectors in China as economic activity gradually normalises. In FX, we are bullish on the EUR and JPY on a 12-month horizon.
What is the macroeconomic outlook for 2023?
Why is a multi-asset income strategy a top pick in 2023?
What are your quant models signalling for 2023?
Letter from the CIO


As I look forward to the year ahead, if there is one piece of advice I can give, it is this: beware of the recency bias – placing too much emphasis on the freshest experiences… Public markets have gone on sale, and for yield-seeking investors, there is a significant opportunity in high-quality bonds.
2022 was a year to remember, and to forget! On the one hand, it was an opportunity to reconnect with family and friends across the world for the first time in over two years. It is amazing how something so simple, once taken for granted, can suddenly be so precious.
Once you turn your mind to investments however, it is likely that those memories will be replaced by less pleasant emotions. In some ways, 2022 has been the toughest year for investors in my 25+ year career. It is only the fourth year in 150 years that US equities and bonds have both lost value. The decline in equities is not extreme from a historical perspective, but the sharper decline in technology shares, which had outperformed for so long, made it feel a lot worse for a lot of investors. Meanwhile, for bonds, this year’s performance was among the four worst years in 150 years.
While it is important to reflect on the year past, if there is one piece of advice I can give, it is this: beware of the recency bias – placing too much emphasis on the freshest experiences. The growing narrative is that the 60:40 stock-bond portfolio is dead. To be honest, this has been true for a long time. For over 10 years, we have allocated to alternative assets including commodities and hedge fund strategies. Last year, we released updated strategic asset allocation models that included a 25% allocation to private assets. The good news is these are becoming more accessible to investors.
However, we should not take the outperformance of private assets in 2022 as an indication that public, listed asset markets are becoming less relevant to investors. The benefit of public markets is that there is almost always a price at which you can transact. You can take it or leave it, but it is there, although returns can be more volatile. This raises the potential for much greater opportunities as markets swing from greed to despair, but also increases portfolio volatility.
For private assets, liquidity is generally lower. However, this illiquidity can reduce price volatility, helping smoothen portfolio returns. Neither is better than the other; they are just different. A blended allocation is suitable for most investors.
As we head into 2023, it is important to remember that market corrections create opportunities. Public markets have gone on sale, and for yield-seeking investors, there is a significant opportunity in high-quality bonds where prices have fallen. For equities, we acknowledge that the risk of a recession is high and volatility is unlikely to dissipate quickly. However, markets are forward looking and much of this will be priced in soon; so, look for opportunities, especially in Asia.

Steve Brice
Global Chief Investment Officer
Strategy
Investment strategy: Playing it SAFE
|
|
||||
|

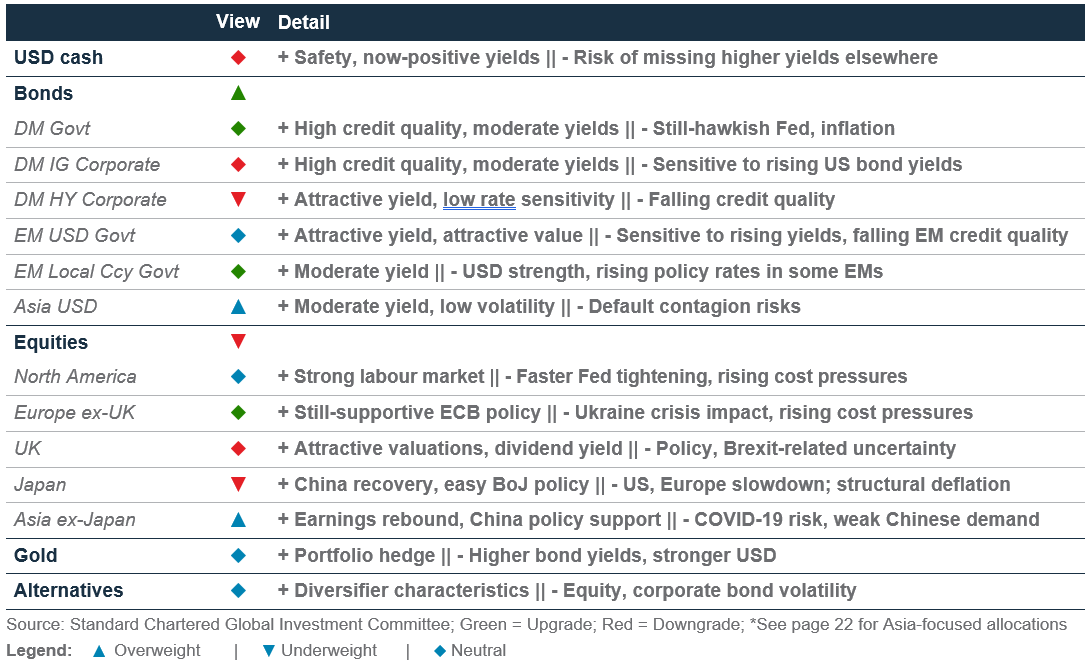
Our top preferences
(12-month outlook)
Foundation overweights
- Bonds – both government and corporate
- In equities: Asia ex-Japan
- In bonds: Asia USD
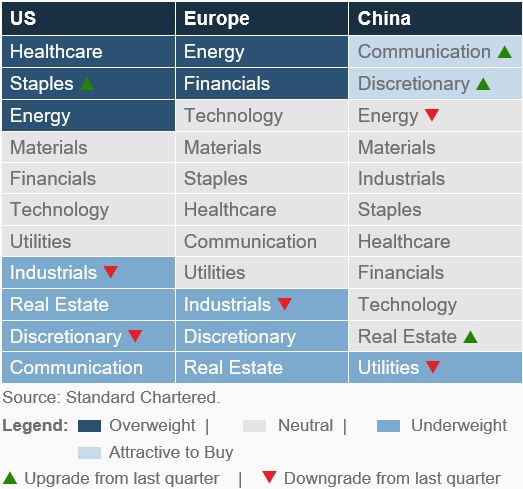
Sector overweights
- US: Healthcare, Staples, Energy
- Europe: Energy, Financials
- China: Comms. Services, Consumer Discretionary
FX views
- EUR, JPY top beneficiaries of a weaker USD
Structural macro trends*
- A digital tomorrow
- Preparing for an aging world
- From unipolarity to multipolarity
- Investing in a climate-constrained world
*Individual reports available
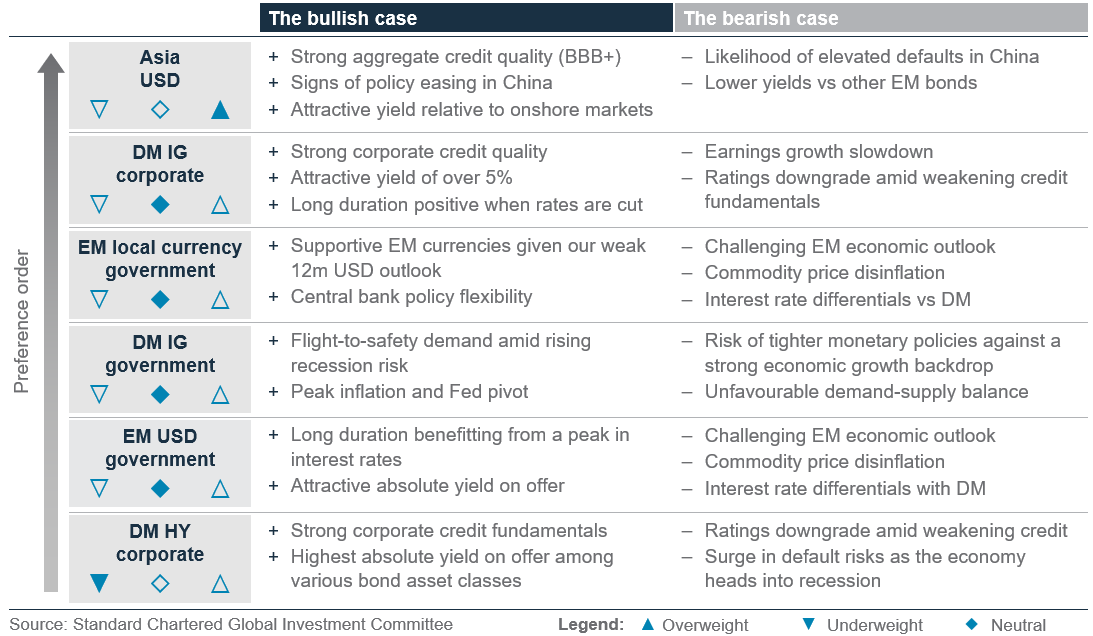
Playing it SAFE
- In 2023, we expect recessions in the US and Europe, a recovery in China, a slowdown in global inflation, and a pause in Fed rates in H1 23, followed by cuts in H2 23. In this fast-changing environment, sequencing asset class preferences is likely to be key.
- We believe it will pay to be SAFE: (i) Secure your yield via income strategies, (ii) Allocate to Asian assets offering long-term value, (iii) Fortify against surprises via defensive assets, and (iv) Expand beyond the traditional via alternative strategies.
- We see opportunities in consumer-focused equity sectors in China as the economy reopens. In FX, we are bullish on the EUR and JPY over a 12-month horizon.
A SAFE approach to foundation portfolios
Financial markets in 2022 left investors with unusually few places to hide, with stocks and bonds both down for only the fourth time in the last 150 years. The experience raises the risk of investors falling prey to the recency bias and extrapolating recent trends into the future. However, history suggests that an unusually bad year for investors is rarely, if ever, followed by yet another poor year. Thus, we believe a fresh perspective based on current market conditions will best serve investors from here.
We expect the economic growth backdrop to remain challenging in 2023. One of the fastest Fed interest rate hiking cycles on record makes a US economic recession very likely. We also expect a recession in Europe due to the energy price shock. An economic slowdown should help inflation cool significantly, but not all the way back to 2%. We expect growth in China to be the exception as a gradual removal of mobility restrictions and a policy focus on growth stabilisation improve consumer and business sentiments.
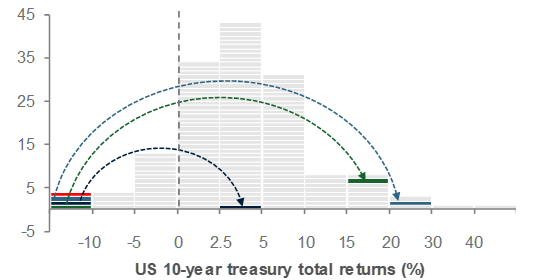
This backdrop is useful for investors because the historical behaviour of major asset classes through a recession can offer a guide to asset class performance. On average, high-quality bonds bottom first, usually not far from the last Fed rate hike in a cycle. Equities usually bottom later – but typically well before an economic recession ends – once the ensuing rate cutting cycle improves the growth outlook.
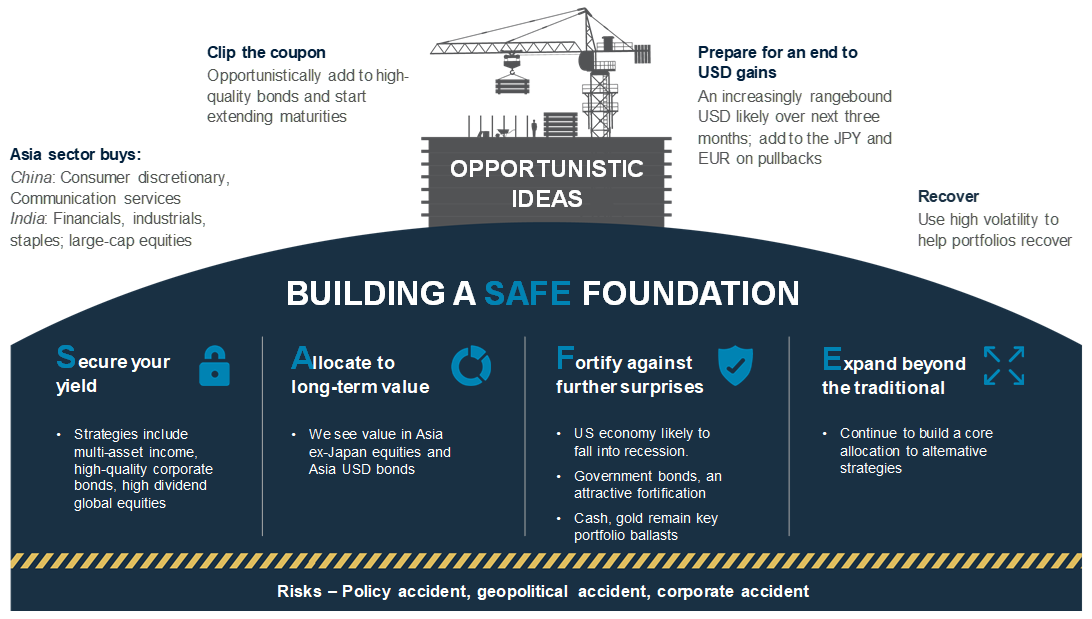
Against this backdrop, we see a SAFE strategy as a prudent way to build Foundation allocations in 2023 by: Securing your yield, Allocating to Asian assets offering long-term value, Fortifying against further surprises and Expanding beyond the traditional.
Fig.1 Bond returns have historically been very positive in the years after very negative returns
Calendar year US bond returns distribution over 150 years
Secure your yield
We see today’s bond yields as one of the best opportunities of 2023. We are Overweight bonds – including government and high-quality corporate – relative to equities and cash.
Corporate Investment Grade (IG) bond yields are not far from peaks last achieved in the cycle prior to 2008. We also expect the Fed to reach the peak of its current hiking cycle in H1 2023. In our view, this has created an attractive opportunity to lock in an attractive long-term yield.
We also see a growing possibility of capital gains. Historically, US government bond yields tend to peak around the last rise of a Fed hiking cycle, with bond yields subsequently falling (bond prices rising) as markets start to worry about slower growth and the likelihood of eventual rate cuts. Therefore, we would move to lock in the current yield levels soon, particularly on any spikes in the 10-year US government bond yield to or above 3.75%. We would also lengthen maturity profiles to take advantage of an eventual turn in bond yields. This will help mitigate reinvestment risk if yields move lower by end-2023, as we expect.
High-quality IG bonds, both government and corporate, are one route to earn income. High dividend equities are another, given their history of outperforming mainstream equity indices in current environments. Our multi-asset income strategy seeks to bring these asset classes together to offer an attractive income.
Allocate to long-term value
While today’s higher yields offer a more immediate income opportunity, we also believe this should be balanced by exposure to assets offering longer-term value. We currently see attractive value in Asia ex-Japan equities and bonds.
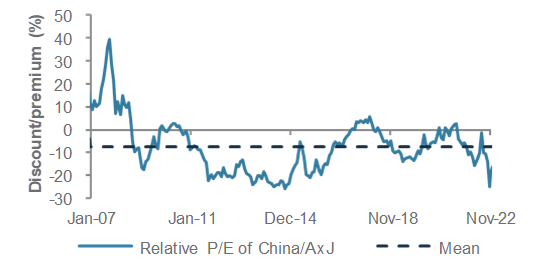
Given likely recessions in the US and Europe, history suggests their equity markets have not yet bottomed. Asia ex-Japan, though, is likely the key exception and we believe the region’s equities now offer value. This is best exemplified by P/E valuations on Chinese equities that are not far from the previous crisis lows. Chinese policy has already pivoted
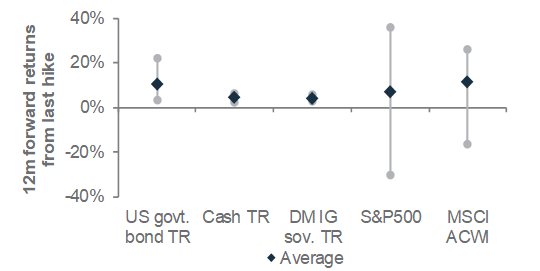
Fig.2 High-quality bonds offer the best chance of positive returns 12m after the last Fed rate hike
Range of asset class returns after last hike of a Fed cycle
towards stabilising growth, but the ongoing gradual easing of extreme mobility restrictions is likely to allow these measures to start having a positive impact. More broadly, a turn in the USD should ultimately be supportive for EM assets, including Asian equities.
Within Asia ex-Japan, we are Overweight Chinese equities as we expect them to outperform the region given their inexpensive valuations and positive catalysts (we, however, expect temporary setbacks, given the reopening experience of other major markets).
Indian equities could struggle to replicate their spectacular regional outperformance in 2022 given elevated valuations, but still-robust earnings growth and the return of foreign investment flows mean we expect them to perform in line with the region and outperform global equities. In India, we are Overweight large-cap equities.
We also see long-term value in Asia USD bonds. While pockets of High Yield bonds could remain under some stress, we believe c.6.5% yield is an attractive value for an asset class where 85% of bonds are Investment Grade-rated.
Fortify against further surprises
While yield and long-term value offer room for optimism in 2023, we believe a US recession outlook means investors should be prepared for downside surprises. The Fed has yet to sound the all-clear in terms of its comfort with inflation’s path and the market’s rate expectations. US or European equities have arguably not yet witnessed a ‘capitulation’ event often associated with a recessionary equity market bottom.
High-quality government bonds can mitigate such surprises, given yields should move lower (bond prices should rise) in such a scenario. However, maintaining neutral allocations within foundation portfolios towards portfolio ballasts in the form of cash and gold are prudent, in our view. Cash yields continue to rise alongside Fed rates. Gold should also benefit from the eventual turn lower in real (net of inflation) bond yields, though the decline in yields is likely to only come through much later in the year.
Fig. 3 Our 2023 Outlook
Expand beyond the traditional
We believe the unusual rise in stock-bond correlations in 2022 is unlikely to last into 2023. Nevertheless, the experience means the demand for relatively uncorrelated assets, or less volatile substitutes for traditional asset classes, is likely to sustain.
This is where a neutral allocation to alternative strategies can help. Liquid alternative strategies are one potential route. While many of these tend to be relatively less volatile ‘substitutes’ for equities, ‘diversifiers’ such as macro/CTA strategies tend to outperform during recessionary and/or trending markets. Private asset classes can be another route. Private credit strategies, for example, fit well into our preference for income and are a preferred substitute for riskier bonds (such as leveraged loans or High Yield bonds).
Opportunistic allocations – a weak USD
We expect currency markets to offer scope for opportunistic allocations as the USD weakens over the next 12 months.
Over the past year, the USD has singularly benefited from higher US bond yields and rapid upward shifts in Fed policy rate expectations. This could spill over into Q1 23, recent price action notwithstanding, as markets continue to debate when the Fed Funds rate will peak, resulting in a volatile but rangebound USD on a three-month horizon.
Looking beyond this, though, we believe the USD is likely to turn lower over the next 6-12 months as the Fed pauses in its rate hiking cycle. Elevated valuations make the USD more vulnerable as the Fed cycle turns.
History shows that most currencies tend to rise during periods of USD weakness. We are bullish on the EUR and JPY and expect them to be strong performers on a 12-month horizon. We would use any Q1 weakness to add exposure to these currencies. The other beneficiary of a weaker USD is likely to be Emerging Market assets – including our preferred Asia ex-Japan equities – which usually gain significantly from a weaker USD.
Sector buys – the Asia recovery
We expect equity sector picks to be a second source of opportunistic returns. Given our Overweight view on Asia ex-Japan, our sector preferences in the region are more pro-cyclical. In China, we would buy the communication services and consumer discretionary sectors, which we expect to benefit from increasingly supportive policies and reduced mobility restrictions. In India, we would buy the financial, industrial and consumer staples sectors, which should benefit from domestic demand.
In the US, our expectation of an economic recession and a lower equity market bottom mean our sector preferences are more defensive. We have a relative preference for the healthcare and staples sectors that have delivered positive earnings in recent recessions. We also favour energy, where we see attractive valuations.
In Europe, we are Overweight financials given inexpensive valuations and improving earnings on the back of higher interest rates. We also prefer the energy sector, given the still-significant sector discount, compared with history.
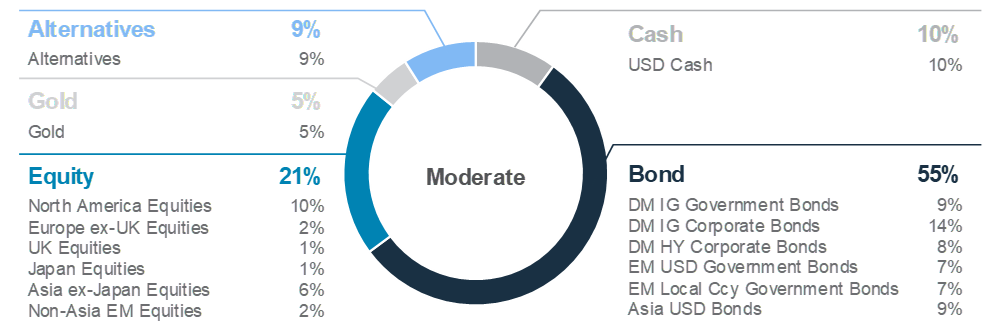
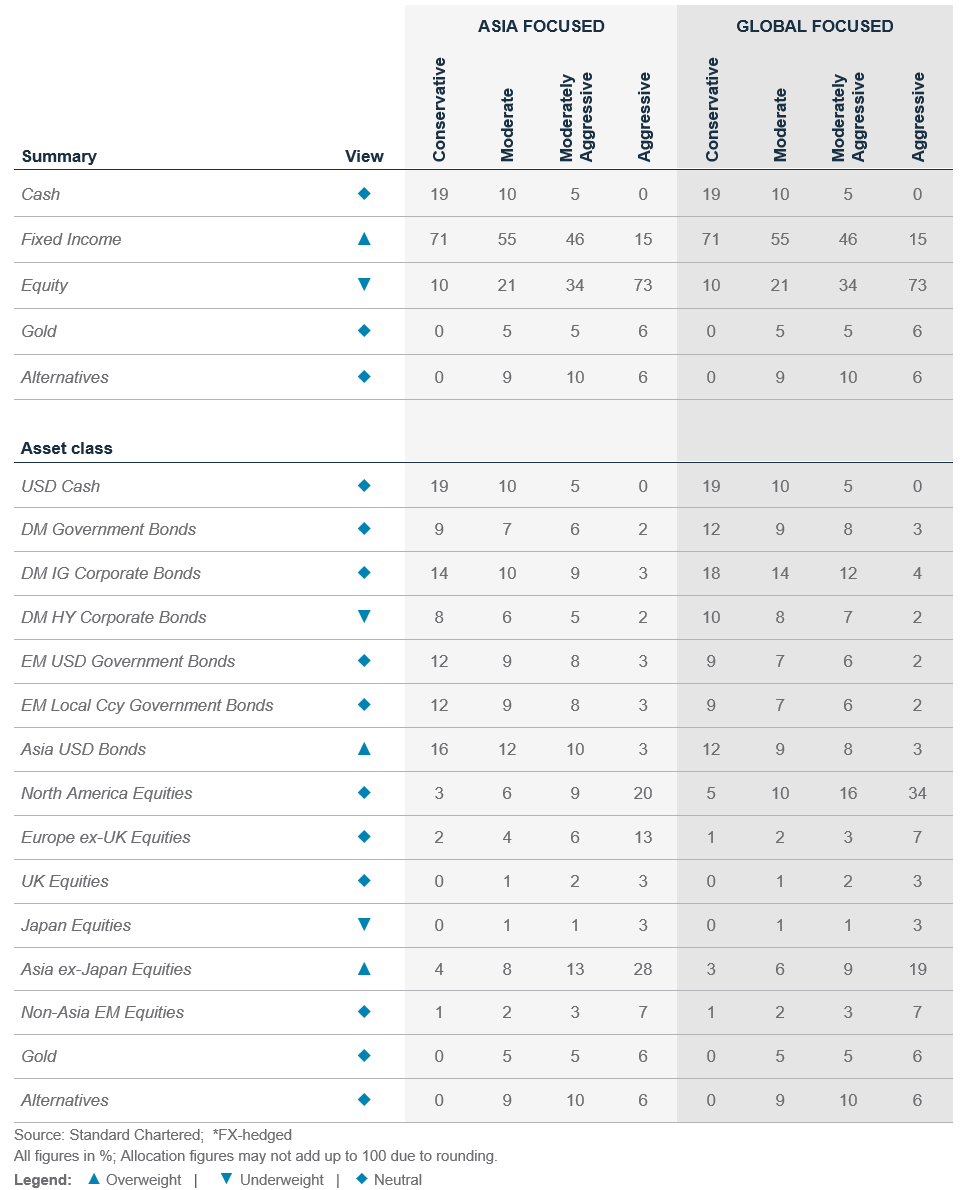
Foundation: Our tactical asset allocation
Global* allocation for a moderate risk profile
Multi-asset income allocation for a moderate risk profile
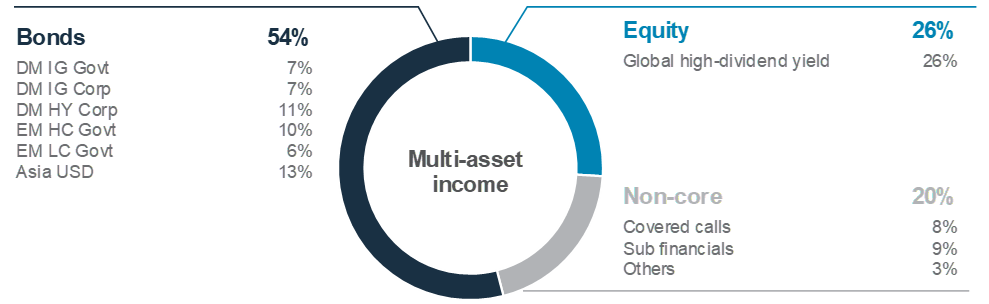
Foundation: Multi-asset income strategies
|
|
||||
Key themes
Income assets are one of the key investment opportunities in 2023, in our view. Our model, diversified multi-asset income (MAI) strategy, is offering a yield of over 6%, levels last seen before the Global Financial Crisis. We believe investors have a window to lock in an attractive yield given the Fed is likely to approach the peak of its hiking cycle in H1 23 and potentially cut thereafter.
Within our MAI allocation, we have a larger-than-benchmark tilt towards fixed income assets. While the 10-year US government bond yield has declined recently, yields of other income assets are still trading near the top end of their historical range. High-quality fixed income assets have tended to trough around the last Fed hike, as markets start to price an economic slowdown and eventual rate cut. We expect the US economy to enter a mild recession in 2023. Today’s higher starting yields and relatively wide credit spreads mean the chances of earning returns in excess of the average yields across most bond assets is much higher than a year ago. We add a tilt towards Developed Market Investment Grade and Emerging Market bonds within the fixed income sleeve and have closed our relative preference for leverage loans vs High Yield bonds.
We have a smaller-than-usual allocation to high dividend equities, given our expectations of a recession in the US and Europe in 2023. Having said that, we are acutely mindful of the risk of under-allocating to equities over longer horizons. High dividend equities remain an important source of income and growth within our MAI allocation and they usually outperform global equities during such recessionary periods. A still-reasonable allocation to high dividend equities also helps mitigate the long-term risk of losing value in inflation-adjusted terms if one allocates solely to cash and fixed income.
Key chart
We maintain a strong conviction in income strategies, given the attractive yields on offer and income being key from a total returns perspective
Fig. 4 Yields on MAI increasingly anchored by the fixed income component
Yields, duration and allocations of bonds, equity and non-core within our multi-asset portfolio
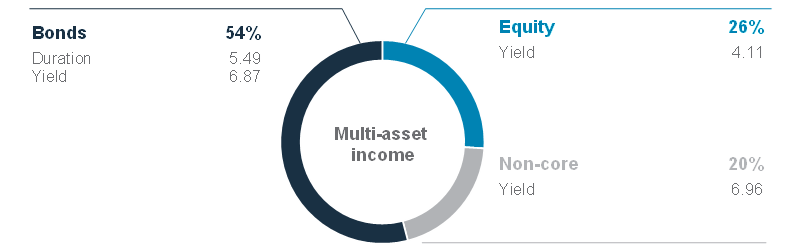
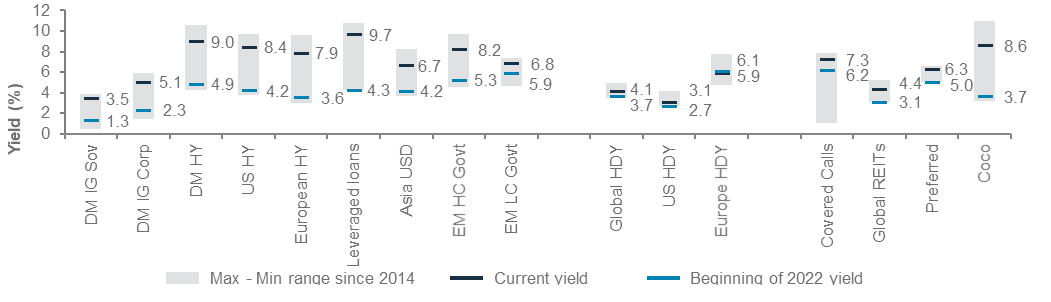
Fig. 5 Attractive opportunities for investors to lock in higher yields, with yields across income assets near multi-year highs
Yield to worst/dividend yield (%)
The year of income
A key challenge facing investors over the past decade has been earning an attractive income without taking on excessive risk. With cash offering a yield of well over 4% and the proportion of negative-yielding bonds declining from a peak of close to 30% to under 5%, investors today have a wider array of assets to choose from.
We expect income strategies to outperform a balanced asset allocation in 2023. Higher yields, moderating growth and an elevated risk of economic recession support assets with stable cash flows, such as those in MAI strategies. Hence, we favour such strategies over pure growth-focused equities and balanced allocations.
Income will be an increasingly important contributor of total returns as the Fed continues to hike rates, pushing yields higher. A higher starting yield, both from dividends and coupons, offers a greater cushion against downside price volatility.
Fig. 6 DM sovereign bonds have been most resilient, while dividend equities usually suffer in a recession
Performance during past recessions (2001, 2008, 2020)*
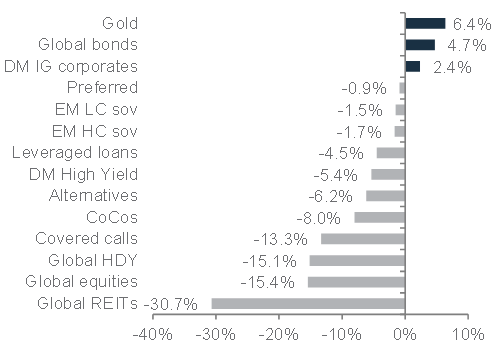
*CoCos and preferred securities for 2020 recession, while Global REITs, Asia USD bonds and EM LC Sov for 2008 and 2020 recessions
Compelling income in bonds…
Investors today can achieve an attractive income in many bond segments by just taking on relatively modest interest rate and credit default risks. We have increased our allocation to Developed Market Investment Grade bonds, where yields have been near the top end of their historical range since 2014 (e.g., DM IG government bonds yield over 3%, compared with 1.3% at the start of 2022). We have also added to Asia USD bonds where the spreads over Asia local currency bonds are the highest in nearly a decade. We expect Asia USD bonds, in which China makes up more than 50% of the asset class, to benefit from China’s easing of mobility restrictions and greater support to the property sector. Importantly, valuations of Asia USD bonds are at a much more inexpensive starting point. Spreads are wide relative to history and could offer room for tightening if China’s economy offers further signs of recovery.
We have, however, closed our preference for leveraged loans that benefitted from the surge in yields YTD. While default rates have remained low, they will likely pick up as loan rates get progressively reset higher over the coming quarters. In contrast, DM HY issuers allowed more issuers to lock in low borrowing costs when rates were low.
We also continue to like subordinated financials, such as Contingent Convertibles (CoCos) and preferred securities relative to DM HY bonds for their income and capital appreciation potential. CoCos yield over 9% and European banks today are in a much better capital position with common equity ratios above the 7% write-down threshold for most AT1.
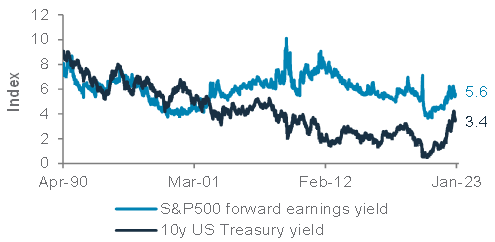
Fig. 7 Narrowing gap between forward earnings yield and 10y US government bond yield gives us more confidence to add to fixed income within the MAI basket
S&P500 forward earnings yield vs 10y US Treasury yield
…but equity income is still relevant
While we believe additional equity downside is possible, we are only slightly Underweight dividend-paying equities in our MAI allocation. Given the size of the equity drawdown thus far from its 2022 peak, getting excessively defensive at this stage is likely be counterproductive. Historically, high dividend equities have outperformed global equities during periods of high inflation, though the track record during recessionary periods has admittedly been mixed.
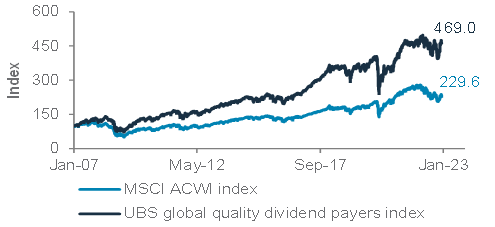
Fig. 8 Dividend payers have historically outperformed global equities and the gap has been widening
Performance of relevant indices since 1 April 2007 rebased to 100
With the macroeconomic outlook remaining uncertain, a diversified income portfolio offers a prudent way to maintain an equity allocation. Additionally, income strategies present attractive opportunities given the high yields on offer, allowing investors to be paid, while riding out the impending recession.
Macro overview – at a glance
Summary
|
|
||||
Key themes
Our central scenario is for recession in both the US and Europe in 2023. Central banks are expected to continue raising policy rates through the first half of 2023 in their efforts to stamp out inflation that is running at close to 40-year highs. Nevertheless, any downturn is likely to be relatively mild, except in the UK, given the absence of major economic or financial imbalances elsewhere. We expect the Fed to raise rates to a peak of 5.25%, before cutting back towards 4.5% by the end of the year as recession sets in. The ECB is likely to be less aggressive than the Fed, raising the Deposit Facility rate to 2.5% by June, before cutting back to 2.0-2.25% by the end of the year. A recession is likely to help lower US inflation towards 3% y/y by Q4 23.
In contrast with recessions in the US and Europe, we see mainland China entering a reflationary cycle as the authorities continue to ease pandemic-related mobility restrictions, especially once we get past the winter and vaccination rates for the elderly rise. This is likely to revive consumption and services activity by H2 23, helping offset a slowdown in exports, as demand for goods weaken in recession-affected US and Europe. Meanwhile, subdued inflation should allow policymakers to persist with fiscal and monetary stimulus to revive the economy, lifting growth close to 5% next year.
Key chart
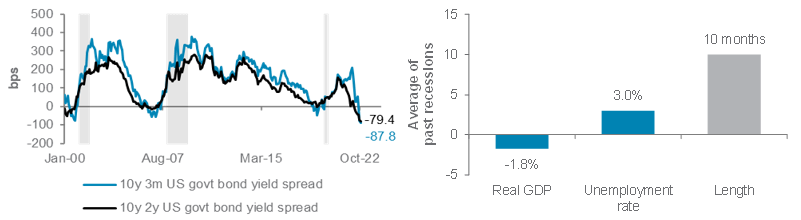
The inversion of the global and US bond yield curves are signalling that short-term policy rates, especially in the US, are now so tight that they are likely to cause an economic downturn in the coming year
Fig. 9 We expect a global recession in 2023, led by mild US and Euro area downturns
US bond yield curves*; average of the past eight US recessions, excluding 2020
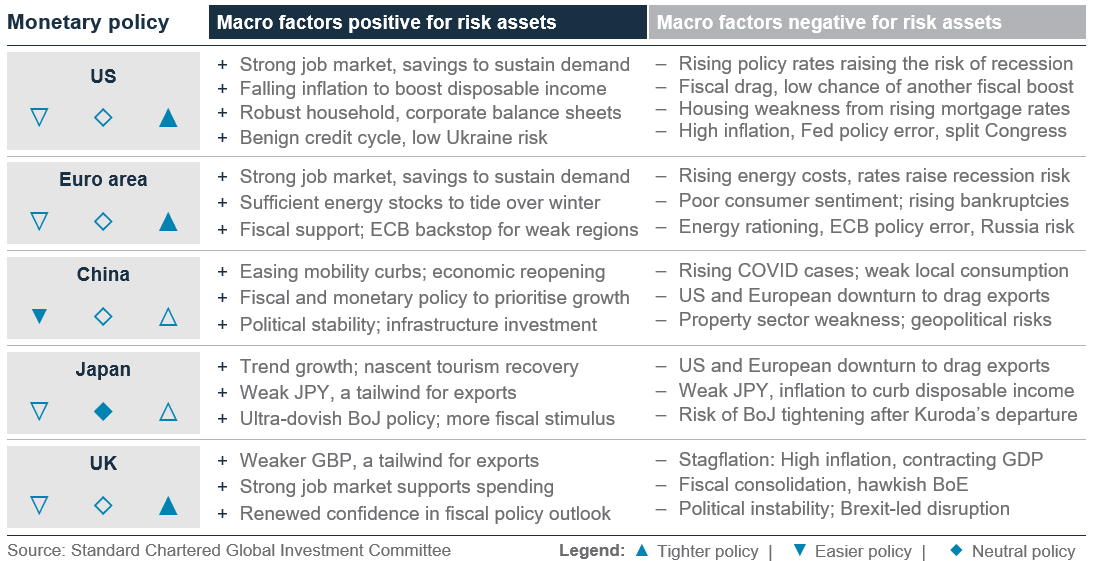
Developed Market recession, China reflation
The US and Euro area are likely to see a mild recession in 2023 as central banks keep tightening policy to bring inflation back towards their 2% target, while China is likely to gradually recover from its downturn as it relaxes mobility restrictions and eases fiscal and monetary policies.
US recession monitor: As we come towards the end of 2022, more and more indicators are suggesting a recession is around the corner. The global bond yield curve inverted for the first time in over 20 years, following earlier inversions in US yield curves, including the Fed’s preferred recession indicator. The inversions mean bond investors are signalling that short-term rates have tightened enough to cause a downturn.
Meanwhile, the ISM Manufacturing business confidence index fell below 50 in November for the first time since the depths of the pandemic, while the forward-looking ISM New Orders PMI remained in the contraction territory for the third straight month. These indicate that the goods sector has likely started to contract. Bank lending standards for corporates are tightening at a rate consistent with a recession. However, the services sector, which accounts for two-thirds of US output, is still expanding strongly. The services expansion is sustained by a shift in consumption patterns from goods to services as more people venture out for work, holidays and entertainment. Excess savings built during the pandemic (estimated at USD 2trn) and plentiful jobs are likely to sustain consumption through to Q1 23, in our view. However, there are signs that the lower-income segment is running out of pandemic-era savings and taking on debt to sustain consumption. This means consumption could flag if the job markets slow sharply.
Thus, job market indicators need to be watched closely. Jobless claims have been rising slowly since hitting 50-year lows in March this year, but the strong pace of monthly hiring has kept the US unemployment rate well below the Fed’s long-run target of 4%. A tight job market is fuelling wages, a key component of services sector inflation, even as goods inflation slows sharply. This explains why the Fed is aiming to cool the job market. As the chart below shows, there is a narrow path towards an economic soft landing and bringing inflation towards the Fed’s 2% target, but that would involve raising the jobless rate towards 6%, from this year’s 50-year
Fig. 10 Lower US inflation means a higher jobless rate
US Phillips curve*: Inflation vs unemployment rate
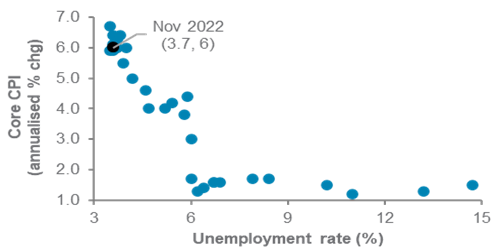
low of 3.5%. That would be in line with the average 3.0ppt rise in US jobless rate over the past eight recessions (excluding 2020; see chart). Given the tight balancing act involved, we expect the Fed to stop hiking rates at 5.25% in H1 23. Once a recession hits by mid-2023, we expect the Fed to cut rates to 4.5% by year end. The biggest risk to this view is a policy mistake, where the Fed overtightens in its inflation fight (inflation is a lagging indicator), causing a deeper-than-expected recession.
Euro area entering a recession: The Euro area economy, facing the brunt of the Ukraine crisis, started contracting in Q4 22, according to consensus estimates. We expect the contraction to extend into 2023 as high inflation curtails disposable income and consumption, while tighter financial conditions curb business spending. Governments are partly shielding consumers and businesses from surging energy costs, and record gas stockpiles, aided by soaring LNG imports, should help partly offset the plunge in Russian energy supplies. The EU’s Recovery Fund is also boosting defence and energy infrastructure. These factors and a structurally tight job market should help prevent a deeper recession. Nevertheless, with inflation estimated to remain above 5% in 2023, the ECB has a tough balancing act given its sole mandate to return inflation to 2%. We believe it will be constrained by politics as recession hits. Thus, we see the ECB Deposit Facility rate peaking at 2.5%, up from 2% today.
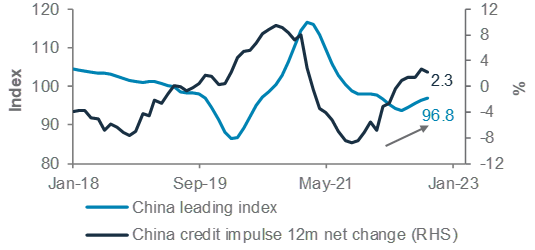
China to recover in 2023: In contrast to recessions in the US and Europe, we expect China’s economy to grow close to 5% next year as the services sector and consumption normalise. Measures to speed up vaccinations for the elderly have led major cities to gradually relax mobility restrictions. Authorities have also eased property sector policies, helping stabilise the sentiment. We expect more targeted fiscal and credit policies to revive consumption and boost credit towards priority sectors, such as advanced technology hardware and green infrastructure, once mobility restrictions are further relaxed by Q2 23. The key risk to this view is a sharp revival of COVID-19 during the winter delaying the economic reopening, increasing geopolitical tensions with the US and a persistent slump in the demand for properties, despite the ongoing measures to stabilise the sector.
Fig. 11 China to ease credit further to revive growth
China’s leading index and credit impulse 12-month net change
Asset Classes
Bonds – at a glance
|
|
||||
Key themes
We are Overweight bonds, including both government and high-quality corporate debt, over equities, as the developed world is expected to head into recession in 2023. The 10-year US government bond yield is expected to rise towards 3.75%-4.0% in Q1 23 as the Fed seeks to maintain tight financial conditions for now. However, the 10-year US yield is likely to edge lower towards 3.25% by end-2023 as a likely decline in US inflation and rising recession risks lead the Fed to pause rate hikes in H1 23 and start cutting rates by end-2023.
Within a larger-than-usual allocation to bonds, Asian USD bonds are Overweight given their high aggregate credit quality, relatively stronger regional economic outlook and growing policy support in China. Developed Markets (DM) Investment Grade (IG) government and corporate bonds are Neutral within bond allocations. DM High Yield (HY) corporate bonds, though, are Underweight as we believe the impact from a recession is not fully priced in. Our expectation of a weaker USD, but still-tight Fed policy, leads us to hold a Neutral stance on both EM local currency and EM USD government bonds.
Key chart
Yields across bond asset classes are well above their long-term averages; history shows DM IG bonds usually outperform when the Fed pivots
Fig. 12 DM IG bond yields are close to their highest levels since 2010
Current bond yields vs 10y average; yield changes during Fed hikes and pivots since 1971
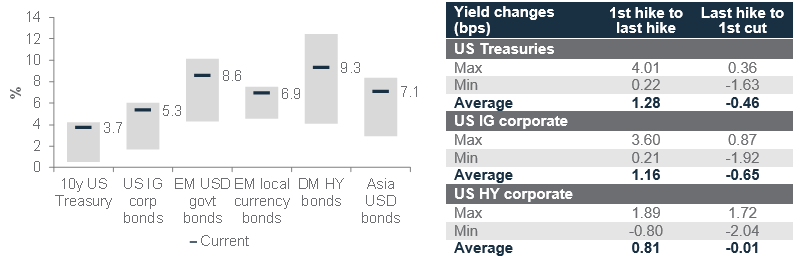
Overweight high-quality bonds
Against the backdrop of heightened US recession risks, we believe defensive assets will outperform in the next 12 months. Hence, as we discuss in the SAFE framework, we are Overweight bonds, including both government and high-quality corporate bonds, relative to other major asset classes.
Overweight Asia USD bonds
Asian USD bonds outperformed global bonds in 2022, helped by lower interest rate sensitivity and recent policy support in China. We expect this outperformance trend to continue into 2023 as bond yield premiums decline on expectations of more policy easing measures by the Chinese authorities. This contrasts with the US where both fiscal and monetary policies are much less accommodative.
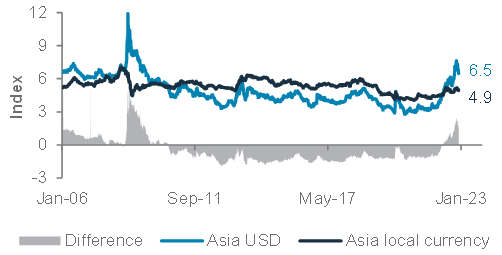
Valuations of Asia USD bonds are attractive, with yield premiums (and the yield itself) having surged to over 310bps and c.6.5%, respectively. Although occasional defaults or restructuring could bring about higher volatility, we see current bond prices to have largely priced in such risks. In addition, the yield on offer has surpassed the local currency bond yields for the first time in nearly a decade.
In 2022, Asian HY bonds underperformed their IG counterparts owing to rising defaults in the Chinese HY property sector. Although we expect similar pricing shocks should be largely behind us amid several rounds of rescue measures, the recovery road ahead is likely to be bumpy and, hence, we have a slight preference for Asia IG bonds.
Fig. 13 USD yields have surged above local rates, making Asian USD bonds more attractive to local currency-based investors
JPMorgan Asia Credit Index yield, JPMorgan GBI-EM Broad Diversified Asia yield
Neutral DM IG corporate and government bonds
We believe the Fed is likely to maintain a restrictive monetary policy for most of 2023. This would raise the risk of a recession, in our view – an outcome that is usually positive for high-quality bonds as investors start to anticipate interest rate cuts and a decline in bond yields (rise in bond prices).
Within this segment, we have a Neutral stance on IG government bonds as expectations of a DM central bank pivot in 2023 is offset by unfavourable demand-supply balance.
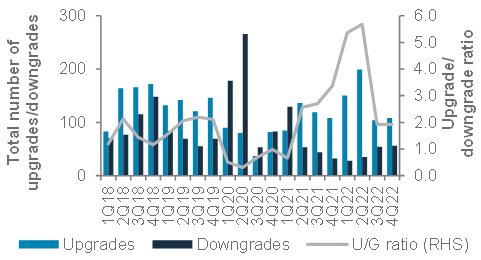
Downside risks to corporate earnings do admittedly rise as rising Fed rates raise interest expense burdens. However, we believe the positive effect of falling bond yields and preference for high-quality income assets should outweigh this. Hence, we have a Neutral stance on DM IG corporate bonds.
Fig. 14 DM IG fundamentals remain strong as rating upgrades outpace downgrades
US IG corporates quarterly upgrade/downgrade ratio and total number counts
Neutral EM local currency and EM USD government bonds
Surging recession risks in DMs likely pose a challenge to most EMs, especially if commodity prices face downside pressure. However, we believe there are sufficient factors to offset these risks, causing us to hold a Neutral stance on EM bonds (both local currency and the USD):
- EM asset market performance, including bonds, typically has a high correlation with EM currencies. Our expectation of a modestly weaker USD on a 12-month view would likely be beneficial to EM currencies and bonds.
- Most EM central banks have front-run DM central banks in tightening monetary policies to defend their currencies in 2022. We believe it puts EM central banks in a more flexible position to ease monetary policies in need.
- EM USD bonds are also very sensitive to changes in US bond yields, which should prove supportive if US bond yields fall, as we expect.
Underweight DM HY corporate bonds
The one asset class that could face pressure from slowing US/European growth is DM HY bonds. Credit ratings downgrades are likely to accelerate when corporate earnings face deeper pressure as revenue growth slows and interest burdens climb. We believe these risks are not fully priced in by current yield premiums. Hence, we have an Underweight stance on DM HY bonds.
Equity – at a glance
|
|
||||
|
Key themes
We enter 2023 Underweight equities given our central scenario of a recession in the US and Europe. Central bank tightening and weakening consumption patterns are likely to pose downside risks to earnings estimates on a 12-month horizon.
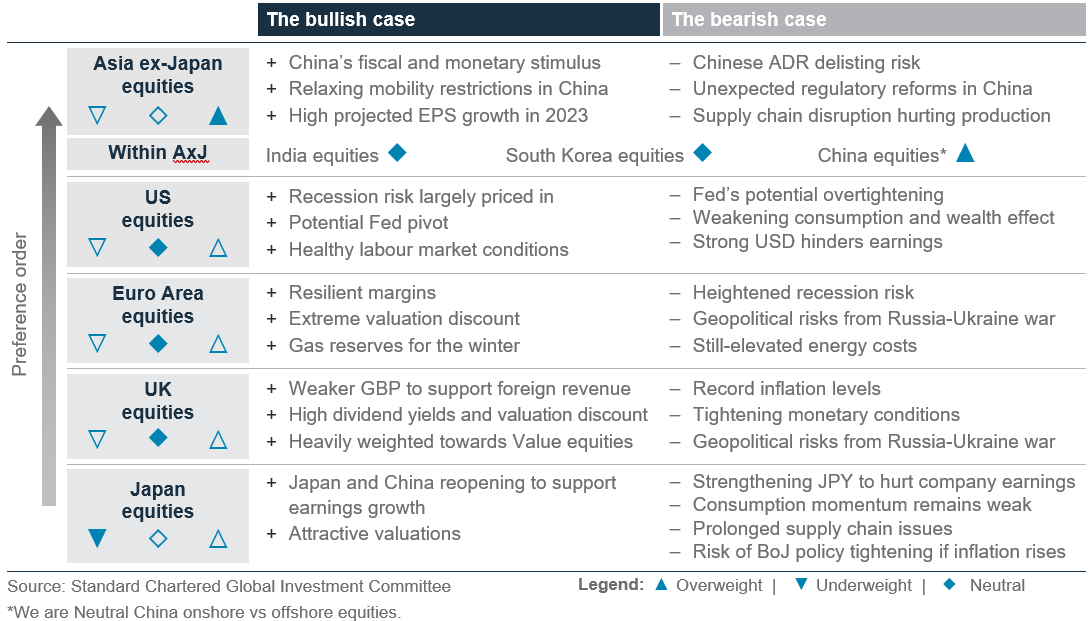
We are Overweight Asia ex-Japan, with China’s economic recovery likely to support an improved earnings growth profile. Meanwhile, a potential deceleration in Fed rate hikes and a weaker USD are expected to support fund flows into Emerging Markets in 2023. Within Asia ex-Japan, we are Overweight China equities given easing mobility restrictions and favourable fiscal and monetary policies. However, we have an equal preference for onshore vs offshore equities as we believe the regulatory risks for the internet sector and ADR delisting risks are fading. We are Neutral Indian equities given the trade-off between relatively strong earnings and high valuations. Within Indian equities, we prefer large cap over small and mid-cap.
We are Neutral US equities and remain cautious due to relatively expensive valuations and the risk of further earnings downgrades. Elsewhere, we are Neutral UK equities amid heightened recession worries, and Underweight Japan equities as we expect a stronger JPY to hurt corporate earnings. We are Neutral Euro area equities that continue to suffer from the impact of the Russia-Ukraine war, but the significant valuation discount is pricing in much of the bad news, in our view.
Key chart
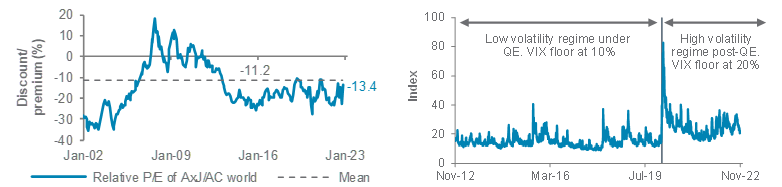
Valuation and earnings growth support Asia ex-Japan; elevated volatility amid rising recession risks in the US and Europe are likely to hurt the risk-reward for equities
Fig. 15 Asia ex-Japan cheap vs global equities; volatility is likely to be elevated vs pre-pandemic levels
Relative 12m forward P/E of MSCI Asia ex-Japan vs MSCI AC World; VIX index
Underweight global equities
We are Underweight global equities in view of a likely recession on a 12m horizon. Historically, equities bottomed only well into a recession. Fed tightening and weaker consumption are also likely to harm earnings in 2023.
Overweight Asia ex-Japan equities
We are Overweight Asia ex-Japan equities and Chinese equities within the region. In Mainland China, authorities have relaxed mobility restrictions across major cities and we expect this to continue in 2023, especially post winter. Relaxations are likely to alleviate supply chain disruptions and boost economic growth. The government also unveiled a series of measures to support the property sector, such as ensuring timely delivery of apartments and allowing re-financing through equity issuance, which opens up the possibility of the introduction of strategic investors.
Fig. 16 Chinese equities at near trough valuation vs Asia ex-Japan equities
Relative 12m forward P/E of MSCI China vs MSCI Asia ex-Japan
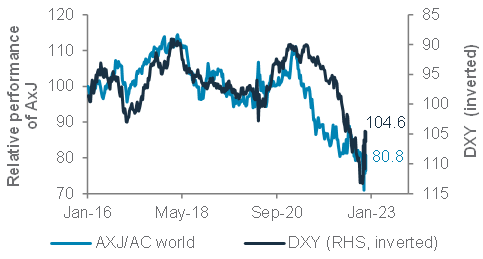
The weakening USD is likely to be a key tailwind for Asia ex-Japan equities in 2023. Over the past two years, the USD has been strong due to both a flight to safety during the pandemic and aggressive rate hikes by the Fed. With a potential stalling and reversal of Fed rate hikes in 2023, the USD is likely to weaken, in our opinion. A weaker USD has historically been correlated with Asian equity market outperformance.
Fig. 17 Weakening USD has historically been favourable for Asia ex-Japan equities
Relative performance of MSCI Asia ex-Japan index vs MSCI All-Country World index and DXY (inverted scale)
Finally, the region continues to be attractively valued. It is at a 13% P/E ratio discount to global equities, compared with the long-term average discount of 11%. Earnings growth in Asia ex-Japan is likely to be among the highest across regions in 2023.
We are Neutral on Indian equities within the region. India’s Q2 FY23 earnings beat expectations and are the strongest since 2008. However, valuations (20x 12-month forward P/E) remain elevated vs historical averages, despite some moderation from 21 October’s peak of 23x. This is also why we prefer large-cap equities over small- and mid-cap equities.
Neutral Euro area equities
We are Neutral on Euro area equities. We acknowledge that the region is still suffering from the Russia-Ukraine war and the resultant disruption in energy supplies, leading to elevated inflation. However, Euro area equities are trading at their biggest valuation discount vs the US in 40 years. Also, the EUR’s weakness over the past couple of years is likely to be positive for earnings growth.
Neutral UK equities
We are Neutral on UK equities. The recent political and economic uncertainties, with four-decade high inflation, have hurt investor and consumer confidence. However, UK equities remain inexpensive on an absolute basis and continue to trade at their biggest discount vs global equities in 20 years. We believe UK equities still offer a balance between income and growth and a dividend yield 2% higher than global equities.
Neutral US equities
We are Neutral on US equities. Consumption-driven growth is flagging, with rising auto and credit card delinquencies. Electronics and sporting goods consumption has also been slowing over the last 3-6 months. This, combined with the high likelihood of recession, is likely to impact corporate earnings. Of course, valuation has become more reasonable, with the 12-month forward P/E at 16x earnings, in line with the long-term average. Also, a likely pause in Fed hikes next year could revive growth stocks, as it alleviates the impact on discounted future earnings.
Underweight Japan equities
We are Underweight on Japan equities. Japan’s reopening is positive in supporting consumption. China’s gradual reopening should also boost exports. Valuations remain attractive on an absolute and relative basis to global equities. The risk is a further rise in inflation – which could force the BoJ to end its easy monetary policy. The strengthening JPY is also likely to slow Japan’s economic recovery by hurting exports and impacting corporate earnings.
Equity sector views
|
Stay defensive in DM
Buy the recovery in China
- We are positioned defensively in US and Europe equity sectors, in line with our cautious view on global equities due to likely recessions across Developed Markets.
- Meanwhile, the economic reopening and policy stimulus in China supports the case to buy consumption-driven sectors, such as Communication Services and Consumer Discretionary.
US
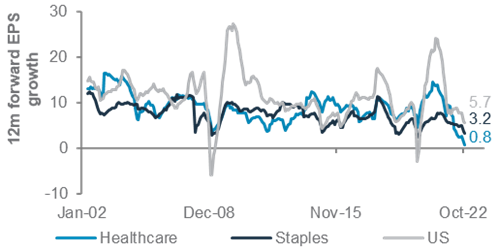
We see three sectors that are likely to outperform the broader US market. Healthcare provides defensive exposure with steady earnings growth that is less volatile than the broader market. Valuations remain reasonable. We also see margins in the sector staying resilient amid rising costs. Consumer Staples is historically a reliable outperformer heading into recessions and cyclical slowdowns. Energy remains an Overweight as valuations remain attractive, at a deep discount to the broader market. Producers’ capex and cost discipline is keeping the supply tight and generating healthy cashflows. Meanwhile, policymakers support energy security.
Other views: We are Underweight Consumer Discretionary and Industrials as they are vulnerable in a cyclical slowdown. In addition, Communication Services’ recent weak earnings has exposed concerns about growth. We are Underweight on Real Estate (listed equities) given the valuation headwind from rising interest rates. In contrast, we see US private real estate as a Neutral holding that can perform in line with US equities. It is less affected by investor liquidity flows and has greater exposure to industrial and residential assets that are buoyed by strong rental growth.
Fig. 18 Healthcare and Staples offer less volatile and positive earnings growth through the economic cycle
Consensus 12m forward EPS growth for MSCI US Healthcare, MSCI US Consumer Staples and MSCI US
Europe
We see two sectors as likely to outperform the broader market in Europe. Energy continues to offer attractive valuations and is at a deep discount to the broader market. The sector is highly cash generative and sector leaders have shown the ability to innovate and adapt to a cleaner energy portfolio. The Financial sector also offers attractive valuations. Consensus 12m forward P/E of 8.0x is at the bottom of its historical range, despite rising interest rates supporting higher interest income for banks.
Other views: We are Underweight Industrials and Discretionary due to their cyclical earnings pattern amid recession concerns. Real Estate is also Underweight due to the valuation headwind from higher interest rates.
China
We see value in two sectors that we consider a Buy. Communication Services is dominated by media and entertainment companies that we believe will benefit from China’s economic reopening, greater consumer spending and easing regulatory headwinds. We also see Consumer Discretionary as a beneficiary of the economic reopening. A domestic consumption recovery should boost e-commerce volumes and benefit online retailers in the sector.
Other views: We are Underweight Utilities as we expect the sector to lag a recovering equity market in China.
Fig. 19 Our sector views by region
FX – at a glance
|
Key themes
On a 6–12-month horizon, we turn bearish on the USD, expecting the greenback to decline c.4-5%. However, the path is unlikely to be smooth, with the USD likely to initially strengthen over the next 1-3 months for three key reasons: (i) While the Fed has slowed the pace of rate hikes at its December 2022 meeting, it has said it intends to hike rates further, at least in H1 23. As a result, the USD will continue to be supported by one of the highest real interest rates among major currencies; (ii) the risk of a colder-than-expected winter in Europe and the ongoing Russia-Ukraine conflict is likely to keep the EUR depressed over the next 1-3 months to the benefit of the USD; and (iii) safe-haven demand, given the global growth slowdown risks.
However, as we go further through 2023, we expect three factors to jointly push the USD lower: (i) A Fed pause that comes earlier than other G10 central banks and a relatively rapid decline in European inflation leading to a narrowing of real (net of inflation) interest rate differentials between the US and other G10 markets, (ii) an easing of European geopolitical uncertainties and China’s reopening likely to reduce safe-haven demand, and (iii) a correction of extreme USD over-valuation (despite the recent pullback). We expect the EUR and JPY to be key beneficiaries of a weaker USD environment. Commodity currencies (AUD, NZD and CAD) are also likely to appreciate modestly, but headwinds to commodity prices are expected to keep gains in check. We expect Asian currencies to deliver modest gains in 2023.
Key chart
Reduction in real (net of inflation) interest rate differentials, end of Fed rate hiking cycle and correction of expensive valuation (REER) to drive DXY lower in 2023
Fig. 20 Decline in real interest rate differentials and valuations to drive the USD lower
USD Index (DXY); BIS USD REER (Real Effective Exchange Rate)
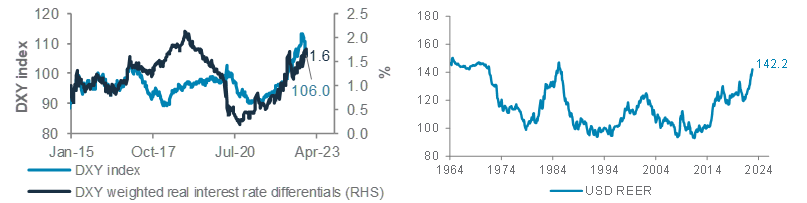
Fig. 21 Summary of major currency drivers
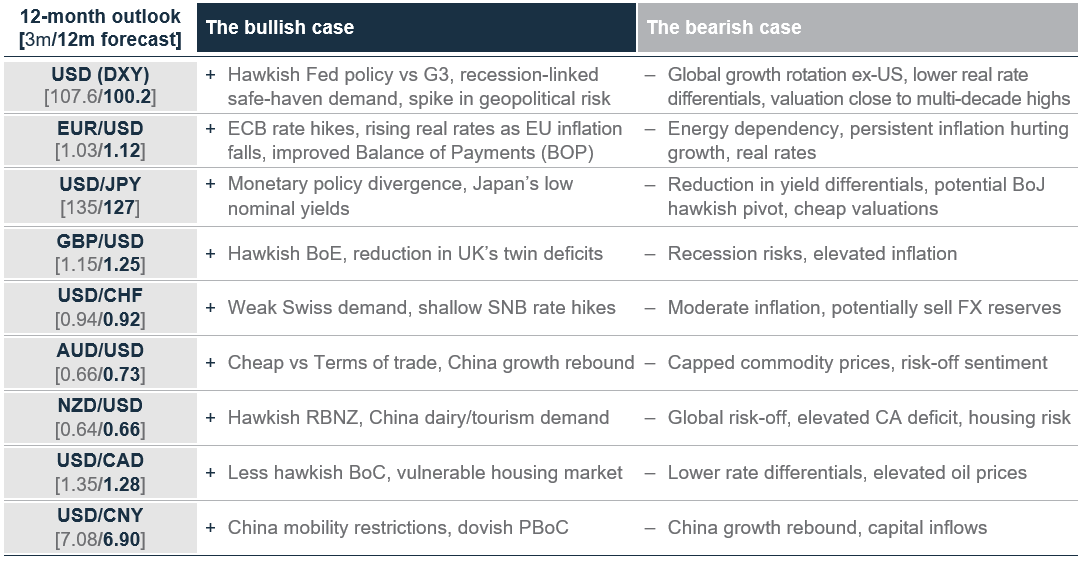
A bounce back in the EUR and JPY
We expect the EUR and JPY to be the key beneficiaries of the broad USD weakness on a 12-month horizon. However, the path is unlikely to be linear. Over the next 1-3 months, EUR/USD is likely to weaken towards the 1.00-1.03 level, as we see some consolidation of the recent rally. The recent decline in European inflation is likely to increase the risk of a less hawkish ECB. The EUR is likely to sustain an energy risk premium, heading into winter months. However, as we move through 2023, we believe (i) a reduction in geopolitical risks, (ii) an improved BOP position (due to lower energy prices), (iii) faster decline in European inflation relative to the US, leading to more favourable real rate differentials, and (iv) growth rebound in China to act as tailwinds pushing EUR/USD towards 1.10-1.12 by end 2023.
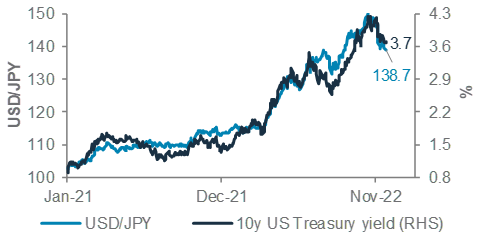
The JPY is likely to be one of the outperformers in 2023. In the near term, USD/JPY could consolidate after the recent declines, trading in the 132-135 range. On a 12-month horizon, we expect USD/JPY to decline towards 125-130, driven by lower interest rate differentials, Japan’s improved BOP position and the ongoing concerns around global growth. Additionally, any reduction in the BoJ’s current accommodative monetary policy settings, such as changes to the Yield Curve Control (YCC) policy, could act as a further tailwind pushing USD/JPY lower.
Fig. 22 Less monetary policy divergence and a decline in US bond yields to drive USD/JPY lower
USD/JPY and US 10y government bond yield
GBP/USD is likely to underperform other major G10 currencies. In the near term, the pair looks overbought after the rebound from the 2022 lows, and we see a high likelihood of a pullback towards the 1.1400-1.1790 range. On a 12-month horizon, we believe the downbeat growth outlook is likely to force the BoE to hike less than market expectations, which combined with high inflation and elevated twin deficits, are likely to cap gains around the 1.23-1.25 range.
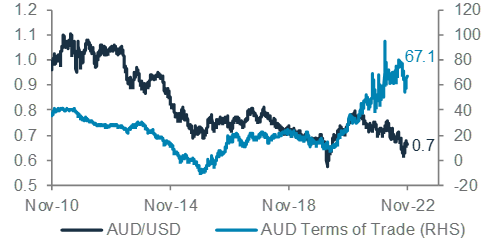
Commodity currencies (AUD, NZD, and CAD) are likely to trade rangebound over the next 1-3 months as the risk of a global growth slowdown is likely to cap commodity prices. However, as we move through 2023, the broad-based USD weakness, expected improvement in China’s growth outlook and the correction of the fundamental undervaluation based on Terms of Trade, especially for AUD/USD, are likely to enable commodity currencies to appreciate by 3-5% vs the USD.
We see a high likelihood of USD/CHF appreciation towards the 0.9400-0.9550 range over the next 1-3 months. The SNB has limited room for rate hikes due to weak domestic demand, while lower absolute bond yields are likely to mean CHF remains a favoured funding currency. On a 12-month horizon, though, we see USD/CHF declining towards a 0.90-0.92 range due to broad USD weakness and the SNB’s willingness to sell FX reserves to reduce imported inflation.
Fig. 23 Higher growth in China and catch-up with undervaluation vs Terms of Trade to support the AUD
AUD/USD and Australia’s Terms of Trade
USD/CNY is likely to move higher in the near term (3m) towards 7.05-7.10 amid risks of a slower-than-expected pace of reopening in China in the winter months. However, over the next 12 months, we expect a more broad-based relaxation of mobility restrictions and supportive fiscal and monetary policy to drive a growth rebound in 2023, pulling USD/CNY below the psychological threshold of 7.0, towards 6.90.
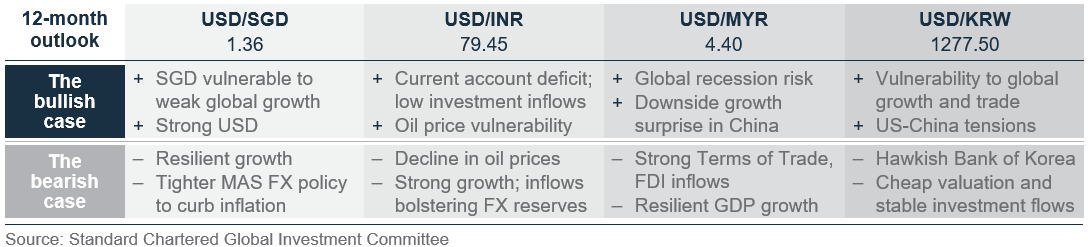
We expect USD/INR to decline only modestly towards the 77.6-79.5 range over the next 12 months. While the INR is likely to benefit from the broad USD weakness, we expect extremely strong domestic growth, especially relative to other major economies, the elevated current account deficit owing to substantial oil and gold imports and the RBI’s rebuilding of FX reserves to cap the gains.
Fig. 24 Summary of Asian currency drivers
Gold, crude oil – at a glance
|
Key themes
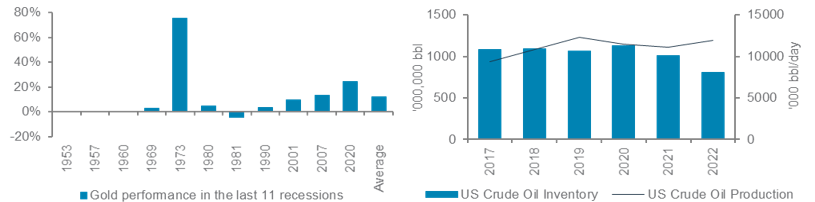
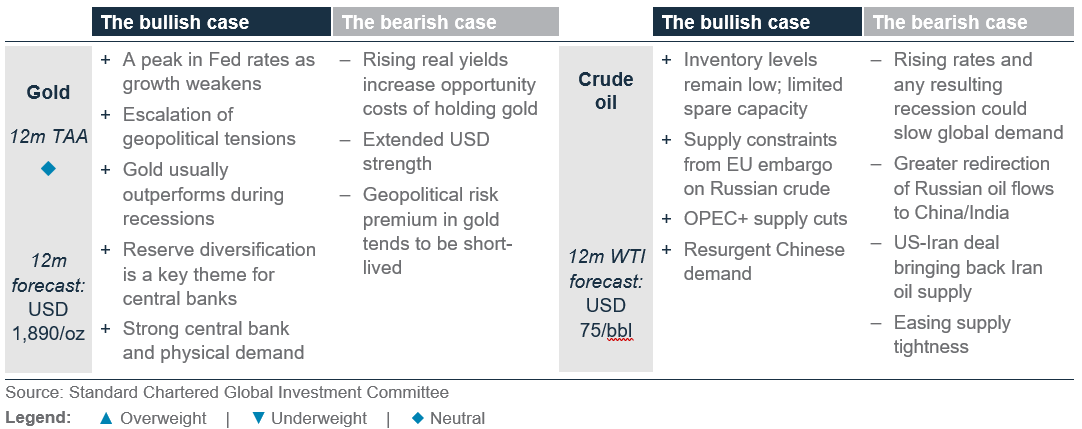
Gold shines again. We are Neutral on gold vs other major asset classes as we view it as a portfolio ballast with a 12-month forecast of USD 1,890. We expect gold to rise over the next 12 months as the Fed rate-hiking cycle pauses and the focus shifts to rate cuts amid rising recession risks. Gold has been a superior hedge in the past recessions, and it arguably retains its safe-haven properties during times of crisis. A weaker USD and central bank and physical demand are other key drivers behind our constructive view. On a three-month horizon, though, the precious metal is expected to initially remain under pressure as inflation slows ahead of nominal interest rates, keeping real (net of inflation) yields supported in Q1 23.
Oil prices are likely to stabilise. Over a 12-month horizon, we expect WTI oil to remain around USD 75/bbl as weaker oil demand from a slowing global economy is balanced by tighter-than-usual supply and upside demand risk from rising Chinese mobility. We expect OPEC+ to intervene to keep oil well-supported at its breakeven price – estimated to be c.USD 70/bbl – should global demand weaken. Over the next three months, though, prices are likely to initially rise. The EU embargo on Russian oil, Russia’s yet-unknown response and low global oil inventories combined with low producer elasticity add risks to supply. A mobility-led growth rebound in China could also front-load a rebound in its energy demand.
Key chart
Gold shines through periods of recession
The oil market reflects tight short-term supply, with falling inventories and flat production
Fig. 25 On average, gold gained c.12% during the last 11 US recessions; US crude oil inventory hits a six-year low, while production remains largely unchanged
LHS chart: Price performance of gold during the last 11 US recessions
RHS chart: US crude oil inventory and production
Quant perspective
US market risk model: Bearish equities
|
Bearish equities but bullish bonds
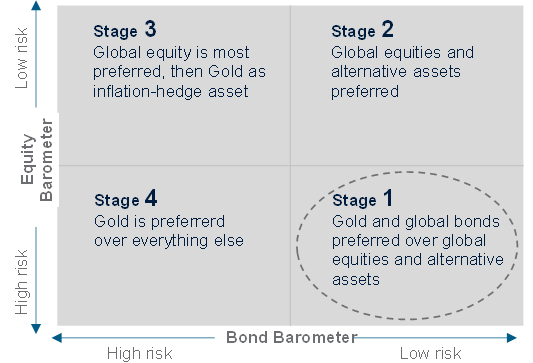
Our US Equity-Bond Market Risk (EBMR) models the downside risks in US equities and the US 10-year government bonds. It uses 11 economic and market factors to create equity and bond risk barometers. If the value of a barometer falls below 50, it signals higher downside risks and vice versa.
The model’s equity and bond barometers are indicating higher downside risks in US equities and lower downside risks in US government bonds, respectively. This is classified as Stage 1 of the US financial market risk cycle, which favours defensive assets over risky assets. The model has worked well in 2022, with the S&P500 Index down by c.14% since the model turned bearish on equities in January 2022. Our bond barometer was below 50 from August 2020 to May 2022, capturing c.2.2% rise in the US government bond yield. It moved above 50 in June 2022, suggesting that the risks of further yield spikes are reducing.
Fig. 26 EBMR bearish on equity, but bullish on bonds
US equity and bond market risk barometers
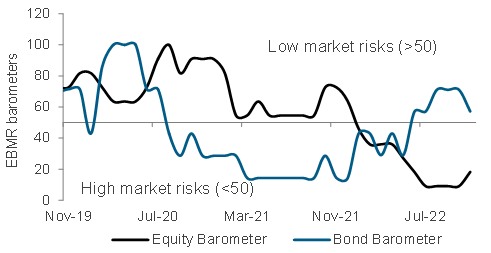
The equity barometer consists of 11 equity indicators. The barometer improved slightly this month but remains low at 18. Except for short-term equity momentum, majority of our equity indicators are still reflecting a bearish environment due to still-elevated inflation and higher bond yields. These include a slowdown in US housing starts, lower commodity prices and reduction in total monetary base. Our model projects the equity barometer is likely to remain depressed till Apr-23.
Another key input to the US EBMR model is the bond barometer, which tracks six bond indicators. It has declined slightly to 57 from 71 this month due to the recent rebound in equities. Factors that remain supportive are falling commodity prices, US PMI and US housing starts, as they indicate a slowdown in growth, which favours defensive assets such as bonds. Other factors such as US capacity utilisation and US jobless claims are also turning much less negative for the bond barometer, as the former has seemed to form a peak since the COVID-19 recovery, while the latter has been rising slowly though it remains low.
The model’s projections are currently skewed towards Stage 1 till Apr 2023, and Stage 2 thereafter. This implies May 2023 is expected to be a more attractive time to Overweight risky assets, while government bonds look increasingly attractive as we approach peak rates next year.
Implications on global assets
Data since 1999 suggest gold and bonds are the most preferred in Stage 1. The model’s preference for the assets is based on its long-term relationship with the market cycle, which favours gold and bonds as defensive assets in Stage 1.
Fig. 27 Scenarios over the coming months till April 2023 vs June 2022 projections
Probability of the evolution of financial market risk cycle from the current Stage 1 and preferred assets
The model’s estimated probabilities in June 2022
| Stage | Jul-22 | Aug-22 | Sep-22 | OCt-22 |
|---|---|---|---|---|
| 1 | 98% | 97% | 83% | 58% |
| 2 | 0% | 0% | 6% | 40% |
| 3 | 0% | 0% | 3% | 0% |
| 4 | 2% | 3% | 9% | 1% |
The model’s estimated probabilities in December 2022
| Stage | Jan-23 | Feb-23 | Mar-23 | Apr-23 |
|---|---|---|---|---|
| 1 | 99% | 99% | 99% | 85% |
| 2 | 0% | 0% | 1% | 13% |
| 3 | 0% | 3% | 0% | 1% |
| 4 | 1% | 1% | 0% | 0% |
Tracking market diversity
|
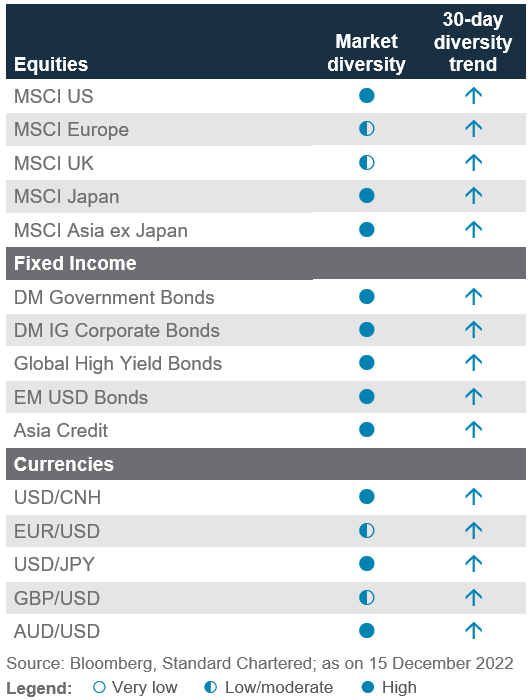
About our market diversity indicators
Our market diversity indicators help to identify a potential change in short-term trends due to a fall in market breadth across equities, credit, FX and commodities. When market diversity falls, it implies either buyers or sellers are dominating, leading to a rapid rise or fall in asset prices. This is usually unsustainable and is likely to be followed by a consolidation or a reversal. Our diversity indicator is based on a statistical index called fractal dimension; a value below 1.25 serves as a guideline that prices are rising or falling too fast.
Where is diversity falling or rising this month?
Broad market diversity has increased sharply across most asset classes after the Fed’s signal of a slower pace of rate hikes led to a relief rally in both bonds and equities. Market supply and demand are currently quite balanced, which means the market structure is currently stable and, absent any sharp change in fundamentals, market price action is likely to be relatively orderly.
Within equities, our diversity signals are above the 1.25 threshold, which is the level we typically identify with a short-term reversal opportunity. The lack of reversal signals in equities is due to the large swings in equity markets in H2 22 as our diversity indicators typically spot reversal opportunities when asset prices are trending (up or down). European and UK equities currently have lower diversity vs other markets due to their more significant rallies that started earlier in October, but our indicators are not signalling a reversal in these markets from a market breadth perspective.
Fig. 28 Investor diversity remains high
Average market diversity score by asset class
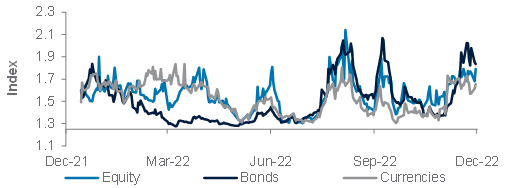
Fig. 29 Major assets not signalling a reversal
Percentage of assets with diversity score <1.25
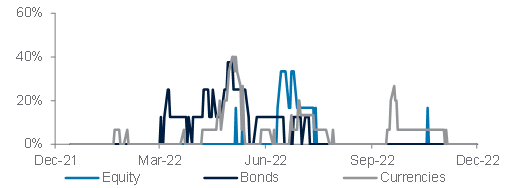
For bonds, we observed a steep rise in diversity after they staged a short-term recovery from the October lows. This follows our diversity indicators (successfully) signalling a reversal in Asia USD bonds in early November and putting DM government bonds on watch in October. Like other bond markets, the diversity of these markets has now risen above our reversal threshold.
For currencies, the recent reversal in USD strength has caused diversity across currencies to increase as well. Our indicator successfully flagged reversal risks in USD/MYR and USD/INR in October – between October and November, USD/MYR fell c.6.0%, while USD/INR fell c.1.7%.
Fig. 30 Diversity across key assets
Performance Review
Foundation: Asset allocation summary
Performance of our calls
Fig. 31 Summary of our 2022 calls
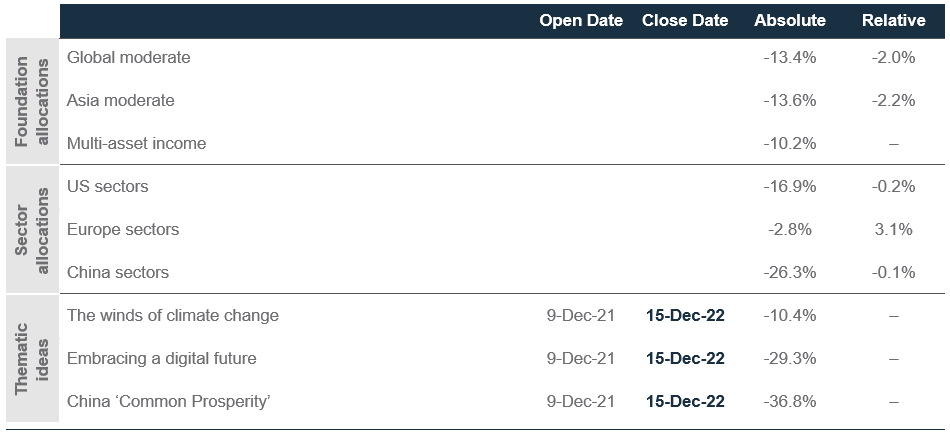
Performance measured from 9 December 2021 or when the call was opened, to 15 December 2022 or when the view was closed.
Past performance is not an indication of future performance. There is no assurance, representation or prediction given as to any results or returns that would actually be achieved in a transaction based on any historical data.
‘Absolute’ represents the simple absolute return. ‘Relative’ tracks our Tactical Asset Allocations vs. our Strategic Asset Allocation, or if a relative measure was specified in individual themes.
Global moderate and Asia moderate comprise our Tactical Asset Allocations as described in the Global Market Outlook publications. Broad asset class allocations are represented by MSCI AC World, FTSE Non-MBS WorldBIG Index, Bloomberg commodities ex-agriculture & livestock, HFRX total return and J.P. Morgan 3m cash indices. Equity allocations are represented by MSCI USA, EMU, UK, Japan, Asia ex-Japan and Other EM total return indices. Bond allocations are represented by FTSE WorldBig Government Index, FTSE WorldBig Corp Index, J.P. Morgan EMBI Global Diversified, EM Local, Asia Credit Index and Bloomberg Global High Yield indices.
Equity sector allocations are represented by MSCI USA sector indices, MSCI Europe sector indices and MSCI China sector indices, based on total returns.
In our Multi-Asset Income allocation, bond allocations are represented by Bloomberg Global High Yield Index, S&P Global Leveraged Loan Index, J.P. Morgan EMBI Global Diversified, EM Local, Asia Credit and Asia Credit Index Non- Investment Grade, FTSE WorldBig Corp Index and FTSE WorldBig Government Index. Equity allocations are represented by MSCI AC World and AC Europe High Dividend Yield Index. Non-core allocations are represented by Chicago Board Options Exchange S&P 500 BuyWrite Index, Barclays Global Contingent Capital Index Value Unhedged USD, SPDR ICE Preferred Securities ETF, FTSE EPRA/NAREIT Asia Pacific Index and FTSE EPRA/NAREIT Global Index. For indices used to measure thematic ideas, please refer to the respective thematic publications.
Market performance summary
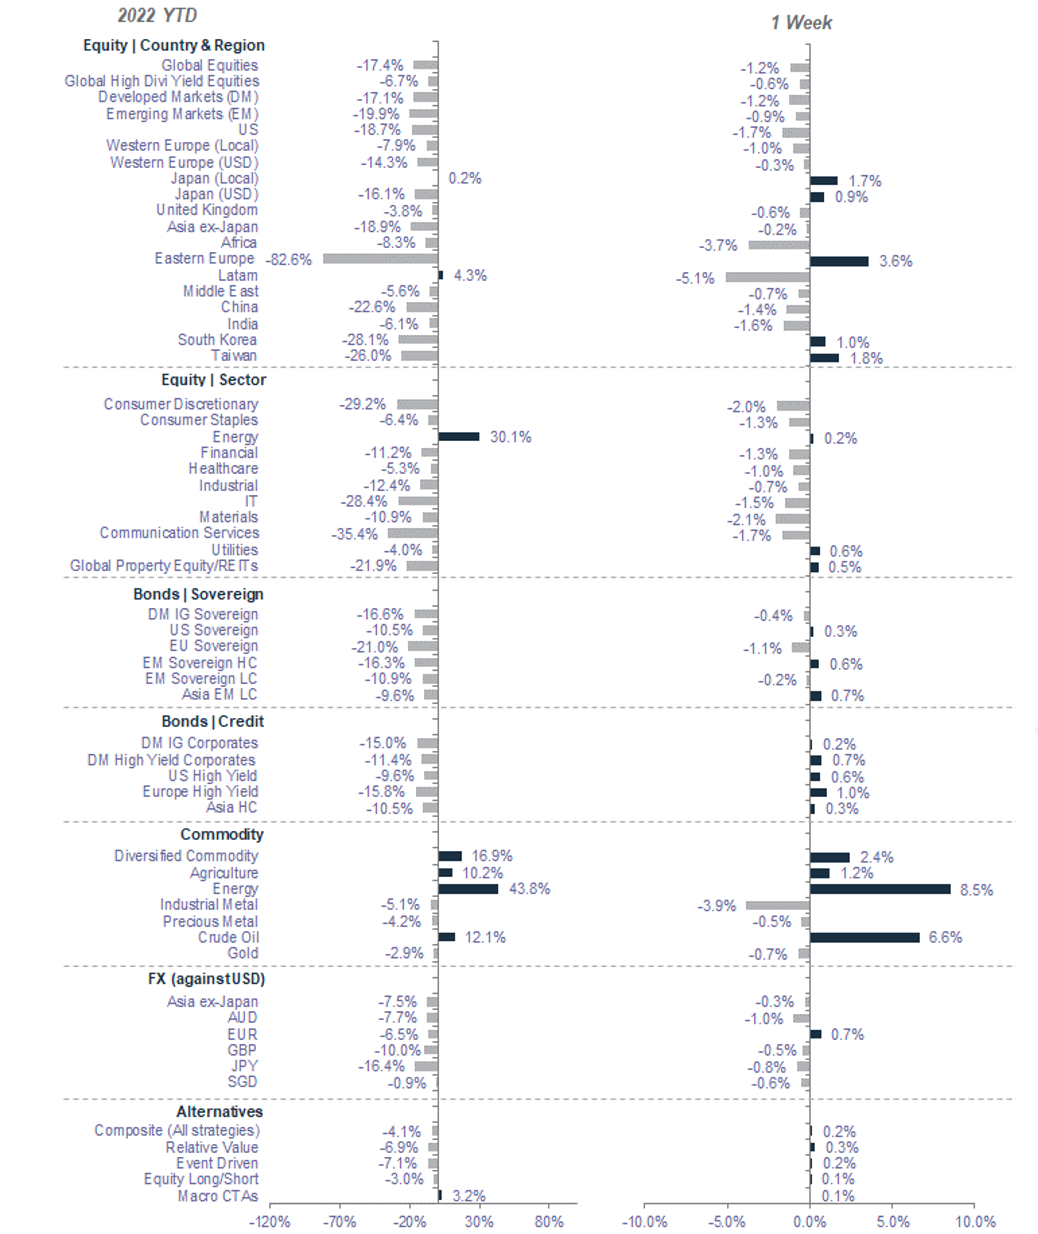
*All performance shown in USD terms, unless otherwise stated
*YTD performance data from 31 December 2021 to 15 December 2022 and 1 week-performance from 8 December 2022 to 15 December 2022
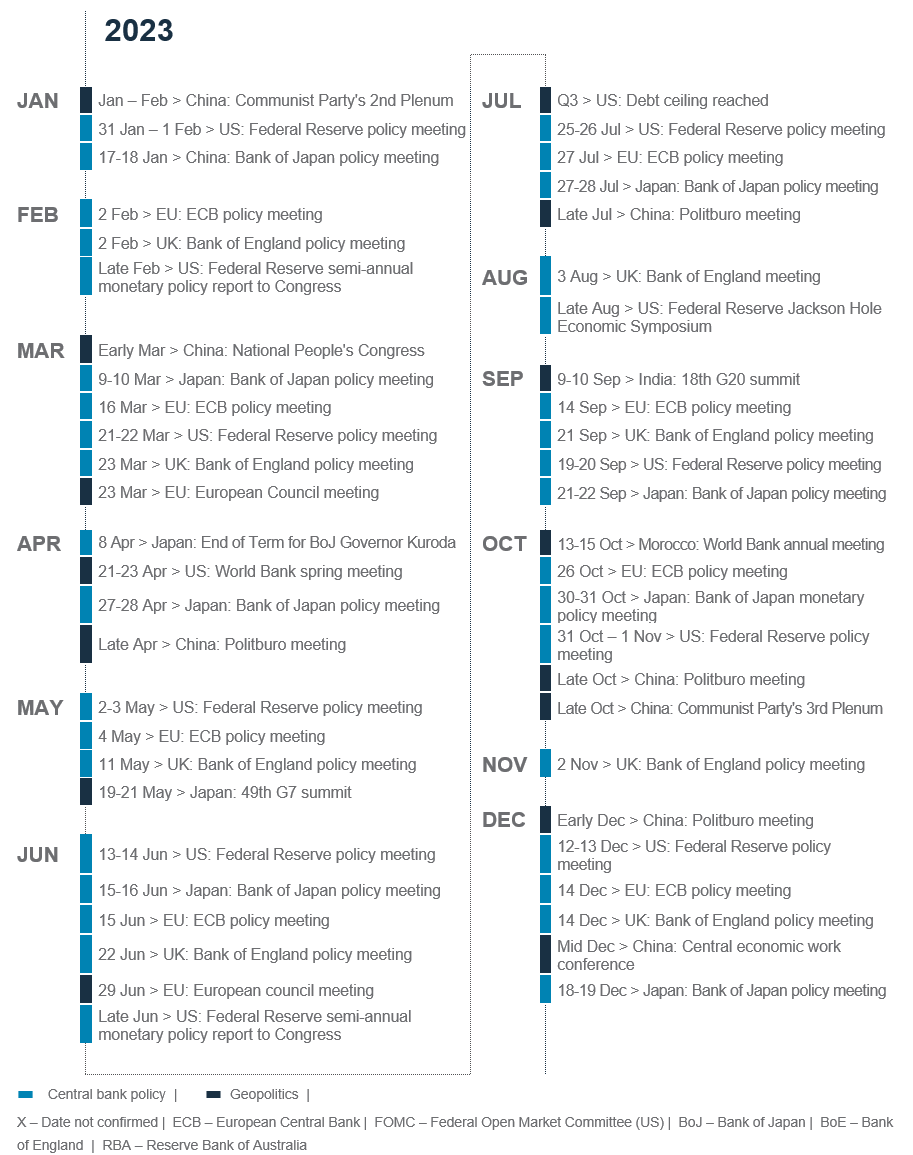
Key events
Explanatory notes
1. The figures on page 7 show allocations for a moderate risk profile only – different risk profiles may produce significantly different asset allocation results. Page 7 is only an example, provided for general information only and they do not constitute investment advice, an offer, recommendation or solicitation. They do not take into account the specific investment objectives, needs or risk tolerances of a particular person or class of persons and they have not been prepared for any particular person or class of persons.
2. Contingent Convertibles are complex financial instruments and are not a suitable or appropriate investment for all investors. This document is not an offer to sell or an invitation to buy any securities or any beneficial interests therein. Contingent convertible securities are not intended to be sold and should not be sold to retail clients in the European Economic Area (EEA) (each as defined in the Policy Statement on the Restrictions on the Retail Distribution of Regulatory Capital Instruments (Feedback to CP14/23 and Final Rules) (“Policy Statement”), read together with the Product Intervention (Contingent Convertible Instruments and Mutual Society Shares) Instrument 2015 (“Instrument”, and together with the Policy Statement, the “Permanent Marketing Restrictions”), which were published by the United Kingdom’s Financial Conduct Authority in June 2015), other than in circumstances that do not give rise to a contravention of the Permanent Marketing Restrictions.
Disclosure
This document is confidential and may also be privileged. If you are not the intended recipient, please destroy all copies and notify the sender immediately. This document is being distributed for general information only and is subject to the relevant disclaimers available at our Standard Chartered website under Regulatory disclosures. It is not and does not constitute research material, independent research, an offer, recommendation or solicitation to enter into any transaction or adopt any hedging, trading or investment strategy, in relation to any securities or other financial instruments. This document is for general evaluation only. It does not take into account the specific investment objectives, financial situation or particular needs of any particular person or class of persons and it has not been prepared for any particular person or class of persons. You should not rely on any contents of this document in making any investment decisions. Before making any investment, you should carefully read the relevant offering documents and seek independent legal, tax and regulatory advice. In particular, we recommend you to seek advice regarding the suitability of the investment product, taking into account your specific investment objectives, financial situation or particular needs, before you make a commitment to purchase the investment product. Opinions, projections and estimates are solely those of SC at the date of this document and subject to change without notice. Past performance is not indicative of future results and no representation or warranty is made regarding future performance. The value of investments, and the income from them, can go down as well as up, and you may not recover the amount of your original investment. You are not certain to make a profit and may lose money. Any forecast contained herein as to likely future movements in rates or prices or likely future events or occurrences constitutes an opinion only and is not indicative of actual future movements in rates or prices or actual future events or occurrences (as the case may be). This document must not be forwarded or otherwise made available to any other person without the express written consent of the Standard Chartered Group (as defined below). Standard Chartered Bank is incorporated in England with limited liability by Royal Charter 1853 Reference Number ZC18. The Principal Office of the Company is situated in England at 1 Basinghall Avenue, London, EC2V 5DD. Standard Chartered Bank is authorised by the Prudential Regulation Authority and regulated by the Financial Conduct Authority and Prudential Regulation Authority. Standard Chartered PLC, the ultimate parent company of Standard Chartered Bank, together with its subsidiaries and affiliates (including each branch or representative office), form the Standard Chartered Group. Standard Chartered Private Bank is the private banking division of Standard Chartered. Private banking activities may be carried out internationally by different legal entities and affiliates within the Standard Chartered Group (each an “SC Group Entity”) according to local regulatory requirements. Not all products and services are provided by all branches, subsidiaries and affiliates within the Standard Chartered Group. Some of the SC Group Entities only act as representatives of Standard Chartered Private Bank and may not be able to offer products and services or offer advice to clients.
Copyright © 2025, Accounting Research & Analytics, LLC d/b/a CFRA (and its affiliates, as applicable). Reproduction of content provided by CFRA in any form is prohibited except with the prior written permission of CFRA. CFRA content is not investment advice and a reference to or observation concerning a security or investment provided in the CFRA SERVICES is not a recommendation to buy, sell or hold such investment or security or make any other investment decisions. The CFRA content contains opinions of CFRA based upon publicly-available information that CFRA believes to be reliable and the opinions are subject to change without notice. This analysis has not been submitted to, nor received approval from, the United States Securities and Exchange Commission or any other regulatory body. While CFRA exercised due care in compiling this analysis, CFRA, ITS THIRD-PARTY SUPPLIERS, AND ALL RELATED ENTITIES SPECIFICALLY DISCLAIM ALL WARRANTIES, EXPRESS OR IMPLIED, INCLUDING, BUT NOT LIMITED TO, ANY WARRANTIES OF MERCHANTABILITY OR FITNESS FOR A PARTICULAR PURPOSE OR USE, to the full extent permitted by law, regarding the accuracy, completeness, or usefulness of this information and assumes no liability with respect to the consequences of relying on this information for investment or other purposes. No content provided by CFRA (including ratings, credit-related analyses and data, valuations, model, software or other application or output therefrom) or any part thereof may be modified, reverse engineered, reproduced or distributed in any form by any means, or stored in a database or retrieval system, without the prior written permission of CFRA, and such content shall not be used for any unlawful or unauthorized purposes. CFRA and any third-party providers, as well as their directors, officers, shareholders, employees or agents do not guarantee the accuracy, completeness, timeliness or availability of such content. In no event shall CFRA, its affiliates, or their third-party suppliers be liable for any direct, indirect, special, or consequential damages, costs, expenses, legal fees, or losses (including lost income or lost profit and opportunity costs) in connection with a subscriber’s, subscriber’s customer’s, or other’s use of CFRA’s content.
Market Abuse Regulation (MAR) Disclaimer
Banking activities may be carried out internationally by different branches, subsidiaries and affiliates within the Standard Chartered Group according to local regulatory requirements. Opinions may contain outright “buy”, “sell”, “hold” or other opinions. The time horizon of this opinion is dependent on prevailing market conditions and there is no planned frequency for updates to the opinion. This opinion is not independent of Standard Chartered Group’s trading strategies or positions. Standard Chartered Group and/or its affiliates or its respective officers, directors, employee benefit programmes or employees, including persons involved in the preparation or issuance of this document may at any time, to the extent permitted by applicable law and/or regulation, be long or short any securities or financial instruments referred to in this document or have material interest in any such securities or related investments. Therefore, it is possible, and you should assume, that Standard Chartered Group has a material interest in one or more of the financial instruments mentioned herein. Please refer to our Standard Chartered website under Regulatory disclosures for more detailed disclosures, including past opinions/ recommendations in the last 12 months and conflict of interests, as well as disclaimers. A covering strategist may have a financial interest in the debt or equity securities of this company/issuer. All covering strategist are licensed to provide investment recommendations under Monetary Authority of Singapore or Hong Kong Monetary Authority. This document must not be forwarded or otherwise made available to any other person without the express written consent of Standard Chartered Group.
Sustainable Investments
Any ESG data used or referred to has been provided by Morningstar, Sustainalytics, MSCI or Bloomberg. Refer to 1) Morningstar website under Sustainable Investing, 2) Sustainalytics website under ESG Risk Ratings, 3) MCSI website under ESG Business Involvement Screening Research and 4) Bloomberg green, social & sustainability bonds guide for more information. The ESG data is as at the date of publication based on data provided, is for informational purpose only and is not warranted to be complete, timely, accurate or suitable for a particular purpose, and it may be subject to change. Sustainable Investments (SI): This refers to funds that have been classified as ‘Sustainable Investments’ by Morningstar. SI funds have explicitly stated in their prospectus and regulatory filings that they either incorporate ESG factors into the investment process or have a thematic focus on the environment, gender diversity, low carbon, renewable energy, water or community development. For equity, it refers to shares/stocks issued by companies with Sustainalytics ESG Risk Rating of Low/Negligible. For bonds, it refers to debt instruments issued by issuers with Sustainalytics ESG Risk Rating of Low/Negligible, and/or those being certified green, social, sustainable bonds by Bloomberg. For structured products, it refers to products that are issued by any issuer who has a Sustainable Finance framework that aligns with Standard Chartered’s Green and Sustainable Product Framework, with underlying assets that are part of the Sustainable Investment universe or separately approved by Standard Chartered’s Sustainable Finance Governance Committee. Sustainalytics ESG risk ratings shown are factual and are not an indicator that the product is classified or marketed as “green”, “sustainable” or similar under any particular classification system or framework.
Country/Market Specific Disclosures
Botswana: This document is being distributed in Botswana by, and is attributable to, Standard Chartered Bank Botswana Limited which is a financial institution licensed under the Section 6 of the Banking Act CAP 46.04 and is listed in the Botswana Stock Exchange. Brunei Darussalam: This document is being distributed in Brunei Darussalam by, and is attributable to, Standard Chartered Bank (Brunei Branch) | Registration Number RFC/61 and Standard Chartered Securities (B) Sdn Bhd | Registration Number RC20001003. Standard Chartered Bank is incorporated in England with limited liability by Royal Charter 1853 Reference Number ZC18. Standard Chartered Securities (B) Sdn Bhd is a limited liability company registered with the Registry of Companies with Registration Number RC20001003 and licensed by Brunei Darussalam Central Bank as a Capital Markets Service License Holder with License Number BDCB/R/CMU/S3-CL and it is authorised to conduct Islamic investment business through an Islamic window. China Mainland: This document is being distributed in China by, and is attributable to, Standard Chartered Bank (China) Limited which is mainly regulated by National Financial Regulatory Administration (NFRA), State Administration of Foreign Exchange (SAFE), and People’s Bank of China (PBOC). Hong Kong: In Hong Kong, this document, except for any portion advising on or facilitating any decision on futures contracts trading, is distributed by Standard Chartered Bank (Hong Kong) Limited (“SCBHK”), a subsidiary of Standard Chartered PLC. SCBHK has its registered address at 32/F, Standard Chartered Bank Building, 4-4A Des Voeux Road Central, Hong Kong and is regulated by the Hong Kong Monetary Authority and registered with the Securities and Futures Commission (“SFC”) to carry on Type 1 (dealing in securities), Type 4 (advising on securities), Type 6 (advising on corporate finance) and Type 9 (asset management) regulated activity under the Securities and Futures Ordinance (Cap. 571) (“SFO”) (CE No. AJI614). The contents of this document have not been reviewed by any regulatory authority in Hong Kong and you are advised to exercise caution in relation to any offer set out herein. If you are in doubt about any of the contents of this document, you should obtain independent professional advice. Any product named herein may not be offered or sold in Hong Kong by means of any document at any time other than to “professional investors” as defined in the SFO and any rules made under that ordinance. In addition, this document may not be issued or possessed for the purposes of issue, whether in Hong Kong or elsewhere, and any interests may not be disposed of, to any person unless such person is outside Hong Kong or is a “professional investor” as defined in the SFO and any rules made under that ordinance, or as otherwise may be permitted by that ordinance. In Hong Kong, Standard Chartered Private Bank is the private banking division of SCBHK, a subsidiary of Standard Chartered PLC. Ghana: Standard Chartered Bank Ghana Limited accepts no liability and will not be liable for any loss or damage arising directly or indirectly (including special, incidental or consequential loss or damage) from your use of these documents. Past performance is not indicative of future results and no representation or warranty is made regarding future performance. You should seek advice from a financial adviser on the suitability of an investment for you, taking into account these factors before making a commitment to invest in an investment. To unsubscribe from receiving further updates, please send an email to feedback.ghana@sc.com. Please do not reply to this email. Call our Priority Banking on 0302610750 for any questions or service queries. You are advised not to send any confidential and/or important information to Standard Chartered via e-mail, as Standard Chartered makes no representations or warranties as to the security or accuracy of any information transmitted via e-mail. Standard Chartered shall not be responsible for any loss or damage suffered by you arising from your decision to use e-mail to communicate with the Bank. India: This document is being distributed in India by Standard Chartered in its capacity as a distributor of mutual funds and referrer of any other third party financial products. Standard Chartered does not offer any ‘Investment Advice’ as defined in the Securities and Exchange Board of India (Investment Advisers) Regulations, 2013 or otherwise. Services/products related securities business offered by Standard Charted are not intended for any person, who is a resident of any jurisdiction, the laws of which imposes prohibition on soliciting the securities business in that jurisdiction without going through the registration requirements and/or prohibit the use of any information contained in this document. Indonesia: This document is being distributed in Indonesia by Standard Chartered Bank, Indonesia branch, which is a financial institution licensed and supervised by Otoritas Jasa Keuangan (Financial Service Authority) and Bank Indonesia. Jersey: In Jersey, Standard Chartered Private Bank is the Registered Business Name of the Jersey Branch of Standard Chartered Bank. The Jersey Branch of Standard Chartered Bank is regulated by the Jersey Financial Services Commission. Copies of the latest audited accounts of Standard Chartered Bank are available from its principal place of business in Jersey: PO Box 80, 15 Castle Street, St Helier, Jersey JE4 8PT. Standard Chartered Bank is incorporated in England with limited liability by Royal Charter in 1853 Reference Number ZC 18. The Principal Office of the Company is situated in England at 1 Basinghall Avenue, London, EC2V 5DD. Standard Chartered Bank is authorised by the Prudential Regulation Authority and regulated by the Financial Conduct Authority and Prudential Regulation Authority. The Jersey Branch of Standard Chartered Bank is also an authorised financial services provider under license number 44946 issued by the Financial Sector Conduct Authority of the Republic of South Africa. Jersey is not part of the United Kingdom and all business transacted with Standard Chartered Bank, Jersey Branch and other SC Group Entity outside of the United Kingdom, are not subject to some or any of the investor protection and compensation schemes available under United Kingdom law. Kenya: This document is being distributed in Kenya by and is attributable to Standard Chartered Bank Kenya Limited. Investment Products and Services are distributed by Standard Chartered Investment Services Limited, a wholly owned subsidiary of Standard Chartered Bank Kenya Limited that is licensed by the Capital Markets Authority in Kenya, as a Fund Manager. Standard Chartered Bank Kenya Limited is regulated by the Central Bank of Kenya. Malaysia: This document is being distributed in Malaysia by Standard Chartered Bank Malaysia Berhad (“SCBMB”). Recipients in Malaysia should contact SCBMB in relation to any matters arising from, or in connection with, this document. This document has not been reviewed by the Securities Commission Malaysia. The product lodgement, registration, submission or approval by the Securities Commission of Malaysia does not amount to nor indicate recommendation or endorsement of the product, service or promotional activity. Investment products are not deposits and are not obligations of, not guaranteed by, and not protected by SCBMB or any of the affiliates or subsidiaries, or by Perbadanan Insurans Deposit Malaysia, any government or insurance agency. Investment products are subject to investment risks, including the possible loss of the principal amount invested. SCBMB expressly disclaim any liability and responsibility for any loss arising directly or indirectly (including special, incidental or consequential loss or damage) arising from the financial losses of the Investment Products due to market condition. Nigeria: This document is being distributed in Nigeria by Standard Chartered Bank Nigeria Limited (SCB Nigeria), a bank duly licensed and regulated by the Central Bank of Nigeria. SCB Nigeria accepts no liability for any loss or damage arising directly or indirectly (including special, incidental or consequential loss or damage) from your use of these documents. You should seek advice from a financial adviser on the suitability of an investment for you, taking into account these factors before making a commitment to invest in an investment. To unsubscribe from receiving further updates, please send an email to clientcare.ng@sc.com requesting to be removed from our mailing list. Please do not reply to this email. Call our Priority Banking on 02 012772514 for any questions or service queries. SCB Nigeria shall not be responsible for any loss or damage arising from your decision to send confidential and/or important information to Standard Chartered via e-mail. SCB Nigeria makes no representations or warranties as to the security or accuracy of any information transmitted via e-mail. Pakistan: This document is being distributed in Pakistan by, and attributable to Standard Chartered Bank (Pakistan) Limited having its registered office at PO Box 5556, I.I Chundrigar Road Karachi, which is a banking company registered with State Bank of Pakistan under Banking Companies Ordinance 1962 and is also having licensed issued by Securities & Exchange Commission of Pakistan for Security Advisors. Standard Chartered Bank (Pakistan) Limited acts as a distributor of mutual funds and referrer of other third-party financial products. Singapore: This document is being distributed in Singapore by, and is attributable to, Standard Chartered Bank (Singapore) Limited (Registration No. 201224747C/ GST Group Registration No. MR-8500053-0, “SCBSL”). Recipients in Singapore should contact SCBSL in relation to any matters arising from, or in connection with, this document. SCBSL is an indirect wholly owned subsidiary of Standard Chartered Bank and is licensed to conduct banking business in Singapore under the Singapore Banking Act, 1970. Standard Chartered Private Bank is the private banking division of SCBSL. IN RELATION TO ANY SECURITY OR SECURITIES-BASED DERIVATIVES CONTRACT REFERRED TO IN THIS DOCUMENT, THIS DOCUMENT, TOGETHER WITH THE ISSUER DOCUMENTATION, SHALL BE DEEMED AN INFORMATION MEMORANDUM (AS DEFINED IN SECTION 275 OF THE SECURITIES AND FUTURES ACT, 2001 (“SFA”)). THIS DOCUMENT IS INTENDED FOR DISTRIBUTION TO ACCREDITED INVESTORS, AS DEFINED IN SECTION 4A(1)(a) OF THE SFA, OR ON THE BASIS THAT THE SECURITY OR SECURITIES-BASED DERIVATIVES CONTRACT MAY ONLY BE ACQUIRED AT A CONSIDERATION OF NOT LESS THAN S$200,000 (OR ITS EQUIVALENT IN A FOREIGN CURRENCY) FOR EACH TRANSACTION. Further, in relation to any security or securities-based derivatives contract, neither this document nor the Issuer Documentation has been registered as a prospectus with the Monetary Authority of Singapore under the SFA. Accordingly, this document and any other document or material in connection with the offer or sale, or invitation for subscription or purchase, of the product may not be circulated or distributed, nor may the product be offered or sold, or be made the subject of an invitation for subscription or purchase, whether directly or indirectly, to persons other than a relevant person pursuant to section 275(1) of the SFA, or any person pursuant to section 275(1A) of the SFA, and in accordance with the conditions specified in section 275 of the SFA, or pursuant to, and in accordance with the conditions of, any other applicable provision of the SFA. In relation to any collective investment schemes referred to in this document, this document is for general information purposes only and is not an offering document or prospectus (as defined in the SFA). This document is not, nor is it intended to be (i) an offer or solicitation of an offer to buy or sell any capital markets product; or (ii) an advertisement of an offer or intended offer of any capital markets product. Deposit Insurance Scheme: Singapore dollar deposits of non-bank depositors are insured by the Singapore Deposit Insurance Corporation, for up to S$100,000 in aggregate per depositor per Scheme member by law. Foreign currency deposits, dual currency investments, structured deposits and other investment products are not insured. This advertisement has not been reviewed by the Monetary Authority of Singapore. Taiwan: SC Group Entity or Standard Chartered Bank (Taiwan) Limited (“SCB (Taiwan)”) may be involved in the financial instruments contained herein or other related financial instruments. The author of this document may have discussed the information contained herein with other employees or agents of SC or SCB (Taiwan). The author and the above-mentioned employees of SC or SCB (Taiwan) may have taken related actions in respect of the information involved (including communication with customers of SC or SCB (Taiwan) as to the information contained herein). The opinions contained in this document may change, or differ from the opinions of employees of SC or SCB (Taiwan). SC and SCB (Taiwan) will not provide any notice of any changes to or differences between the above-mentioned opinions. This document may cover companies with which SC or SCB (Taiwan) seeks to do business at times and issuers of financial instruments. Therefore, investors should understand that the information contained herein may serve as specific purposes as a result of conflict of interests of SC or SCB (Taiwan). SC, SCB (Taiwan), the employees (including those who have discussions with the author) or customers of SC or SCB (Taiwan) may have an interest in the products, related financial instruments or related derivative financial products contained herein; invest in those products at various prices and on different market conditions; have different or conflicting interests in those products. The potential impacts include market makers’ related activities, such as dealing, investment, acting as agents, or performing financial or consulting services in relation to any of the products referred to in this document. UAE: DIFC – Standard Chartered Bank is incorporated in England with limited liability by Royal Charter 1853 Reference Number ZC18.The Principal Office of the Company is situated in England at 1 Basinghall Avenue, London, EC2V 5DD. Standard Chartered Bank is authorised by the Prudential Regulation Authority and regulated by the Financial Conduct Authority and Prudential Regulation Authority. Standard Chartered Bank, Dubai International Financial Centre having its offices at Dubai International Financial Centre, Building 1, Gate Precinct, P.O. Box 999, Dubai, UAE is a branch of Standard Chartered Bank and is regulated by the Dubai Financial Services Authority (“DFSA”). This document is intended for use only by Professional Clients and is not directed at Retail Clients as defined by the DFSA Rulebook. In the DIFC we are authorised to provide financial services only to clients who qualify as Professional Clients and Market Counterparties and not to Retail Clients. As a Professional Client you will not be given the higher retail client protection and compensation rights and if you use your right to be classified as a Retail Client we will be unable to provide financial services and products to you as we do not hold the required license to undertake such activities. For Islamic transactions, we are acting under the supervision of our Shariah Supervisory Committee. Relevant information on our Shariah Supervisory Committee is currently available on the Standard Chartered Bank website in the Islamic banking section. For residents of the UAE – Standard Chartered Bank UAE does not provide financial analysis or consultation services in or into the UAE within the meaning of UAE Securities and Commodities Authority Decision No. 48/r of 2008 concerning financial consultation and financial analysis. Uganda: Our Investment products and services are distributed by Standard Chartered Bank Uganda Limited, which is licensed by the Capital Markets Authority as an investment adviser. United Kingdom: In the UK, Standard Chartered Bank is authorised by the Prudential Regulation Authority and regulated by the Financial Conduct Authority and Prudential Regulation Authority. This communication has been approved by Standard Chartered Bank for the purposes of Section 21 (2) (b) of the United Kingdom’s Financial Services and Markets Act 2000 (“FSMA”) as amended in 2010 and 2012 only. Standard Chartered Bank (trading as Standard Chartered Private Bank) is also an authorised financial services provider (license number 45747) in terms of the South African Financial Advisory and Intermediary Services Act, 2002. The Materials have not been prepared in accordance with UK legal requirements designed to promote the independence of investment research, and that it is not subject to any prohibition on dealing ahead of the dissemination of investment research. Vietnam: This document is being distributed in Vietnam by, and is attributable to, Standard Chartered Bank (Vietnam) Limited which is mainly regulated by State Bank of Vietnam (SBV). Recipients in Vietnam should contact Standard Chartered Bank (Vietnam) Limited for any queries regarding any content of this document. Zambia: This document is distributed by Standard Chartered Bank Zambia Plc, a company incorporated in Zambia and registered as a commercial bank and licensed by the Bank of Zambia under the Banking and Financial Services Act Chapter 387 of the Laws of Zambia.