19 June 2026
Outlook H2 2026
Navigating shifting sands
Investors will have to navigate shifting sands across energy prices, equity supply, investor positioning and central bank policy in H2 2026. We expect risky assets to remain supported amid a soft-landing macro environment.
We remain Overweight global equities, with a preference for the US and Asia ex-Japan. US equities remain supported by earnings and lower oil prices following the US-Iran interim deal, which should also catalyse Asia ex-Japan equities.
Bond yields are attractive for locking in income; we are Overweight Emerging Market USD bonds. We are also Overweight Gold, our preferred diversifier, alongside core holdings in other major alternative strategies.
What does US-Iran interim deal mean for oil markets?
Are global central banks overly hawkish?
How are our quant models positioned?
Strategy
Investment strategy and key themes
|
|
||||
|

12m Foundation Overweights:
- Global equities, gold
- US, Asia ex-Japan^ equities
- Emerging Market USD
Opportunistic ideas – Equities
- Global: MSCI World equal-weight, high dividend^
- US: Communication services^
- Asia: Hang Seng Technology Index, Japan banks^
Top Global Sectors:
- US: Technology, communication services, healthcare
- Europe ex-UK: Financials, industrials^
- Japan: Financials^
- China: Technology, communication services
Opportunistic ideas – Bonds
- US: Treasury Inflation-protected Securities (TIPS), AAA CLOs, utility sector hybrids, US High-yield (HY)^
- EU: Bank AT1s FX-hedged
- Others: AUD corporates
^New
A fragile equilibrium
- Investors will have to navigate shifting sands across energy prices, equity supply, investor positioning and central bank policy in H2 2026. We expect risky assets to remain supported amid a soft-landing macro environment.
- We remain Overweight global equities, with a preference for the US and Asia ex-Japan (AxJ). US equities remain supported by earnings and lower oil prices following the US-Iran interim peace deal, which should also catalyse AxJ equities.
- Bond yields are attractive for locking in income; we are Overweight Emerging Market (EM) USD bonds. We are also Overweight gold, our preferred diversifier, alongside core holdings in other major alternative strategies.
The shifting sands to navigate
Global equities have gained over 12% year to date (YTD). Equities pushed higher as AI optimism and strong earnings growth outweighed the Middle East conflict, higher oil prices and bond yields, and a stronger US dollar (USD). We see room for this optimism to extend in H2 2026. However, we believe investors will need to be nimbler in H2 and be prepared to navigate market volatility centred on four key pivot points:
1. Energy prices
The US-Iran interim deal offers room for optimism, as an early reopening of the Strait of Hormuz will unlock oil and gas supply. However, we are mindful that (i) the agreement remains an interim one, rather than permanent, and (ii) the actual supply will take weeks, or even months, to fully resume, with some damaged facilities taking potentially years to fully resume output. Meanwhile, many countries will be keen to look for opportunities to rebuild reserves, thereby supporting demand. This is why we expect oil prices to soften, but not return to pre-crisis levels.
2. Equity supply
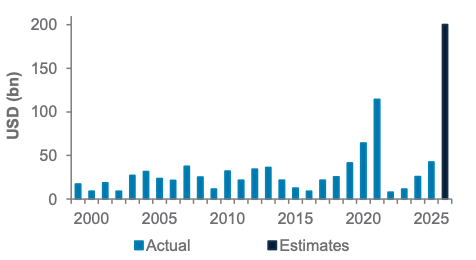
A significant US equity initial public offering (IPO) pipeline raises the risk of both short-term over-supply and a long-term reversal of the trend of shrinking outstanding equity floats supporting prices. Having said that, the completion of one large IPO without market disruption is encouraging, and strong IPO pipelines have not held back the performance of major non-US markets in recent years.
Fig. 1 A significant US equity IPO pipeline raises the risk of short-term over-supply
US IPO proceeds raised by year
3. Investor positioning
We enter H2 with relatively optimistic investor positioning. While this has started to ease, the risk of a modest pullback in the coming weeks remains elevated. However, our 1-3-month equity models and reversal indicators remain positive, encouraging us to buy any temporary dips.
4. Central bank policy
An easing of oil and gas prices should help alleviate pressure on central banks to tighten policy. However, further strength in the US job market risks limiting the room for Fed rate cuts. We expect the US Fed to stay on hold through year-end 2026. The ECB and EM central banks should face less pressure to tighten policy as oil prices ease, but the BoJ is expected to continue hiking slowly.
Overall, we continue to expect our soft-landing macro scenario to persist, with a small chance of a strong growth re-acceleration. Recession and stagflation scenarios remain risks, but softer energy prices following the US-Iran interim deal reduce the risk of these scenarios playing out.
Extending equities optimism
We remain Overweight global equities relative to bonds and cash. Within this, we stay Overweight the US and raise AxJ to Overweight.
Earnings remain central to our positive view, particularly for US equities. Strong earnings growth helped support markets through H1 2026, despite many challenges. We expect this to ultimately be the case in H2 as well. However, (i) we expect the path to be more volatile, with still-optimistic investor positioning and the IPO supply pipeline being short-term challenges, and (ii) further broadening of the rally beyond semiconductors likely needed for gains to be sustainable.
Our approach to US equities remains unchanged – we remain Overweight, and we look for routes to broaden exposure within technology (from semiconductors to internet and software sub-sectors) and beyond technology (we are Overweight US communication services and healthcare).
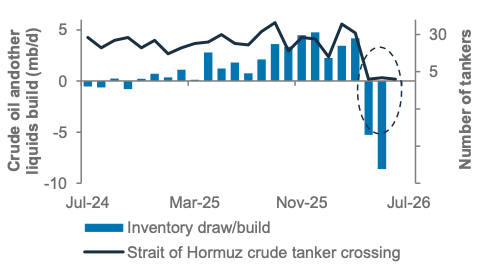
Fig. 2 A resumption of Hormuz strait transit would stem global oil inventory drawdown
Global crude oil inventory changes and Hormuz strait transit
We also raise AxJ back to Overweight. The US-Iran interim deal is one key catalyst behind our upgrade, given regional markets remain highly sensitive to oil prices. Within the region, we are Overweight on (i) India, which should benefit the most from reduced oil price risks, (ii) China, which is sensitive to energy prices but should also benefit from the equities broadening trade – we like the China technology and communication services sectors – and (iii) Taiwan.
EM bonds lead yield opportunities
The current level of bond yields offers several opportunities to lock in attractive yields. An interim US-Iran deal means we expect US bond yields to ease modestly from current levels, with the benchmark 10-year yield expected to stay in the 4.25-4.50% range over the next 3-12 months. This should also help the USD Index (DXY) move lower from recent range highs.
We remain Overweight EM USD government bonds. This is our preferred opportunity, given its attractive yields, low sensitivity to big shifts in commodity prices relative to major EM assets and the lack of direct FX risk, unlike local-currency (LCY) bonds. However, we hold a preference for corporate and EM bonds over government bonds, with Investment-grade (IG) and US High-yield (HY) corporate bonds as core holdings.
Alternatives stay valuable diversifiers
We remain Overweight gold. The US-Iran interim deal will likely remove near-term clouds stemming from concerns about gold sales from individual EM central banks and the return of correlation with US bond yields and the USD. In our view, long-term diversification demand from EM central banks remains intact as a long-term positive driver of gold prices. Gold also remains an attractive hedge against some downside scenarios such as stagflation.
More broadly, we continue to see a core holding to liquid and private alternative strategies as attractive in the context of building portfolio diversifiers, both in our more adverse macro scenarios and amid any short-lived market volatility in H2.
Foundation asset allocation models
The Foundation and Foundation+ models are allocations that you can use as the starting point for building a diversified investment portfolio. The Foundation model showcases a set of allocations focusing on traditional asset classes that are accessible to most investors, while the Foundation+ model includes allocations to private assets that may be accessible to investors in some jurisdictions, but not others.
Fig. 3 Foundation asset allocation for a balanced risk profile
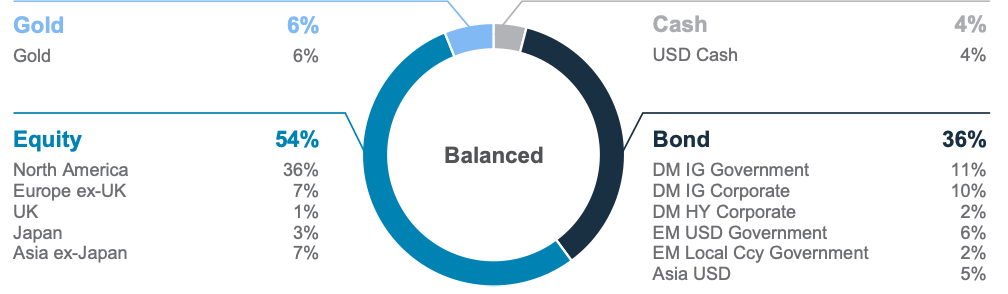
Fig. 4 Foundation+ asset allocation for a balanced risk profile
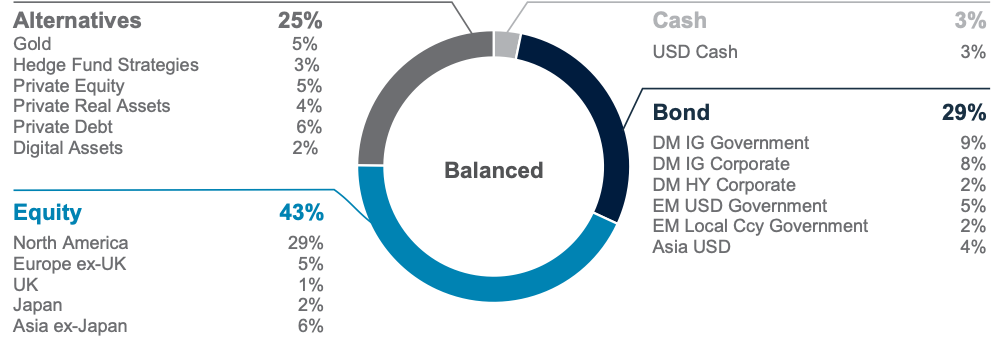
Fig. 5 Multi-asset income allocation for a moderate risk profile
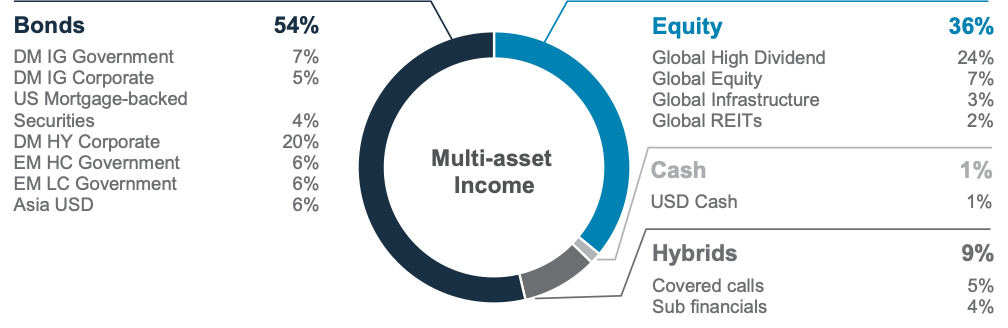
Source: Standard Chartered
Foundation: Our tactical asset allocation views

Fig. 6 Performance of our Foundation Allocations*
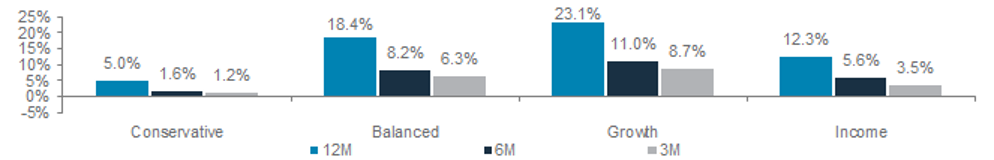
Source: Bloomberg, Standard Chartered; *12-month performance data from 17 June 2025 to 17 June 2026, 6-month performance from 17 December 2025 to 17 June 2026, 3-month performance from 17 March 2026 to 17 June 2026
Fig. 7 Opportunistic ideas performance

Perspectives on key client questions
|
|
|
Oil markets: US-Iran interim deal relief, recovery still ahead
The recent US-Iran interim deal and oil price retreat have reduced the acute geopolitical risk premium and created a more supportive backdrop for risk assets. This will help investors refocus on growth opportunities, especially in markets and sectors that benefit from lower energy costs, easing inflation pressure and resilient earnings momentum.
However, it is worth noting that a ceasefire is not the same as full normalisation. The key question has shifted from whether a de-escalation headline can lower oil prices to whether physical oil flows, inventories and refined product markets can normalise quickly enough to sustain the relief. The positive case is a fast recovery in flows; the risk case is a ceasefire that holds politically but disappoints physically.
Fig. 8 Scenario implications for oil markets and portfolios


Why has the oil shock been more contained than anticipated?
The muted oil price response to the Middle East conflict and oil supply disruptions should not be mistaken for evidence that the supply shock was small; rather, it reflects a combination of macro and market buffers that softened the initial impact.
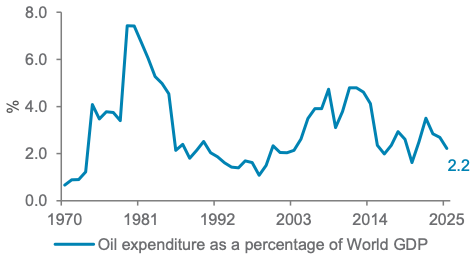
First, the economic impact of an oil shock is less extreme in real terms. Even before the recent oil price retreat, Brent near USD 100/bbl was not the same shock as USD 100/bbl in earlier cycles. Adjusted for inflation, today’s oil price rise is less extreme, and energy costs absorb a smaller share of income than in previous cycles.
Second, the global economy is less oil-intensive. Economies now use less oil to produce each unit of output, reflecting decades of efficiency gains and changes in global growth’s structure. The world is still exposed to oil, especially through petrochemicals and logistics, but the transmission from oil prices to inflation and growth is weaker than in past energy crises.
Fig. 9 Oil remains less burdensome than in past shocks
Estimated oil expenditure as a share of global GDP
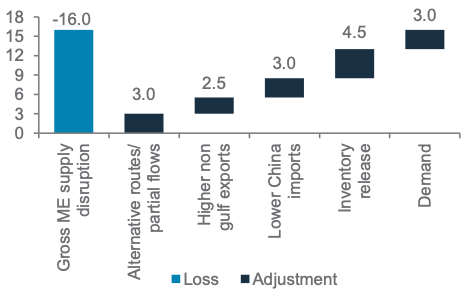
Third, markets had buffers – and used them. The oil market entered the Middle East conflict with a more comfortable demand-supply balance, including a modest pre-conflict surplus, elevated inventories and high oil-on-water. Strategic and commercial stock draws helped bridge the supply gap, while lower Chinese imports reduced competition for available seaborne barrels. Market psychology also helped; repeated signs of diplomatic progress reinforced the belief that the disruption would prove temporary, allowing the geopolitical risk premium to fall after the US-Iran interim deal.
Fig. 10 Temporary buffers helped contain the shock
Our assessment of offsets to the oil supply disruption, mb/d
Would the US-Iran interim deal immediately normalise oil markets?
The interim deal has moved the oil market from a disruption phase to a recovery phase, but physivcal normalisation still matters. Inventories have bought time, but not immunity: observed global crude and product inventories have fallen since early March. Those barrels may need to be rebuilt once flows resume, which could keep prices supported even after the geopolitical risk premium fades. Reopening the Strait of Hormuz is a process, not a switch. Shipping lanes need to be assessed, mines need to be cleared, insurers need confidence to provide cover, tankers need to be repositioned, and some shut-in fields may require workovers before output fully recovers. A fast recovery would
support further price easing, but a slow recovery could leave prices higher than the ceasefire headline alone suggests.
Fig. 11 Oil remains less burdensome than in past shocks
Our assessment of market estimates for the restoration of global supply
What does this mean for portfolios?
The US-Iran interim deal lowers the risk of a severe, oil-driven inflation shock, which is positive for risk assets. However, investors should avoid treating the oil retreat as the end of the story. The key portfolio risk has shifted from acute geopolitical escalation to the pace of physical normalisation and inventory rebuilding.
For equities, this supports selectivity rather than broad de-risking. Oil-importing regions and energy-intensive sectors may benefit from lower prices, but a slow recovery in physical flows or renewed product-market tightness could still pressure margins and consumption.
For bonds, the immediate inflation scare has eased, but duration risk has not disappeared. If oil or refined-product prices remain sticky, long-maturity bonds could remain vulnerable to renewed inflation concerns.
Gold and selected alternatives remain useful hedges if geopolitical stress re-emerges or normalisation disappoints.
Bottom line: The US-Iran interim deal lowers the tail risk, but it does not remove the need for balance. Investors should stay diversified across regions and sectors, avoid excessive duration risk and retain hedges against a more persistent inflation shock.

Macro overview – at a glance
Our macroeconomic outlook and key questions
|
Key themes
Core scenario (soft landing, 60% probability): The US-Iran interim deal to restart shipping through the Strait of Hormuz within weeks should help global economies achieve a soft landing and keep long-term inflation expectations subdued, reducing the need for central banks to tighten policy as much as markets are pricing. We now expect the Fed, under Chair Warsh, to cut rates by 25bps by H1 2027, instead of this year, as focus turns to supporting growth. The ECB is likely to hold rates after delivering an ‘insurance’ hike in June, while China eases policy to revive domestic demand. The BoJ is likely to hike once more this year.
Downside risk (20% probability): This tail risk scenario incorporates a 10% chance of a recession, potentially caused by a delayed restart of Hormuz shipping, a stock market downturn hurting investor confidence or a bond sell-off due to inflation or debt concerns. We also assign a 10% probability to a stagflation scenario if the Middle East crisis resumes and oil prices rebound.
Upside risk (no landing, 20% probability): If the Hormuz strait is reopened in a few weeks, there is a chance that US tax cuts, AI investments, the wealth effect from a booming stock market, fiscal easing in Germany and Japan, and a potential rollback of US tariffs could revive ‘animal spirits’. A Russia-Ukraine peace deal or a global defence spending boom would lift global growth.
Key chart
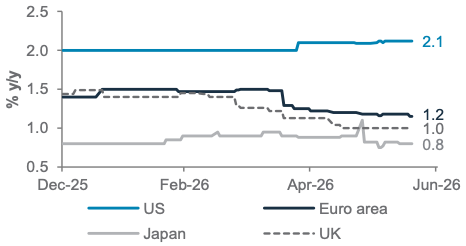
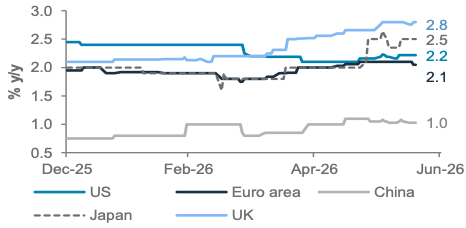
We now expect the Fed to cut its policy rate by 25bpsin H1 2027, instead of this year, as near-term inflation gradually eases towards target by mid-2027; ECB likely to hold rates and BoJto hike by 25bps by Q4 2026.
Fig. 12 Markets appear overly hawkish on policy rates as inflation concerns peak
Expected change in Expected change in policy rates by June 2027; US one- and five-year inflation estimates^

Policy rates watch
Fed to hold rates this year, cut by 25bps in H1 2027: The US economy is holding up better than feared, with consensus Q2 2026 growth tracking at ~2.2% q/q SAAR. Full-year 2026 growth is broadly expected to average ~2.1%, supported by robust AI-related capital expenditure (capex) and a recovering labour market. Payrolls in May beat consensus for the third straight month, with unemployment steady at 4.3%. A restart of shipping through the Hormuz strait should ease gasoline prices, relieving pressure on consumers, while AI-related investments and defence spending lift manufacturing.
Inflation remains the dominant macro concern. April core PCE inflation rose to 3.3% y/y, its highest since late 2023, driven by energy prices, tariff pass-through and an emerging ‘tech-flation’ impulse from AI-related software costs. We believe the US-Iran interim deal should lead to a peak in headline inflation in Q2, along with oil prices. Core PCE inflation is likely to ease towards 2% by end-2027 as tariff and energy effects fade.
Against this backdrop, the Fed is likely to remain on hold through 2026-end, with the June meeting removing its easing bias. We have pushed back our expectations for the next rate cut to H1 2027. This contrasts with market pricing of almost 48bps of hikes by June 2027. New Fed Chair Warsh faces an increasingly hawkish committee, with nine out of 18 policymakers expecting rate hikes this year. However, we expect Warsh to point to subdued long-term inflation expectations to argue for holding rates for now. A reversal of energy-driven inflation in the coming months should bolster the case for rate cuts by the middle of next year.
ECB to hold rates after June’s ‘insurance’ hike: The Euro area is navigating a stagflationary headwind. Consensus 2026 real GDP growth estimates have fallen 50bps to just 0.7%, since the start of the year, while inflation estimates have risen, reflecting elevated energy prices stemming from the Strait of Hormuz disruption. Q1 GDP growth contracted 0.2% q/q, and consensus estimate for Q2 growth remains weak at 0.1% q/q.
The base case remains of weak-but-positive growth, with recession risks concentrated in France and Germany rather than the broader Euro area. Nevertheless, Germany’s fiscal impulse provides a partial offset.
The consensus headline inflation estimate for 2026 has surged 110bps to 2.9%, driven overwhelmingly by the energy shock. With the latest US-Iran interim deal, we expect inflation to peak in H2 H2H2 2026 before a gradual moderation. Second-round effects remain a key risk, though we view them as limited, given looser labour markets and moderating wage trackers.
The weak growth outlook and lack of wage pressures lead us to believe that the ECB is likely to hold is policy rate for the rest of the year after hiking once to 2.25% in June. The risk of another rate hike this year will rise if wage data picks up or if there is a delay in the normalisation of shipping through the Hormuz strait. However, the ECB will be conscious of its ill-timed 2011 tightening ahead of the European financial crisis.
China to provide targeted policy support as growth slows. China’s growth trajectory remains a tale of two halves. After a stronger-than-expected Q1 2026, momentum has visibly softened. Consensus growth estimates for H2 2026 have been revised down. The drag is concentrated in domestic demand, with retail sales, fixed asset investment and the property sector all contracting in May. Exports and industrial production remain the brightest spots, growing 19.4% y/y and 4.5% y/y, respectively, in May, supported by the global AI investment cycle and green transition demand. However, forward-looking PMI data signals that export momentum may fade, with export orders slipping below 50.
China’s inflation picture is bifurcated. Producer inflation has surged from -1.9% in December 2025 to +3.9% in May 2026, driven by global commodity prices – particularly oil – and AI-related supply dynamics. However, the pass-through to consumer prices remains weak. Consumer inflation is likely to remain subdued as domestic demand stays soft. Policy settings had turned more cautious following strong Q1 growth. Fiscal spending growth turned sharply negative in April (-7% y/y), though a rebound in H2 is expected as the government accelerates bond issuance and project approvals
to support investment and revive growth momentum. The aggregate fiscal deficit is likely to reach close to 9% of GDP, with longer-term risks flagged around local government debt sustainability. On monetary policy, the PBoC is expected to hold its 7-day Reverse Repo rate at 1.4% through year-end 2026. Instead, the central bank is likely to further cut bank reserve requirements and rely on targeted liquidity tools in H2 to support priority sectors, while managing ample system liquidity generated by China’s large trade surplus.
BoJ to hike policy rate another 25bps to 1.25% by December: Japan’s economy has strengthened sufficiently to support continued policy normalisation. Real GDP expanded at an annualised 1.8% in Q1 2026, marking a second straight quarter of growth. The recovery is underpinned by resilient business investment — machine tool orders surged 37% y/y in May, driven by automation and AI infrastructure spending. While private consumption remains a positive contributor, household spending patterns suggest the transmission from wage gains to broader demand remains gradual.
Inflation dynamics are increasingly resembling a self-sustaining wage-price cycle. Japan’s 2026 Shunto wage negotiations delivered an average wage settlement of 5.3%, a third consecutive year above 5%, with small and medium enterprises joining in. Although headline inflation has moderated to 1.5% y/y in May due to government utility subsidies, the BoJ’s preferred measure – CPI ex-fresh food and institutional factors – firmed to 2.8% y/y, the highest in six months. Elevated oil prices are being passed on to consumer prices, raising the risk of core inflation staying above target.
The BoJ raised its policy rate in June by 25bps to 1.00%, the highest since 1995, in a 7-1 vote, with Deputy Governor Uchida reaffirming commitment to further hikes. We expect another 25bps hike in H2 2026, with rising risk of a follow-up hike in H1 2027. Meanwhile, the BoJ decided to stop tapering government bond purchases from April 2027, stabilising monthly government bond buying at ~JPY 2trn. However, fiscal risks loom as the government mulls a food sales tax cut in FY27, which could lift the 10-year government bond yield above the government’s 3% budgetary assumption, complicating the BoJ’s policy normalisation path.
Fig. 13 US economic growth likely to outperform peers’
Consensus GDP growth estimates for Q2 2027
Source: Bloomberg, Standard Chartered
Fig. 14 US inflation likely to return near target by 2027
Consensus inflation estimates for Q2 2027
Asset classes
Fixed Income – at a glance
|
|
||||
|
|
||||
Our view
Foundation: We are Underweight fixed income. Within the asset class, we maintain an Overweight stance on EM USD bonds and an Underweight stance on DM government bonds. We expect the Fed to keep rates higher for longer before eventually easing as labour market weakness takes centre stage, despite easing Middle East tensions amid a US-Iran interim peace deal announcement. Further work is needed to fully reopen the Strait of Hormuz, and the truce could still change, given past experience. Against this backdrop, we expect USD strength to persist in the near term, with EM foreign exchange becoming a headwind to returns. This leads us to downgrade EM LCY government bonds to Neutral (Core holding) from Overweight. DM IG and HY are both Core holdings, as corporate bonds continue to offer carry, although there is limited room for further spread compression. Corporate fundamentals remain resilient, with stable leverage and strong interest coverage, supporting our preference for credit over rates.
Opportunistic ideas: We are bullish European bank additional tier-1 (AT1) bonds (contingent convertibles [CoCos1]; FX-hedged), US TIPS, AAA-rated collateralised loan obligations (CLOs), US utilities corporate hybrids and AUD corporate bonds. We have closed the short-duration US HY bonds idea and replaced it with a new bullish idea on broader US HY bonds.
Key charts
Fig. 15 Summary of rate forecasts

DM rates – Underweight
We are Underweight DM IG government bonds. In the US, persistent above-target inflation continues to reinforce our view that the term premium is set to remain structurally elevated, compounded by a growing fiscal burden and a still fluid situation in the Middle East. The share of price-sensitive investors in the free float of government debt has been rising, and if this momentum continues, supply-demand dynamics will exert further upward pressure on term premia. Against this backdrop, we set our three- and 12-month view for the 10-year US government bond yield at 4.25-4.50%. For the 2-year yield, we target 4.00-4.25% over three months and 3.75-4.00% over 12 months, as we push expectations for a Fed interest rate cut into H1 2027, with the Fed likely to gradually shift its focus towards emerging labour market weakness, which should affect the shorter end of the US yield curve.
This eventual policy pivot means we expect the US yield curve to transition to a steepening dynamic over the 12-month horizon, as the front end rallies in anticipation of Fed cuts while
the longer end remains under pressure amid fiscal supply concerns. Within this context, and as the shorter end of the US government bond yield curve has already bear-flattened, we are moving our bond positioning to the 3-5-year tenor from the previous 5-7-year tenor. We remain Underweight long-dated maturities, where the combination of fiscal risk, a higher term premium and limited duration demand continues to weigh.
The Euro area and Japan face a more challenging inflation backdrop driven by elevated energy prices, given their status as large commodity importers. Euro-area economic data has been weakening, and we now expect the ECB to hold rates after its ‘insurance hike’ in June before eventually cutting policy rates in H1 2027 as economic conditions deteriorate further.
The BoJ is expected to continue its tightening path, but it is still deemed to be behind the curve. We expect further upward pressure on Japan government bond yields and expect Japanese government bonds to underperform US government bonds on an FX-hedged basis.
DM corporates – Core holding
We maintain a Neutral allocation to both DM IG and DM HY corporate bonds, with a slight relative preference for HY over IG. We are expressing this slight preference with a new Opportunistic bullish idea on broad US HY bonds, while closing the short-duration US HY bonds. While we acknowledge there is limited room for spreads to compress materially from current levels – especially with US IG index spreads around 75bps – we expect dispersion to increase from here.
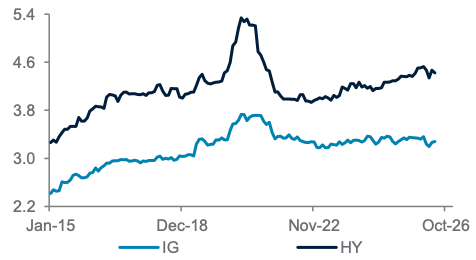
Fig. 16 DM IG corporate spreads tightened back towards the lows
Bloomberg Global Agg Corp index, OAS
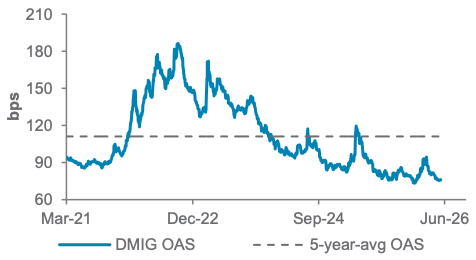
Fig. 17 DM HY corporate spreads retraced back to the lows since the Middle East conflict
Bloomberg Global HY Corp Index, option-adjusted spread (OAS)
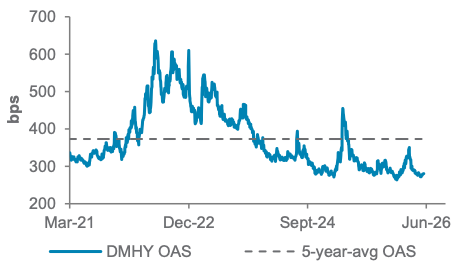
As an income proposition, HY remains supported by all-in yields in the 6%+ range and broadly benign default expectations. The HY index has also seen an increasing share of BB-rated credits, suggesting that credit quality within the index continues to improve. HY fund flows have also rebounded meaningfully since April, providing a constructive technical backdrop.
On the IG side, spreads remain tight. AI capex-driven issuance has reached elevated levels, with 2026 US IG gross issuance tracking towards ~USD 1.8trn. Recent new issues have come with fewer concessions, leading to some secondary underperformance post-issuance, particularly in the tech sector. However, the bonds have generally been well-absorbed by resilient demand, including strong foreign inflows
and retail exchange-traded fund (ETF) buying, supported by the attractiveness of still-elevated overall yields.
Tight valuation is also supported by corporate fundamentals across both IG and HY, which remain resilient, underpinned by solid profitability, stable credit metrics, and a positive ratings watch/outlook balance. Bonds on a positive watch are now at their highest level since October 2025.
Fig. 18 Both HY and IG corporate leverage ratios have remained relatively stable
Gross debt to EBITDA, Bloomberg US Corporate Investment Grade and High Yield Bond Index
EM government bonds – Overweight USD/Core holding for LCY
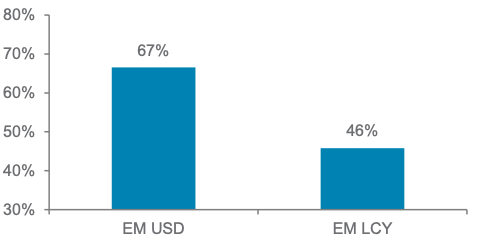
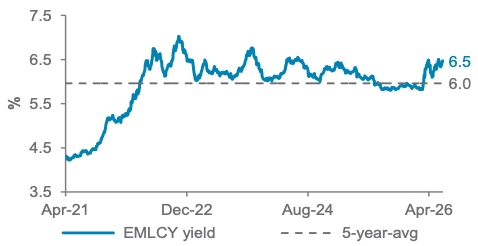
We retain a constructive but more selective view on EM fixed income relative to DM, supported by compelling carry and a broadly supportive macro backdrop. The asset class continues to benefit from resilient external positions and improving fiscal dynamics in select markets. However, we have made an allocation shift: we retain a small Overweight in EM USD government bonds, where income remains the dominant driver of returns, while downgrading EM LCY government bonds to Neutral (Core holding) from Overweight. The EM USD Government Bond Index has a higher proportion of oil exporters compared with the EM LCY government bond index, which is more dominated by energy importers. With energy risks subsiding but still lingering, we expect the less exposed EM USD government bonds in the EM space to outperform.
Fig. 19 EM USD Index has a higher proportion of non-oil importing countries than EM LCY
Weight of non-oil importing countries in Bloomberg EM USD and LCY government bond indices
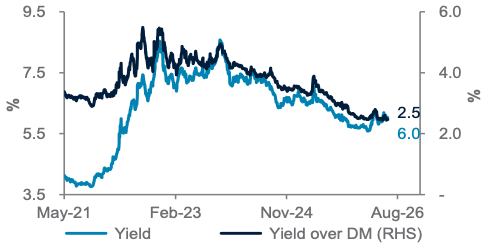
The key pillars supporting our EM USD view include a Fed on hold through 2026 before cutting in H1 2027 (not yet priced by markets), stronger EM fiscal and external balances and attractive carry. We continue to favour sovereigns with resilient external accounts and supportive terms of trade, particularly oil exporters in Latin America and select African producers.
Fig. 20 EM USD yields still offer 2%-plus pick-up over DM yields
Bloomberg EM USD Government Bond Index, yield to worst, and yield over the Bloomberg Global Treasury Index
EM LCY government bonds now have a Neutral allocation in our portfolios, reflecting our view that US policy rates will stay higher for longer, supporting a relatively stronger USD in the near term and potentially negatively affecting the asset class returns through EM FX. Within EM local currency, while high real yields and improving central bank credibility remain supportive in select markets, near-term headwinds from oil-driven inflation, rate-hike cycles
in certain EM countries and currency volatility across commodity-importing countries – together with these countries’ higher weight in the index – warrant a less bullish stance. We prefer higher-carry markets and remain more selective on lower-yielding segments in Asia.
Fig. 21 EM LCY headline yields remain attractive, but headwinds from EM FX have returned
Bloomberg EM LCY Government Bond Index, yield to worst
We retain a Neutral allocation to Asia USD bonds, which continue to offer attractive nominal yields, favourable supply-demand dynamics and strong credit fundamentals, backed by healthy cashflows, low leverage and a high share of sovereign-linked issuers. Asia USD credit has demonstrated notable resilience YTD, delivering positive total returns and modest spread tightening vs. US government bonds, and outperforming both US IG and Asia local currency bonds. We believe this relative resilience can persist, as Asia USD debt does not face the same currency headwinds that are weighing on local currency markets across the region.

Equity – at a glance
|
|
||||
|
|
||||
Our view
We remain Overweight global equities. Our core scenario for a restart of shipping through the Strait of Hormuz within weeks is positive for risk sentiment and the earnings outlook. Earnings growth has remained robust through the Middle East conflict, and we expect this to continue supporting global equities. We are Overweight US equities, where we see earnings growth revised up for future quarters in 2026-27. We upgrade AxJ equities to Overweight as a reopening of the Hormuz strait would ease energy supply into the region. We expect AxJ to continue to benefit from strong AI capex.
Within AxJ, we retain our diversified preference. We are Overweight Taiwan for AI-related semiconductor growth, Overweight China for the valuation re-rating potential and Overweight India for domestically driven growth, amid reduced oil concerns.
We have a Core allocation to Japan and Europe ex-UK, where fiscal expansion plans support the growth outlook. We remain Underweight UK equities, which have relatively muted earnings growth with low exposure to growth sectors.
Key chart
US and AxJ equities are buoyed by AI-driven earnings.

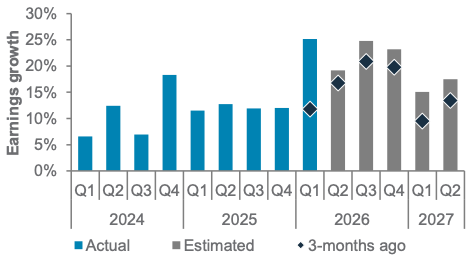
Fig. 22 AxJ and US equities are leading in terms of earnings growth; positive returns YTD 2026 are driven by earnings, while valuations have fallen
Consensus 2026 and 2027 earnings growth estimates for MSCI equity indices; composition of returns YTD 2026 for MSCI equity indices


US equities – Overweight
We remain Overweight US equities, where earnings have been robust through the Middle East crisis. Companies are running lean and adopting AI, with the technology sector leading in earnings growth. Although the rise of “other income” – driven by the revaluation of equity stakes – is causing a deterioration in earnings quality, we remain comfortable with further upside in US equities from broadening earnings growth and reasonable valuations. We also expect a wave of large IPOs in the US to drive near-term volatility as index inclusion and liquidity reallocations take place around the IPOs. Over the longer term, however, fundamentals remain the key driver.
Fig. 23 US equities have seen earnings growth revised higher for future quarters in 2026-27
MSCI US actual and consensus earnings growth (y/y)
AxJ equities – Overweight
Our core scenario for a reopening of the Hormuz strait within a few weeks is a positive driver for our upgrade of AxJ, which relies heavily on energy supply from the Middle East. AxJ has seen the highest earnings growth in 2026-27 among the major equity markets, as it benefits from strong AI capex and a strong presence in semiconductor manufacturing. An easing of energy and other supply chain bottlenecks would enable the continuation of growth in AxJ.
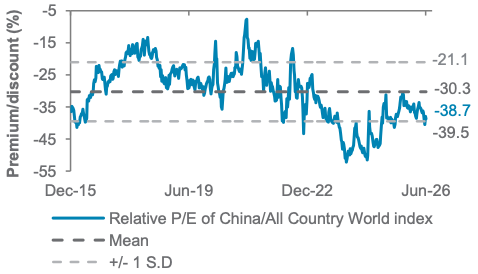
Within AxJ, our Overweight markets of Taiwan, China and India reflect a diversified preference. Taiwan benefits from its strong capabilities in semiconductor manufacturing, with structural volume growth underpinning earnings growth. China continues to be attractively valued, as tech innovation there keeps up with AI developments – China’s 15th Five-year Plan explicitly targets AI integration. China’s successful shift towards renewable energy in recent years with ample energy capacity gives it an advantage in the AI race, where data centres tend to be power hungry. India offers attractive mid-teens earnings growth, which is less correlated to the AI theme and driven by domestic factors. A reopening of the Hormuz strait would improve the growth outlook for India.
South Korea equities remain a core holding for us. Although we are positive on earnings growth driven by the memory chips industry there, we view the pricing-driven earnings growth as less desirable than volume-driven growth.
Fig. 24 China equities remain attractively valued amid tech innovation and AI developments
Relative 12-month forward P/E ratio of MSCI China vs. MSCI All Country World index
We are Underweight ASEAN, which has relatively muted earnings growth. The region lacks exposure to the technology sector, which we believe would cause it to lag the tech-heavy AxJ market.
Japan equities – Core holding
As an oil importer, Japan would also benefit from a reopening of the Hormuz strait. Fiscal support for strategic investments is also positive for the growth outlook and the resumption of nominal growth after decades of disinflation supports cost pass through and higher profits. Rising rates in Japan could, however, lead to a stronger Japanese yen (JPY) over the next 12 months, a headwind for exporters.
Europe ex-UK equities – Core holding
Europe ex-UK benefits from fiscal stimulus plans, particularly in Germany. Easing regulations have also led to a rise of M&A activity, which is supportive of equity valuations. We see a broadening of earnings growth, although it still lags the growth in the US and AxJ.
UK equities – Underweight
The UK has a defensive composition that is likely to underperform the more growth-oriented regions, such as the US and AxJ. Fiscal uncertainty and weak consumer sentiment is also likely to weigh on the economy and the GBP, making returns less attractive for USD-based investors.
Equity opportunistic views
|
|
||||
|
|
||||
Add global high-dividend, US communication services and Japan banks ideas
- We initiate an Opportunistic idea on global high-dividend stocks. This strategy delivers reliable income to navigate volatility. With equity risk premiums remaining compressed, income yield provides a critical return cushion. Furthermore, a heavy weighting in cyclical and defensive sectors, such as financials and utilities, ensures downside protection.
- We initiate an Opportunistic idea on US communication services, with the recent correction providing an attractive entry point. A fundamental recovery in digital ad spending and increasing AI monetisation are driving momentum. These catalysts justify accelerating capex and offer valuation re-rating potential, as current valuations remain reasonable vs. their five-year average.
- We initiate an Opportunistic idea on Japan banks. Potential BoJ rate hikes should drive net interest margin expansion, while Japan’s reflation cycle boosts loan demand. Furthermore, ongoing corporate governance reforms – driving buybacks and dividends – support higher ROEs and continued valuation re-rating. The theme also helps broaden equity exposure beyond tech, with Japanese banks offering a distinct set of return drivers.
- We take profit on US aerospace and defence, locking in a gain of 3.1% (12 February 2026-18 June 2026). Aerospace demand has slowed amid geopolitical tensions, while growth in defence spending has been largely priced into current valuations. We also close our gold miners idea to cut our losses(a loss of 10.4% from 23 April 2026 to 18 June 2026). Although gold remains an Overweight from an asset allocation perspective, we see short-term gold price risks, and gold miners tend to be more volatile than the gold price itself.
Fig. 25 Opportunistic ideas

Ongoing ideas
MSCI World Equal Weight: The theme rides on a broadening rally beyond AI leaders and hedges against concentration risk
in cap-weighted benchmarks. Equal-weighting structurally tilts the index toward cyclicals – industrials and financials – which are set to benefit from resilient macro data and a soft-landing backdrop. An economic downturn weighing on cyclical stocks is a risk.
Hang Seng Technology: Tech innovation remains a key priority under China’s 15th Five-year Plan. Potential IPO activity should support investor sentiment, while deeply discounted valuations also offer an attractive entry point. Adverse regulatory changes are risks.
Sector views: Broadening out
We upgrade Europe ex-UK industrials to Overweight, driven by EU fiscal stimulus and AI investment and electrification supporting capital goods demand. Japan financials are also upgraded to Overweight amid the BoJ normalisation cycle and corporate governance reforms. We maintain a barbell strategy across US technology and communication services, where structural AI tailwinds and broadening monetisation opportunities remain compelling, balanced by defensive exposure to healthcare. Europe ex-UK financials remain Overweight, supported by strong balance sheets and attractive shareholder returns.
In China, we shift to a more pro-risk stance, given the broader market re-rating potential. Technology and communication services remain Overweight, driven by domestic chip self-reliance and AI monetisation. Healthcare is downgraded to Neutral and consumer staples to Underweight on limited earnings visibility, while utilities is upgraded to Neutral on improving power demand dynamics and policy support.
Fig. 26 Our sector views

Gold, crude oil – at a glance
|
Our view
- We remain Overweight gold but lower our three- and 12-month price targets to USD 4,750/oz and 5,100/oz, respectively.
We lower our three- and 12-monthWest Texas Intermediate (WTI) oil price forecasts to USD 80/bbl and USD 70/bbl, respectively, as reduced geopolitical risk premiums shift the focus back to fundamentals.
Key chart
Fig. 27 Gold’s sensitivity to real yields has re-emerged
Spot gold vs. US 10-year inflation-indexed bonds
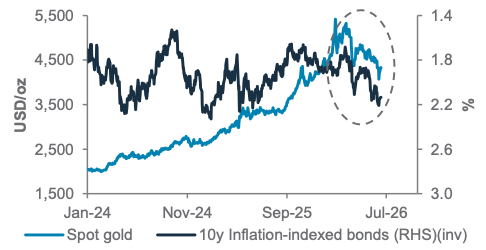
Fig. 29 Oil price expectations have shifted lower on the US-Iran interim deal
Market-implied WTI prices across future delivery months
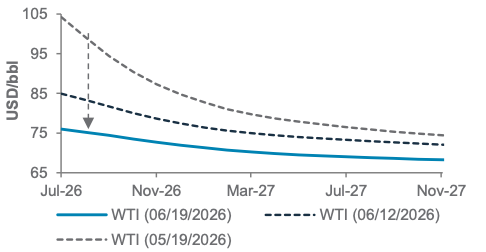
Fig. 28 Modest USD weakness may offer only limited support to gold
Spot gold vs. Trade Weighted Dollar Index
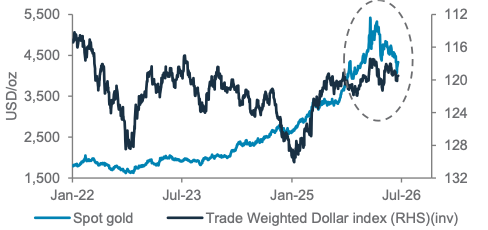
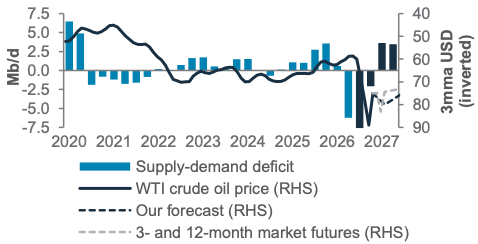
Fig. 30 Low oil inventories should support near-term prices, but forecasts point to a recovery ahead
Oil supply forecasts, price estimates
Gold outlook: The long-term case for gold remains intact, but the rally’s drivers are becoming more balanced. Gold’s sensitivity to traditional macro factors, particularly real yields and the USD, has re-emerged after weakening earlier in the cycle. With both likely to remain elevated, higher carrying costs should limit pace of gains near term and raise the risk of intermittent profit taking. Nevertheless, sustained central bank demand, ongoing diversification and residual geopolitical risks should continue to provide underlying support.
Oil outlook: The US-Iran interim deal has reduced geopolitical risks in oil markets, shifting the focus to supply-demand fundamentals. Trade flow uncertainties remain, and inventories are still relatively low, which could sustain some precautionary stockpiling and leave the market exposed to renewed shocks. However, the risk of a severe supply disruption has diminished. Stronger supply availability and uneven demand growth point to a more balanced market ahead, although inventories should support near-term prices.
FX – at a glance
|
|
||||
USD view
We have raised our three-month forecast for the DXY to 100, up from 98. We believe that the short-term focus is likely to shift away from geopolitical factors and return to US fundamentals. Recent robust US labour market data has attracted significant attention within the FX market, pushing US real interest rates to five-year highs. This has made hedging US assets increasingly costly, while market participants are now anticipating a less dovish stance from the Fed. The ongoing growth differential continues to provide structural support for the USD. Should forthcoming data releases continue to deliver upside surprises in inflation and employment, the DXY could easily breach 100.
We expect the DXY to ease modestly to 98 on a 12-month horizon. We maintain our view of flat policy rates through 2026 and a rate cut in 2027, which should eventually narrow interest-rate differentials and cap further USD upside. In our longer-term base-case scenario, as the initial commodity shock subsides and productivity-led growth stabilises the global economy, the extreme safe-haven demand for the greenback will likely wane. While commodity exporters should remain structurally supported, currencies with strong policy buffers and safe-haven characteristics, such as the Singapore dollar (SGD) and offshore Chinese yuan (CNH), are well-positioned to remain resilient and recover steadily against the modestly softening USD.
Key charts
Fig. 31 USD interest-rate differentials rebounded but remain below their five-year average. Upside risk is likely limited on a 12-month-forward basis
DXY, weighted interest rate differentials & five-year average
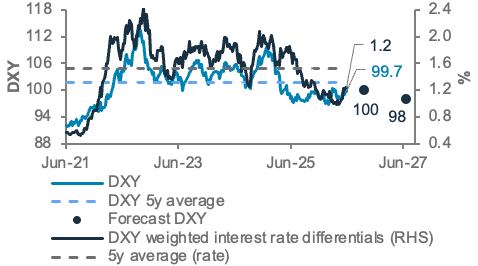
Fig. 33 USD/CHF was unable to decisively surpass 0.81, so it will likely remain near its five-year lows
USD/CHF and technicals
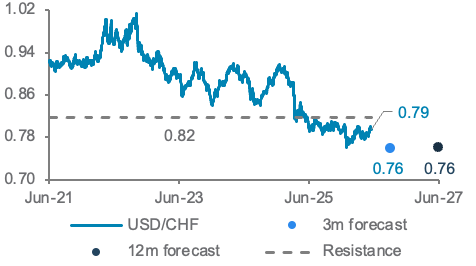
Fig. 32 JPY strength was offset by rising oil prices since the Middle East conflict began; conditions are anticipated to improve on the back of a peace deal
USD/JPY and oil price
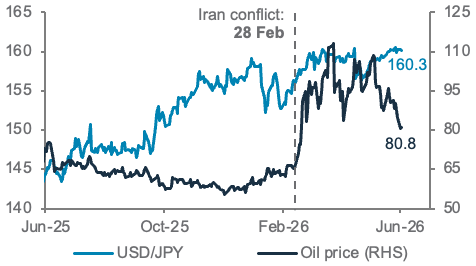
Fig. 34 Fig. 1 The Chinese yuan is strengthening as the PBoC lowers USD/CNH fixing
USD/CNH and Yuan mid-rate
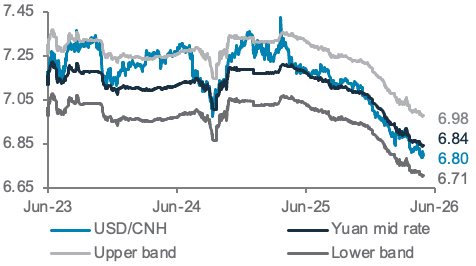
Fig. 33 Summary of currency forecasts and drivers

Additional perspectives
Quant perspective: Reduce equity Overweight due to frothy valuation
|
|
||||
Summary
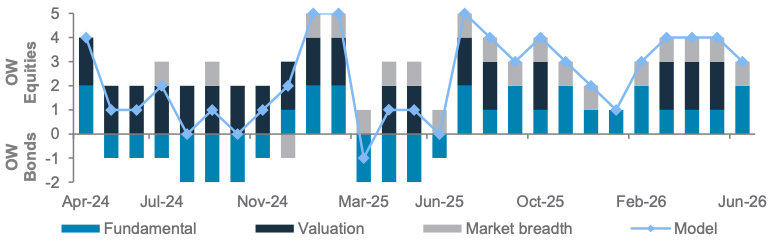
Our stock-bond model (3-6 months) has reduced its Overweight stance on global equities from 32% to 24%, due to frothy valuations in DM equities. The reduction came after three consecutive months of a large Overweight in equities between March and May, which helped deliver most of this year’s alpha. Meanwhile, more fundamental factors are bullish for equities, as the ISM new orders rose over the past three months and the economic surprise index for major economies showed that more economic data has surprised to the upside in June. Market breadth also continues to show strong participation in the current global equity uptrend, with 83% of individual equity markets remaining above their 200-day moving average (DMA). The YTD return stands at 11.7%, which translates to 3.6% of outperformance relative to the 60/40 equity-bond benchmark.
Our equity technical models (1-3 months) remain bullish on the S&P500 and MSCI AC World, but with greater conviction after the US-Iran interim deal. After indicating rising risks earlier in the month, the models revised the probability of bear market lower to 4.3% for S&P500 and 22.4% for MSCI AC World, largely driven by a fall in the Volatility Index (VIX), which currently sits below the 20% threshold. Higher market sensitivity to inflation shocks and weakening momentum are risks for MSCI AC World.
Our market diversity indicator no longer flags an MSCI Indonesia rebound after a 20+% rally from June’s low. MSCI Taiwan and MSCI Korea look quite stretched based on our market diversity indicators, but are yet to cross the critical thresholds
Key chart
Our stock-bond model reduced its equity Overweight as DM equities’ valuations look frothy. Fundamental and technical factors remain supportive of equities.
Fig. 36 Breakdown of our stock-bond rotation model’s scores
Model score in May 2026 remained at +4
VIX fell steeply below 20% after the US-Iran interim deal. Probabilityof bear market is revised lower to merely 4.3% for the S&P500 and 22.4% for MSCI AC World.
Fig. 37 Our technical model turned bullish on the S&P500
S&P500 Index; model’s bearish signal; technical support and resistance levels
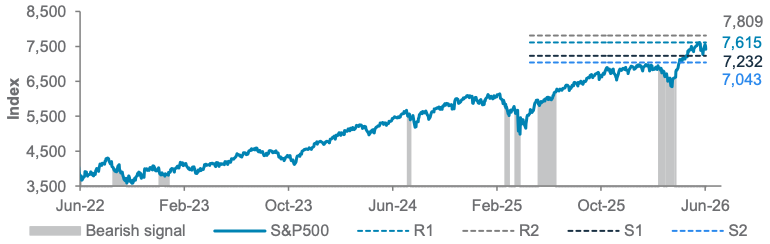
Fig. 38 Long- and short-term quantitative models remain bullish risk assets
Long-term models below have a typical time horizon of 3-6 months, while short-term models have a 1-3-month horizon


Performance review
Foundation: Asset allocation summary

Foundation+: Asset allocation summary

Market performance summary

Our key forecasts and calendar events

SC Wealth Select

Explanatory notes
- The figures on page 5 show allocations for a moderately aggressive risk profile only – different risk profiles may produce significantly different asset allocation results. Page 5 is only an example, provided for general information only and they do not constitute investment advice, an offer, recommendation or solicitation. They do not take into account the specific investment objectives, needs or risk tolerances of a particular person or class of persons and they have not been prepared for any particular person or class of persons.
- Contingent Convertibles are complex financial instruments and are not a suitable or appropriate investment for all investors. This document is not an offer to sell or an invitation to buy any securities or any beneficial interests therein. Contingent convertible securities are not intended to be sold and should not be sold to retail clients in the European Economic Area (EEA) (each as defined in the Policy Statement on the Restrictions on the Retail Distribution of Regulatory Capital Instruments (Feedback to CP14/23 and Final Rules) (“Policy Statement”), read together with the Product Intervention (Contingent Convertible Instruments and Mutual Society Shares) Instrument 2015 (“Instrument”, and together with the Policy Statement, the “Permanent Marketing Restrictions”), which were published by the United Kingdom’s Financial Conduct Authority in June 2015), other than in circumstances that do not give rise to a contravention of the Permanent Marketing Restrictions.
Disclosure
This document is confidential and may also be privileged. If you are not the intended recipient, please destroy all copies and notify the sender immediately. This document is being distributed for general information only and is subject to the relevant disclaimers available at our Standard Chartered website under Regulatory disclosures. It is not and does not constitute research material, independent research, an offer, recommendation or solicitation to enter into any transaction or adopt any hedging, trading or investment strategy, in relation to any securities or other financial instruments. This document is for general evaluation only. It does not take into account the specific investment objectives, financial situation or particular needs of any particular person or class of persons and it has not been prepared for any particular person or class of persons. You should not rely on any contents of this document in making any investment decisions. Before making any investment, you should carefully read the relevant offering documents and seek independent legal, tax and regulatory advice. In particular, we recommend you to seek advice regarding the suitability of the investment product, taking into account your specific investment objectives, financial situation or particular needs, before you make a commitment to purchase the investment product. Opinions, projections and estimates are solely those of SC at the date of this document and subject to change without notice. Past performance is not indicative of future results and no representation or warranty is made regarding future performance. The value of investments, and the income from them, can go down as well as up, and you may not recover the amount of your original investment. You are not certain to make a profit and may lose money. Any forecast contained herein as to likely future movements in rates or prices or likely future events or occurrences constitutes an opinion only and is not indicative of actual future movements in rates or prices or actual future events or occurrences (as the case may be). This document must not be forwarded or otherwise made available to any other person without the express written consent of the Standard Chartered Group (as defined below). Standard Chartered Bank is incorporated in England with limited liability by Royal Charter 1853 Reference Number ZC18. The Principal Office of the Company is situated in England at 1 Basinghall Avenue, London, EC2V 5DD. Standard Chartered Bank is authorised by the Prudential Regulation Authority and regulated by the Financial Conduct Authority and Prudential Regulation Authority. Standard Chartered PLC, the ultimate parent company of Standard Chartered Bank, together with its subsidiaries and affiliates (including each branch or representative office), form the Standard Chartered Group. Standard Chartered Private Bank is the private banking division of Standard Chartered. Private banking activities may be carried out internationally by different legal entities and affiliates within the Standard Chartered Group (each an “SC Group Entity”) according to local regulatory requirements. Not all products and services are provided by all branches, subsidiaries and affiliates within the Standard Chartered Group. Some of the SC Group Entities only act as representatives of Standard Chartered Private Bank and may not be able to offer products and services or offer advice to clients.
Copyright © 2026, Accounting Research & Analytics, LLC d/b/a CFRA (and its affiliates, as applicable). Reproduction of content provided by CFRA in any form is prohibited except with the prior written permission of CFRA. CFRA content is not investment advice and a reference to or observation concerning a security or investment provided in the CFRA SERVICES is not a recommendation to buy, sell or hold such investment or security or make any other investment decisions. The CFRA content contains opinions of CFRA based upon publicly-available information that CFRA believes to be reliable and the opinions are subject to change without notice. This analysis has not been submitted to, nor received approval from, the United States Securities and Exchange Commission or any other regulatory body. While CFRA exercised due care in compiling this analysis, CFRA, ITS THIRD-PARTY SUPPLIERS, AND ALL RELATED ENTITIES SPECIFICALLY DISCLAIM ALL WARRANTIES, EXPRESS OR IMPLIED, INCLUDING, BUT NOT LIMITED TO, ANY WARRANTIES OF MERCHANTABILITY OR FITNESS FOR A PARTICULAR PURPOSE OR USE, to the full extent permitted by law, regarding the accuracy, completeness, or usefulness of this information and assumes no liability with respect to the consequences of relying on this information for investment or other purposes. No content provided by CFRA (including ratings, credit-related analyses and data, valuations, model, software or other application or output therefrom) or any part thereof may be modified, reverse engineered, reproduced or distributed in any form by any means, or stored in a database or retrieval system, without the prior written permission of CFRA, and such content shall not be used for any unlawful or unauthorized purposes. CFRA and any third-party providers, as well as their directors, officers, shareholders, employees or agents do not guarantee the accuracy, completeness, timeliness or availability of such content. In no event shall CFRA, its affiliates, or their third-party suppliers be liable for any direct, indirect, special, or consequential damages, costs, expenses, legal fees, or losses (including lost income or lost profit and opportunity costs) in connection with a subscriber’s, subscriber’s customer’s, or other’s use of CFRA’s content.
Market Abuse Regulation (MAR) Disclaimer
Banking activities may be carried out internationally by different branches, subsidiaries and affiliates within the Standard Chartered Group according to local regulatory requirements. Opinions may contain outright “buy”, “sell”, “hold” or other opinions. The time horizon of this opinion is dependent on prevailing market conditions and there is no planned frequency for updates to the opinion. This opinion is not independent of Standard Chartered Group’s trading strategies or positions. Standard Chartered Group and/or its affiliates or its respective officers, directors, employee benefit programmes or employees, including persons involved in the preparation or issuance of this document may at any time, to the extent permitted by applicable law and/or regulation, be long or short any securities or financial instruments referred to in this document or have material interest in any such securities or related investments. Therefore, it is possible, and you should assume, that Standard Chartered Group has a material interest in one or more of the financial instruments mentioned herein. Please refer to our Standard Chartered website under Regulatory disclosures for more detailed disclosures, including past opinions/ recommendations in the last 12 months and conflict of interests, as well as disclaimers. A covering strategist may have a financial interest in the debt or equity securities of this company/issuer. All covering strategist are licensed to provide investment recommendations under Monetary Authority of Singapore or Hong Kong Monetary Authority. This document must not be forwarded or otherwise made available to any other person without the express written consent of Standard Chartered Group.
Sustainable Investments
Any ESG data used or referred to has been provided by Morningstar, Sustainalytics, MSCI or Bloomberg. Refer to 1) Morningstar website under Sustainable Investing, 2) Sustainalytics website under ESG Risk Ratings, 3) MCSI website under ESG Business Involvement Screening Research and 4) Bloomberg green, social & sustainability bonds guide for more information. The ESG data is as at the date of publication based on data provided, is for informational purpose only and is not warranted to be complete, timely, accurate or suitable for a particular purpose, and it may be subject to change. Sustainable Investments (SI): This refers to funds that have been classified as ‘ESG Intentional Investments – Overall’ by Morningstar. SI funds have explicitly stated in their prospectus and regulatory filings that they either incorporate ESG factors into the investment process or have a thematic focus on the environment, gender diversity, low carbon, renewable energy, water or community development. For equity, it refers to shares/stocks issued by companies with Sustainalytics ESG Risk Rating of Low/Negligible. For bonds, it refers to debt instruments issued by issuers with Sustainalytics ESG Risk Rating of Low/Negligible, and/or those being certified green, social, sustainable bonds by Bloomberg. For structured products, it refers to products that are issued by any issuer who has a Sustainable Finance framework that aligns with Standard Chartered’s Green and Sustainable Product Framework, with underlying assets that are part of the Sustainable Investment universe or separately approved by Standard Chartered’s Sustainable Finance Governance Committee. Sustainalytics ESG risk ratings shown are factual and are not an indicator that the product is classified or marketed as “green”, “sustainable” or similar under any particular classification system or framework.
Country/Market Specific Disclosures
Bahrain: This document is being distributed in Bahrain by Standard Chartered Bank, Bahrain Branch, having its address at P.O. 29, Manama, Kingdom of Bahrain, is a branch of Standard Chartered Bank and is licensed by the Central Bank of Bahrain as a conventional retail bank. Botswana: This document is being distributed in Botswana by, and is attributable to, Standard Chartered Bank Botswana Limited which is a financial institution licensed under the Section 6 of the Banking Act CAP 46.04 and is listed in the Botswana Stock Exchange. Brunei Darussalam: This document is being distributed in Brunei Darussalam by, and is attributable to, Standard Chartered Bank (Brunei Branch) | Registration Number RFC/61 and Standard Chartered Securities (B) Sdn Bhd | Registration Number RC20001003. Standard Chartered Bank is incorporated in England with limited liability by Royal Charter 1853 Reference Number ZC18. Standard Chartered Securities (B) Sdn Bhd is a limited liability company registered with the Registry of Companies with Registration Number RC20001003 and licensed by Brunei Darussalam Central Bank as a Capital Markets Service License Holder with License Number BDCB/R/CMU/S3-CL and it is authorised to conduct Islamic investment business through an Islamic window. China Mainland: This document is being distributed in China by, and is attributable to, Standard Chartered Bank (China) Limited which is mainly regulated by National Financial Regulatory Administration (NFRA), State Administration of Foreign Exchange (SAFE), and People’s Bank of China (PBOC). Hong Kong: In Hong Kong, this document, except for any portion advising on or facilitating any decision on futures contracts trading, is distributed by Standard Chartered Bank (Hong Kong) Limited (“SCBHK”), a subsidiary of Standard Chartered PLC. SCBHK has its registered address at 32/F, Standard Chartered Bank Building, 4-4A Des Voeux Road Central, Hong Kong and is regulated by the Hong Kong Monetary Authority and registered with the Securities and Futures Commission (“SFC”) to carry on Type 1 (dealing in securities), Type 4 (advising on securities), Type 6 (advising on corporate finance) and Type 9 (asset management) regulated activity under the Securities and Futures Ordinance (Cap. 571) (“SFO”) (CE No. AJI614). The contents of this document have not been reviewed by any regulatory authority in Hong Kong and you are advised to exercise caution in relation to any offer set out herein. If you are in doubt about any of the contents of this document, you should obtain independent professional advice. Any product named herein may not be offered or sold in Hong Kong by means of any document at any time other than to “professional investors” as defined in the SFO and any rules made under that ordinance. In addition, this document may not be issued or possessed for the purposes of issue, whether in Hong Kong or elsewhere, and any interests may not be disposed of, to any person unless such person is outside Hong Kong or is a “professional investor” as defined in the SFO and any rules made under that ordinance, or as otherwise may be permitted by that ordinance. In Hong Kong, Standard Chartered Private Bank is the private banking division of SCBHK, a subsidiary of Standard Chartered PLC. Ghana: Standard Chartered Bank Ghana Limited accepts no liability and will not be liable for any loss or damage arising directly or indirectly (including special, incidental or consequential loss or damage) from your use of these documents. Past performance is not indicative of future results and no representation or warranty is made regarding future performance. You should seek advice from a financial adviser on the suitability of an investment for you, taking into account these factors before making a commitment to invest in an investment. To unsubscribe from receiving further updates, please send an email to feedback.ghana@sc.com. Please do not reply to this email. Call our Priority Banking on 0302610750 for any questions or service queries. You are advised not to send any confidential and/or important information to Standard Chartered via e-mail, as Standard Chartered makes no representations or warranties as to the security or accuracy of any information transmitted via e-mail. Standard Chartered shall not be responsible for any loss or damage suffered by you arising from your decision to use e-mail to communicate with the Bank. India: This document is being distributed in India by Standard Chartered in its capacity as a distributor of mutual funds and referrer of any other third party financial products. Standard Chartered does not offer any ‘Investment Advice’ as defined in the Securities and Exchange Board of India (Investment Advisers) Regulations, 2013 or otherwise. Services/products related securities business offered by Standard Charted are not intended for any person, who is a resident of any jurisdiction, the laws of which imposes prohibition on soliciting the securities business in that jurisdiction without going through the registration requirements and/or prohibit the use of any information contained in this document. Indonesia: This document is being distributed in Indonesia by Standard Chartered Bank, Indonesia branch, which is a financial institution licensed and supervised by Otoritas Jasa Keuangan (Financial Service Authority) and Bank Indonesia. Jersey: In Jersey, Standard Chartered Private Bank is the Registered Business Name of the Jersey Branch of Standard Chartered Bank. The Jersey Branch of Standard Chartered Bank is regulated by the Jersey Financial Services Commission. Copies of the latest audited accounts of Standard Chartered Bank are available from its principal place of business in Jersey: PO Box 80, 15 Castle Street, St Helier, Jersey JE4 8PT. Standard Chartered Bank is incorporated in England with limited liability by Royal Charter in 1853 Reference Number ZC 18. The Principal Office of the Company is situated in England at 1 Basinghall Avenue, London, EC2V 5DD. Standard Chartered Bank is authorised by the Prudential Regulation Authority and regulated by the Financial Conduct Authority and Prudential Regulation Authority. The Jersey Branch of Standard Chartered Bank is also an authorised financial services provider under license number 44946 issued by the Financial Sector Conduct Authority of the Republic of South Africa. Jersey is not part of the United Kingdom and all business transacted with Standard Chartered Bank, Jersey Branch and other SC Group Entity outside of the United Kingdom, are not subject to some or any of the investor protection and compensation schemes available under United Kingdom law. Kenya: This document is being distributed in Kenya by and is attributable to Standard Chartered Bank Kenya Limited. Investment Products and Services are distributed by Standard Chartered Investment Services Limited, a wholly owned subsidiary of Standard Chartered Bank Kenya Limited that is licensed by the Capital Markets Authority in Kenya, as a Fund Manager. Standard Chartered Bank Kenya Limited is regulated by the Central Bank of Kenya. Malaysia: This document is being distributed in Malaysia by Standard Chartered Bank Malaysia Berhad (“SCBMB”). Recipients in Malaysia should contact SCBMB in relation to any matters arising from, or in connection with, this document. This document has not been reviewed by the Securities Commission Malaysia. The product lodgement, registration, submission or approval by the Securities Commission of Malaysia does not amount to nor indicate recommendation or endorsement of the product, service or promotional activity. Investment products are not deposits and are not obligations of, not guaranteed by, and not protected by SCBMB or any of the affiliates or subsidiaries, or by Perbadanan Insurans Deposit Malaysia, any government or insurance agency. Investment products are subject to investment risks, including the possible loss of the principal amount invested. SCBMB expressly disclaim any liability and responsibility for any loss arising directly or indirectly (including special, incidental or consequential loss or damage) arising from the financial losses of the Investment Products due to market condition. Nigeria: This document is being distributed in Nigeria by Standard Chartered Bank Nigeria Limited (SCB Nigeria), a bank duly licensed and regulated by the Central Bank of Nigeria. SCB Nigeria accepts no liability for any loss or damage arising directly or indirectly (including special, incidental or consequential loss or damage) from your use of these documents. You should seek advice from a financial adviser on the suitability of an investment for you, taking into account these factors before making a commitment to invest in an investment. To unsubscribe from receiving further updates, please send an email to clientcare.ng@sc.com requesting to be removed from our mailing list. Please do not reply to this email. Call our Priority Banking on 02 012772514 for any questions or service queries. SCB Nigeria shall not be responsible for any loss or damage arising from your decision to send confidential and/or important information to Standard Chartered via e-mail. SCB Nigeria makes no representations or warranties as to the security or accuracy of any information transmitted via e-mail. Pakistan: This document is being distributed in Pakistan by, and attributable to Standard Chartered Bank (Pakistan) Limited having its registered office at PO Box 5556, I.I Chundrigar Road Karachi, which is a banking company registered with State Bank of Pakistan under Banking Companies Ordinance 1962 and is also having licensed issued by Securities & Exchange Commission of Pakistan for Security Advisors. Standard Chartered Bank (Pakistan) Limited acts as a distributor of mutual funds and referrer of other third-party financial products. Singapore: This document is being distributed in Singapore by, and is attributable to, Standard Chartered Bank (Singapore) Limited (Registration No. 201224747C/ GST Group Registration No. MR-8500053-0, “SCBSL”). Recipients in Singapore should contact SCBSL in relation to any matters arising from, or in connection with, this document. SCBSL is an indirect wholly owned subsidiary of Standard Chartered Bank and is licensed to conduct banking business in Singapore under the Singapore Banking Act, 1970. Standard Chartered Private Bank is the private banking division of SCBSL. IN RELATION TO ANY SECURITY OR SECURITIES-BASED DERIVATIVES CONTRACT REFERRED TO IN THIS DOCUMENT, THIS DOCUMENT, TOGETHER WITH THE ISSUER DOCUMENTATION, SHALL BE DEEMED AN INFORMATION MEMORANDUM (AS DEFINED IN SECTION 275 OF THE SECURITIES AND FUTURES ACT, 2001 (“SFA”)). THIS DOCUMENT IS INTENDED FOR DISTRIBUTION TO ACCREDITED INVESTORS, AS DEFINED IN SECTION 4A(1)(a) OF THE SFA, OR ON THE BASIS THAT THE SECURITY OR SECURITIES-BASED DERIVATIVES CONTRACT MAY ONLY BE ACQUIRED AT A CONSIDERATION OF NOT LESS THAN S$200,000 (OR ITS EQUIVALENT IN A FOREIGN CURRENCY) FOR EACH TRANSACTION. Further, in relation to any security or securities-based derivatives contract, neither this document nor the Issuer Documentation has been registered as a prospectus with the Monetary Authority of Singapore under the SFA. Accordingly, this document and any other document or material in connection with the offer or sale, or invitation for subscription or purchase, of the product may not be circulated or distributed, nor may the product be offered or sold, or be made the subject of an invitation for subscription or purchase, whether directly or indirectly, to persons other than a relevant person pursuant to section 275(1) of the SFA, or any person pursuant to section 275(1A) of the SFA, and in accordance with the conditions specified in section 275 of the SFA, or pursuant to, and in accordance with the conditions of, any other applicable provision of the SFA. In relation to any collective investment schemes referred to in this document, this document is for general information purposes only and is not an offering document or prospectus (as defined in the SFA). This document is not, nor is it intended to be (i) an offer or solicitation of an offer to buy or sell any capital markets product; or (ii) an advertisement of an offer or intended offer of any capital markets product. Deposit Insurance Scheme: Singapore dollar deposits of non-bank depositors are insured by the Singapore Deposit Insurance Corporation, for up to S$100,000 in aggregate per depositor per Scheme member by law. Foreign currency deposits, dual currency investments, structured deposits and other investment products are not insured. This advertisement has not been reviewed by the Monetary Authority of Singapore. Taiwan: SC Group Entity or Standard Chartered Bank (Taiwan) Limited (“SCB (Taiwan)”) may be involved in the financial instruments contained herein or other related financial instruments. The author of this document may have discussed the information contained herein with other employees or agents of SC or SCB (Taiwan). The author and the above-mentioned employees of SC or SCB (Taiwan) may have taken related actions in respect of the information involved (including communication with customers of SC or SCB (Taiwan) as to the information contained herein). The opinions contained in this document may change, or differ from the opinions of employees of SC or SCB (Taiwan). SC and SCB (Taiwan) will not provide any notice of any changes to or differences between the above-mentioned opinions. This document may cover companies with which SC or SCB (Taiwan) seeks to do business at times and issuers of financial instruments. Therefore, investors should understand that the information contained herein may serve as specific purposes as a result of conflict of interests of SC or SCB (Taiwan). SC, SCB (Taiwan), the employees (including those who have discussions with the author) or customers of SC or SCB (Taiwan) may have an interest in the products, related financial instruments or related derivative financial products contained herein; invest in those products at various prices and on different market conditions; have different or conflicting interests in those products. The potential impacts include market makers’ related activities, such as dealing, investment, acting as agents, or performing financial or consulting services in relation to any of the products referred to in this document. UAE: DIFC – Standard Chartered Bank is incorporated in England with limited liability by Royal Charter 1853 Reference Number ZC18.The Principal Office of the Company is situated in England at 1 Basinghall Avenue, London, EC2V 5DD. Standard Chartered Bank is authorised by the Prudential Regulation Authority and regulated by the Financial Conduct Authority and Prudential Regulation Authority. Standard Chartered Bank, Dubai International Financial Centre having its offices at Dubai International Financial Centre, Building 1, Gate Precinct, P.O. Box 999, Dubai, UAE is a branch of Standard Chartered Bank and is regulated by the Dubai Financial Services Authority (“DFSA”). This document is intended for use only by Professional Clients and is not directed at Retail Clients as defined by the DFSA Rulebook. In the DIFC we are authorised to provide financial services only to clients who qualify as Professional Clients and Market Counterparties and not to Retail Clients. As a Professional Client you will not be given the higher retail client protection and compensation rights and if you use your right to be classified as a Retail Client we will be unable to provide financial services and products to you as we do not hold the required license to undertake such activities. For Islamic transactions, we are acting under the supervision of our Shariah Supervisory Committee. Relevant information on our Shariah Supervisory Committee is currently available on the Standard Chartered Bank website in the Islamic banking section. For residents of the UAE – Standard Chartered UAE (“SC UAE”) is licensed by the Central Bank of the U.A.E. SC UAE is licensed by Securities and Commodities Authority to practice Promotion Activity. SC UAE does not provide financial analysis or consultation services in or into the UAE within the meaning of UAE Securities and Commodities Authority Decision No. 48/r of 2008 concerning financial consultation and financial analysis. Uganda: Our Investment products and services are distributed by Standard Chartered Bank Uganda Limited, which is licensed by the Capital Markets Authority as an investment adviser. United Kingdom: In the UK, Standard Chartered Bank is authorised by the Prudential Regulation Authority and regulated by the Financial Conduct Authority and Prudential Regulation Authority. This communication has been approved by Standard Chartered Bank for the purposes of Section 21 (2) (b) of the United Kingdom’s Financial Services and Markets Act 2000 (“FSMA”) as amended in 2010 and 2012 only. Standard Chartered Bank (trading as Standard Chartered Private Bank) is also an authorised financial services provider (license number 45747) in terms of the South African Financial Advisory and Intermediary Services Act, 2002. The Materials have not been prepared in accordance with UK legal requirements designed to promote the independence of investment research, and that it is not subject to any prohibition on dealing ahead of the dissemination of investment research. Vietnam: This document is being distributed in Vietnam by, and is attributable to, Standard Chartered Bank (Vietnam) Limited which is mainly regulated by State Bank of Vietnam (SBV). Recipients in Vietnam should contact Standard Chartered Bank (Vietnam) Limited for any queries regarding any content of this document. Zambia: This document is distributed by Standard Chartered Bank Zambia Plc, a company incorporated in Zambia and registered as a commercial bank and licensed by the Bank of Zambia under the Banking and Financial Services Act Chapter 387 of the Laws of Zambia.