20 June 2025
Global Market Outlook
Global Market Outlook
Positioning for a weak dollar
We are Overweight global equities. Policy easing worldwide, strong chances of a US soft landing and a weaker USD are supportive of risky assets. We favour diversified global equity exposure, within which we upgrade Asia ex-Japan equities to Overweight.
We expect the USD to weaken, benefitting the EUR, JPY and GBP. History shows USD weakness is positive for equities and outperformance of non-US equities. We favour 5-7-year maturities in USD bonds and upgrade EM local currency bonds to Overweight.
Renewed tariffs, inflation and weaker economic data are key risks. Gold and Alternative Strategies are attractive diversifiers that can also help mitigate temporary volatility.
Can a multi-asset income allocation still pay 5% yield?
Is the dollar’s reign over?
Are your quantitative models still risk-on?
Strategy
Investment strategy and key themes
|
|
||||
|

12m Foundation Overweights:
- Global equities
- Asia ex-Japan equities
- EM local currency bonds
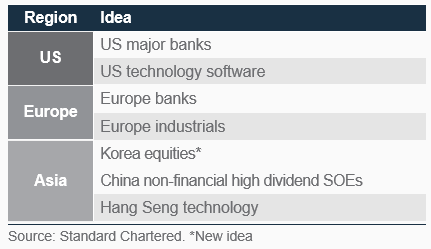
Opportunistic ideas – Equities
- US software, major banks
- Korea large-cap equities, China non-financial high-dividend state-owned entities (SOEs) and Hang Seng Technology index
- Europe banks, industrials
Sector Overweights:
- US: Financials, technology, communication services
- Europe: Comms, technology, industrials, financials
- China: Comms, technology, discretionary
Opportunistic ideas – Bonds
- Asia local currency bonds
- UK Gilts (FX-unhedged)
- US Treasury Inflation-Protected Securities (TIPS)
Positioning for a weak dollar
- We are Overweight global equities. Policy easing worldwide, strong chances of a US soft landing and a weaker USD are supportive of risky assets. We favour diversified global equity exposure, within which we upgrade Asia ex-Japan equities to Overweight.
- We expect the USD to weaken, benefitting the EUR, JPY and GBP. History shows USD weakness is positive for equities and outperformance of non-US equities. We favour 5-7-year maturities in USD bonds and upgrade EM local currency bonds to Overweight.
- Renewed tariffs, inflation and weaker economic data are key risks. Gold and Alternative Strategies are attractive diversifiers that can also help mitigate temporary volatility.
A constructive, but volatile, H2 2025
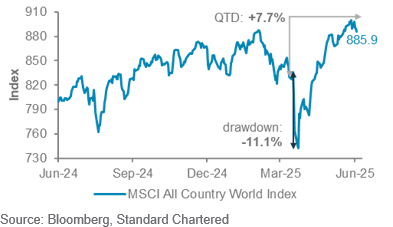
Q2 2025 has been a textbook lesson in investing through volatility. ‘Liberation Day’ and Middle East tensions notwithstanding, global equities are up approximately 8% quarter-to-date, albeit not in a straight line.
We expect H2 2025 to be constructive for economic and earnings growth, but we also expect bouts of volatility. In the US, despite earlier weakness in survey-based data, ‘hard data’ has been relatively resilient. This, together with supportive fiscal and monetary policy across the US, Europe and Asia, is why we still believe the US economy will achieve a soft landing.
However, several risks merit close attention. Early July brings the end of Trump’s 90-day tariff ‘pause’. We expect extensions to allow trade discussions to continue, but not without rhetoric. Meanwhile, Middle East and Ukraine-Russia conflicts continue to simmer, with the former posing a (likely brief) risk of higher energy prices.
In our base case, we expect these risks to result in temporary (as opposed to sustained) volatility. The top three risks to our view that we will monitor are (i) a sustained rise in trade tariffs, (ii) a jump in oil prices as a result of geopolitical events and (iii) a sudden decline in US hard economic data towards recessionary levels.
Fig. 1 Q2 2025 illustrates a constructive environment for equities, despite temporary volatility
Global equities (MSCI All Country World Index)
USD weakness ahead
We expect a weaker USD in the next 6-12 months, with risks tilted to the downside. This will be a key market driver.
Since April, much attention has been focused on the structural risk of ‘de-dollarisation’. Shorter-term cyclical factors, such as the USD’s still-elevated valuations, the potential for lower rate differentials and uncertain US trade policy, should result in a weaker USD over the next 6-12 months. The EUR and JPY are expected to be key winners, with the GBP also showing resilience. We expect the CHF to stay range-bound, as low domestic rates balance against a weaker USD. In Asia, SGD should weaken from the top of its policy band.
Bullish global equities
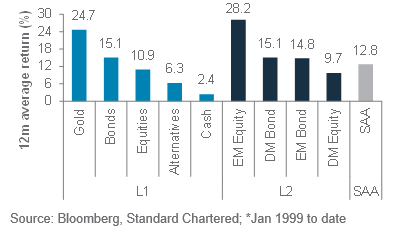
Our weak USD view has significant implications for equities. History shows periods of USD weakness (i) are positive for global equity market returns, including US equities, but (ii) usually result in non-US equities outperforming US equities. The first factor, in particular, plays a key role in our bullish view on equity markets across regions and our Overweight on equities over bonds and cash.
The second factor feeds into our decision to move Overweight Asia ex-Japan equities. EM equities, including in Asia, have historically performed well when the USD is weak. Within Asia ex-Japan, we upgraded Korea to Overweight, joining China. North Asian equities’ cyclicality and more attractive valuations are key driving factors.
Korea, China and India equities are enjoying domestic fiscal support and can benefit from a softer USD. In China, we prefer the cyclical technology, communication services and consumer discretionary sectors. In India, strong structural dynamics and its geopolitical positioning are supportive. We prefer Indian large caps over small- and mid-caps.
Europe equities remain another attractive non-US market. Valuations are still cheap, and fiscal spending should support the region’s earnings growth in the coming years. Hence, we are bullish and retain a core allocation in our portfolios.
Diversification aside, we are also bullish US equities. A soft landing of the US economy and a weaker USD are
Fig. 2 Weak USD environments generate positive returns for financial markets and risky assets
Historical* 12m returns when USD index (DXY) falls >10%
supportive for earnings, especially if the Fed cuts rates in H2 2025, as we expect. This is consistent with our preference for the cyclical financial, technology and communication services sectors. However, historical evidence suggests US equities struggle to outperform non-US equities when the USD falls. Hence, we have US equities as a core allocation in our portfolios.
Add to non-USD bonds
We raise EM local currency bonds to Overweight. They are likely to benefit from a weak USD as well as price appreciation from EM central bank rate cuts. Compared to the US, EM central banks face more limited inflation risks and, therefore, have more room to cut rates.
In USD bond markets, we expect US government bond yields (rates) to be a bigger driver of returns than yield premiums (credit), due to already tight yield premiums. High-quality bonds are attractive while the 10-year US government bond yield is 4.50% or higher. We anticipate a move into our expected 4.00-4.25% range over 6-12 months. Short-lived spikes to 4.80-5.00% cannot be ruled out on escalations in trade, inflation or fiscal worries, but we would view any such move as temporary (and an attractive opportunity) in our base case of a US economic soft landing.
We believe the 5-7-year bond maturity bucket offers the best trade-off between attractive yields and potential price gains while avoiding excessive exposure to inflation or fiscal deficit risks inherent in longer maturities. Corporate bonds offer less room than usual for returns, though Developed Market High Yield and EM USD bonds can offer opportunities (we see both as core allocations in our portfolios).
Gold to grind higher
We also see gold as a core allocation. Central bank demand is expected to result in another leg higher in prices after a period of consolidation. It also plays a key portfolio diversifier role when bonds do not. We also see alternative strategies as key to diversification – equity long-short strategies offer exposure to our bullish equities view and the ability to benefit from likely stock/sector dispersion, while private credit strategies offer attractive yields without duration risk.
In the near term, renewed appetite for US assets and closing of earlier bearish positions should offer support for the USD. This should reduce demand for safe haven currencies, typically with low borrowing costs. However, we expect this USD bounce to be temporary. Ongoing rotation out of US assets and elevated USD valuations are likely to lead to a modestly weaker USD in the longer term.
Risk #1 – An oil price shock
Our base scenario is the Middle East conflict does not directly disrupt the supply of oil and other energy commodities. Geopolitical tensions are likely to remain relatively elevated, but oil prices should be capped thanks primarily to excess global supply.
In our base scenario of West Texas Intermediate (WTI) oil staying in a range around USD 65/bbl over the next 6-12 months, equities are expected to outperform other major asset classes, while bond yields are capped.
However, a downside risk scenario would emerge if the regional conflict escalated to a direct disruption of oil supply (via disruptions in the Strait of Hormuz or to regional oil production, storage and transport infrastructure). In such a scenario, oil prices would rise significantly (likely above USD 100/bbl) as excess supply and spare capacity are very quickly used up or become out of reach.
A sharp rise in oil prices transmits risk to global markets by raising inflation expectations. This would result in slower growth, putting the Fed in a difficult spot by limiting its room to cut rates and support growth. Such oil price shocks have triggered many past US recessions.
In such a scenario, traditional safe-haven and inflation hedges are likely to outperform. Hedges include gold, inflation-protected bonds, safe-haven currencies – such as the CHF and JPY – and energy-correlated assets – for example, energy sector equities and the CAD and NOK.
Risk #2 – An investor-unfriendly section 899
There has been much investor and corporate concern over the proposed section 899 in Trump’s ‘Big Beautiful [budget] Bill’.
This section offers US policymakers the discretion to impose taxes on investments (corporate and financial) originating in markets the US deems to have ‘discriminatory’ taxation in place. President Trump has cited European digital taxes as an example of such discriminatory taxation.
Corporate and investor concerns centre on how widely such retaliatory tax measures could be imposed and how negative their impact could be on investment flows into the US and thus the valuations of stocks, bonds and the USD.
We are closely watching discussions in the Senate. While the House has passed the bill, it is unclear whether it will pass through the Senate in its current form, given the concerns raised. The final version is also likely to be subject to legal interpretation and significant discretion in its application by US policymakers.
At the time of writing, this unfortunately leaves investors with a lot of uncertainty in terms of how much risk this section poses to investment flows and earnings. Greater clarity will emerge after the Senate agrees to a final version of the bill. The implementation of section 899 measures is currently scheduled from 2026.
Fig. 3 Any jump in oil prices poses a risk to US inflation expectations and limits room for Fed cuts
Brent oil price vs. US inflation expectations
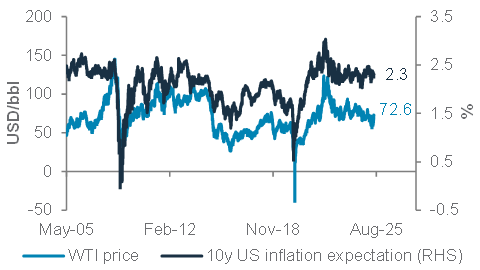
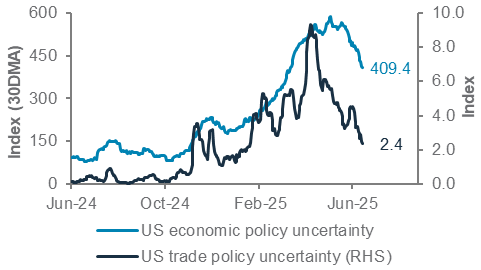
Fig. 4 US policy uncertainty is off its peaks but remains high. Tariff and fiscal policies are key
US economic and trade policy uncertainty indices
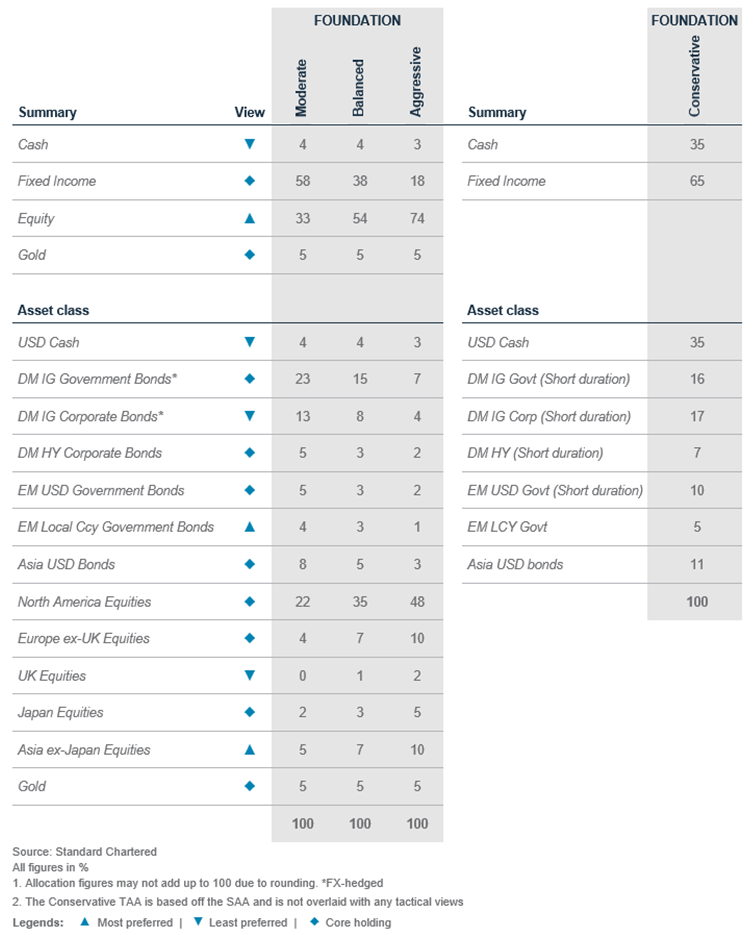
Foundation asset allocation models
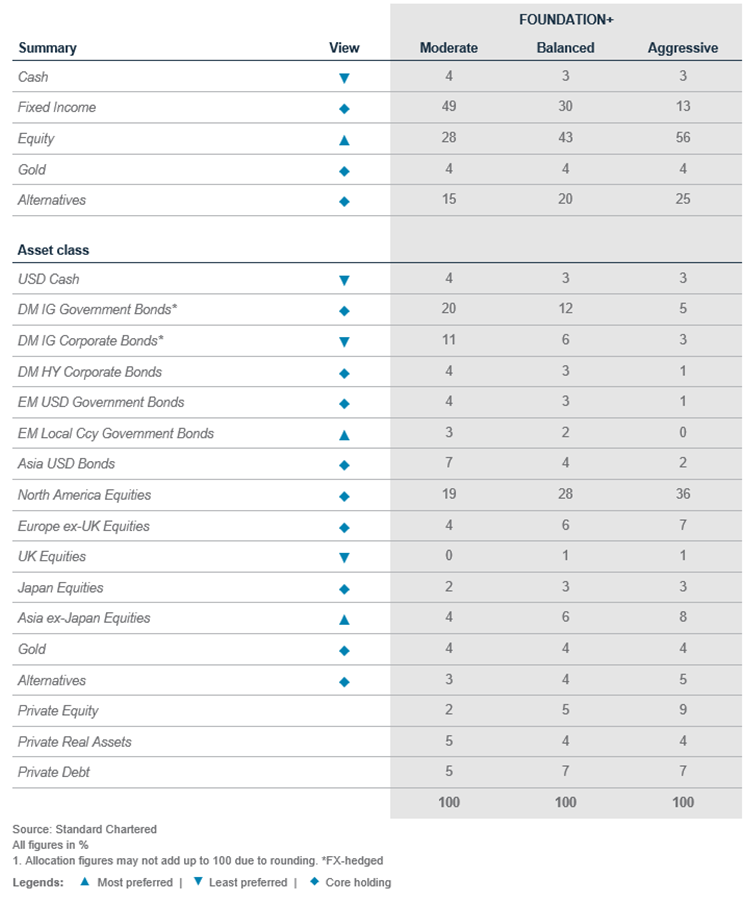
The Foundation and Foundation+ models are allocations that you can use as the starting point for building a diversified investment portfolio. The Foundation model showcases a set of allocations focusing on traditional asset classes that are accessible to most investors, while the Foundation+ model includes allocations to private assets that may be accessible to investors in some jurisdictions, but not others.
Fig. 5 Foundation asset allocation for a balanced risk profile
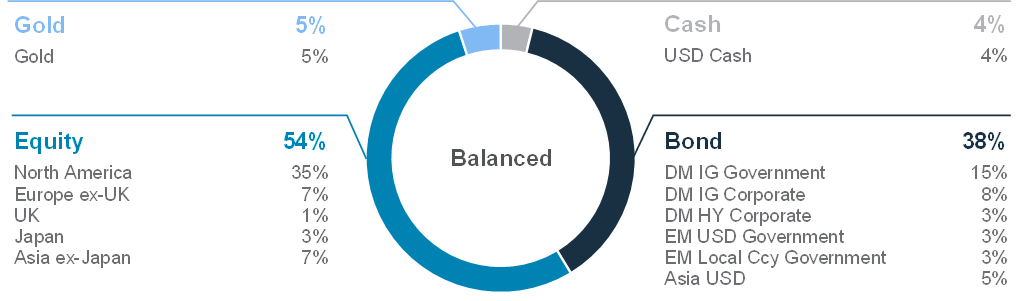
Fig. 6 Foundation+ asset allocation for a balanced risk profile
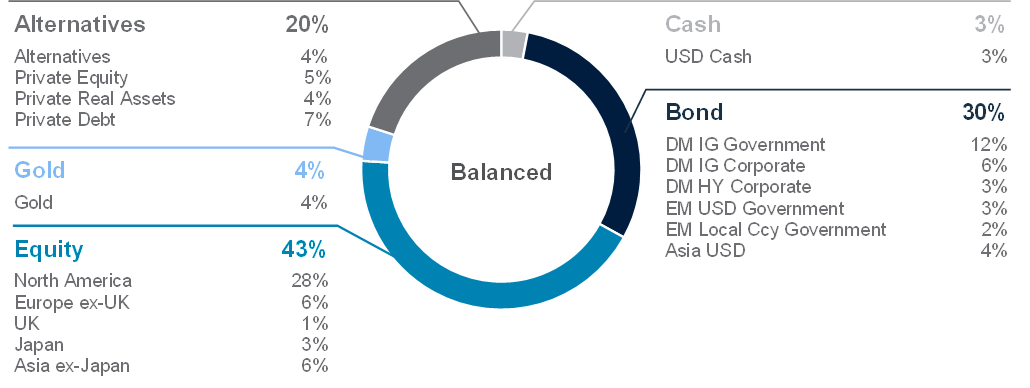
Fig. 7 Multi-asset income allocation for a moderate risk profile
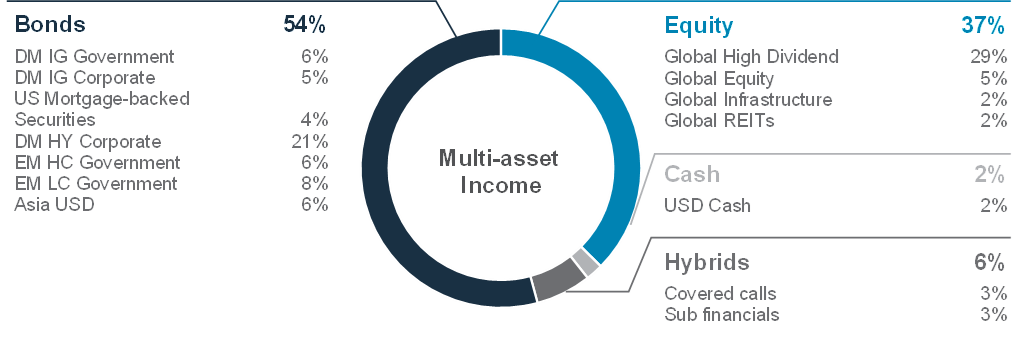
Source: Standard Chartered
Foundation: Our tactical asset allocation views
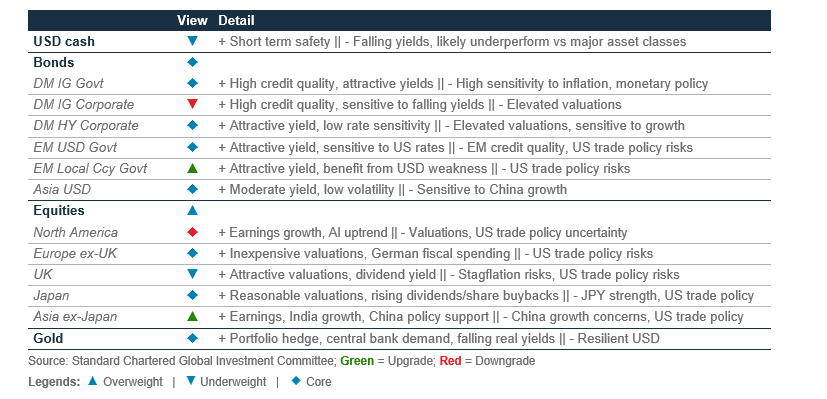
Fig. 8 Performance of our Foundation Allocations*
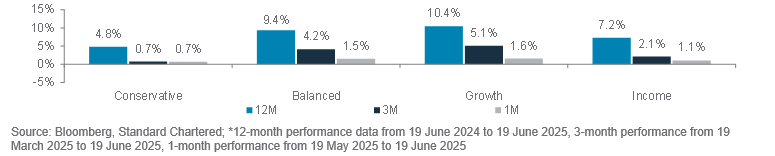
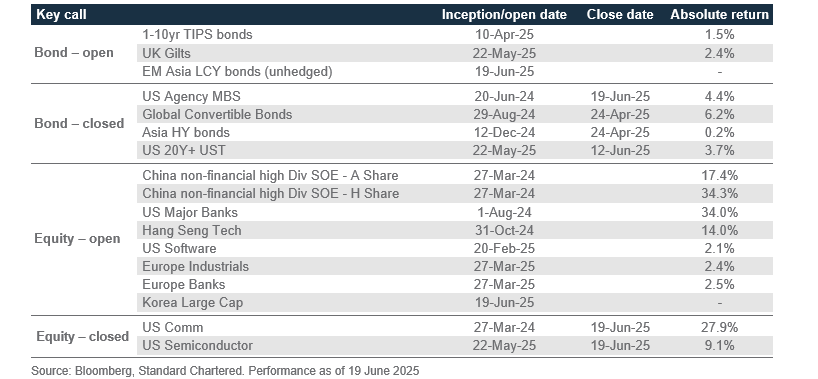
Fig. 9 Opportunistic ideas performance
Foundation: Multi-asset income strategies
|
|
||||
Our view
Our multi-asset income (MAI) strategy has remained resilient amid all the noise and turbulence in Q2 25, delivering 2.1% over the past 3 months, with solid performances from dividend-paying equities, High Yield (HY) bonds, Emerging Market (EM) Local Currency (LCY) bonds and sub-financials.
Our MAI strategy continues to deliver a steady yield of c. 5.7%, which remains attractive in the current rate environment. Over the next 6-12 months, we expect the Fed to resume interest rate cuts. Investors should look to lock in higher income, capitalising on yield spikes to benefit from attractive income and potential capital gains.
Under our base case of a US economic soft landing, we continue to see further upside in equities and thus remain comfortable in tilting slightly in favour of equities over fixed income. Our equity allocations are balanced between income-generating equities and traditional growth equities. Within fixed income, our expectation of a weaker USD supports our case for increased allocations into EM LCY bonds. Lastly, we expect US Agency Mortgage-Backed Securities (MBS) to continue to outperform Developed Market (DM) Investment Grade (IG) government bonds.
Key chart
We utilise a mix of bonds, equities and hybrids to build a resilient and diversified income strategy to achieve attractive income and healthy total returns
Fig. 10 MAI strategies have been resilient in the face of market volatility, outperforming a traditional 60/40 equity/bond portfolio
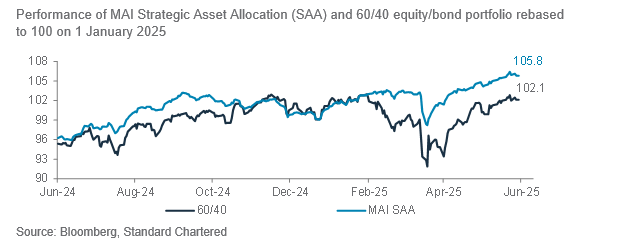
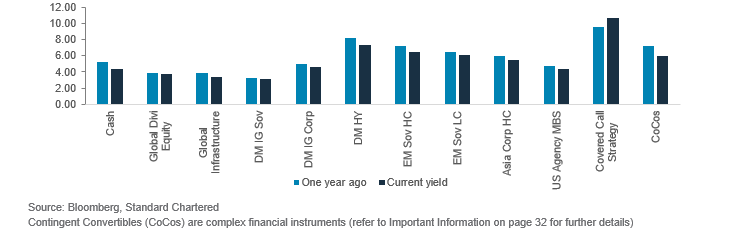
Fig. 11 We expect the Fed to cut interest rates; investors can lock in yields while they are still elevated
Yield to worst/dividend yield (%)
MAI strategy continues its strong performance in Q2 25
Our MAI strategy delivered 2.1% over the past 3 months. US tariff policy-related headlines dominated the quarter, beginning with 2 April ‘Liberation Day’ tariffs, followed by pauses and trade negotiations.Amid the noise and turbulence, our MAI strategy has remained resilient on the back of income-generating assets such as dividend-paying equities, HY bonds, EM LCY bonds and sub-financials such as Contingent Convertibles (CoCos), all of which have contributed strongly to the overall performance of the strategy.
Over the next 6-12 months, we expect the Fed to resume its rate cutting cycle. On the back of this, we see yields falling from the current levels. We believe investors should capitalise on yield spikes to benefit from attractive income and potential capital gains.
Under our base case of a US economic soft landing, we also see further upside in equities and thus continue to favour equities over bonds. Our equity allocations are balanced between income-generating equities and traditional growth equities. This will help investors to capture the upside through capital gains while buffering against market volatility with income. Within fixed income, our outlook for a weaker USD supports the case for increased allocations into EM LCY bonds. Lastly, we expect US Agency MBS bonds to continue with their outperformance against DM IG government bonds, given the pick-up in spreads for a similar level of risk (US Agency MBS bonds are backed by the US government).
Enhancing yield in MAI strategies
As investors adjust to a slower growth and lower rate environment, yield remains a key driver of returns in MAI portfolios. We continue to see opportunities in hybrid and high-yielding bonds, for example in CoCos and DM HY, which offer equity-like income with lower volatility.
Fig. 12 Attractive risk-return profile of CoCos
Returns and standard deviations of selected assets (%)
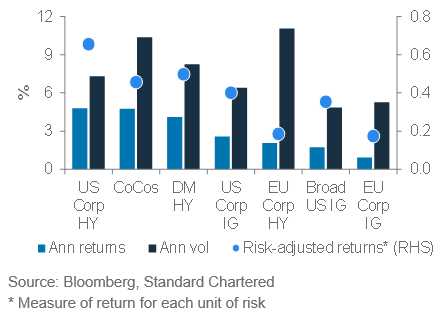
CoCos, which are hybrid instruments issued by high-quality, well-capitalised and systemically important banks, have delivered impressive performance, returning 9.1% year to date and more than 14.8% over the past 12 months, even outpacing global equities. Strong bank capital buffers, with Common Equity Tier 1 ratios comfortably above regulatory minimums, reinforce investor confidence in coupon continuity.
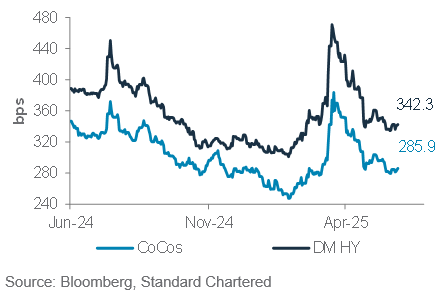
However, after this strong run and tightening valuations, we have reduced our overweight position in CoCos. Spreads between CoCos and DM HY bonds have compressed near cycle lows. Further spread compression is unlikely in a moderating growth environment. Despite tighter valuations, both assets still deliver yields well above IG bonds and sovereign alternatives, contributing meaningful carry to portfolios without taking excessive duration risk. It is prudent to maintain a balanced exposure across both segments.
We have also upgraded EM LCY bonds to an Overweight allocation, reflecting improving EM macro and policy dynamics. Stable external balances and attractive real yields support many EM currencies. We see room for currency appreciation to complement attractive real yields as the USD faces further pressure from expected Fed cuts and US fiscal/trade policy uncertainty. This asset class offers an attractive mix of carry, currency upside and diversification.
Fig. 13 Spreads have retraced much of April’s widening after the de-escalation of trade tensions
Yield premiums on CoCos and DM HY
The recent bout of USD weakness is a timely reminder of why true diversification in a MAI portfolio matters – not just across asset classes, but also across income sources. Utilising a mix of fixed income assets, such as EM LCY bonds, equity-income assets, such as global dividend payers, and hybrids offers not only income but also return enhancement. Ultimately, a well-diversified income portfolio is inherently more resilient – positioned not only to adapt whether the dollar rebounds or continues to soften, but also navigates the uncertainty in H2 25.
Perspectives on key client questions
|
|
||||
Is the dollar’s reign over?
- There is no credible challenger to the USD for now
- However, shifting trade flows, structural debt concerns and changing investor behaviour suggest the USD’s supremacy is slowly being eroded
- Diversification remains crucial to navigate the uncertainties ahead
The USD has long served as the cornerstone of the global financial system. Underpinned by the depth and liquidity of US capital markets and broad confidence in the country’s economic and institutional stability, the USD has remained central to global trade, central bank reserves and capital markets. Yet, this dominance is increasingly being tested. A shifting geopolitical landscape, mounting fiscal challenges and the gradual regionalisation of trade are prompting investors to rethink their reliance on the greenback. The case for a weaker USD is growing.
USD’s gradual diminishing role
Let’s be clear: there’s still no real alternative to the USD. The EUR lacks a true fiscal union and deep bond/equity markets. The RMB remains constrained by capital controls. Even with all the talk about a multipolar world, the USD remains deeply embedded in how the world trades, borrows and invests.
The USD currently accounts for 58% of global foreign exchange (FX) reserves, more than 80% of global FX turnover and one-third of global debt issuances. These are not numbers that change quickly. Two decades ago, the USD’s reserve share was closer to 70%. Central banks have steadily diversified – into the EUR, JPY, GBP and ‘others’ category that includes the AUD, CAD, CHF and gold. Growing geopolitical tensions and trade fragmentation are only accelerating that shift.
Trade fragmentation is chipping away at USD dominance
The USD still dominates trade between advanced economies and Emerging Markets (EMs). But EM trade is increasingly bypassing the USD, with more transactions settled in local currencies or alternatives. As of 2022, about 75% of global trade

Fig. 14 The USD remains dominant globally, well beyond what the share of US GDP would suggest
Share of USD in trade, payments, transactions and debt
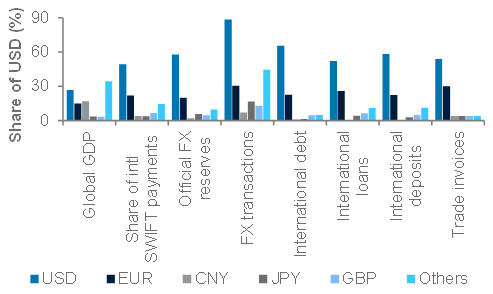
Composition of central bank total reserves by currency
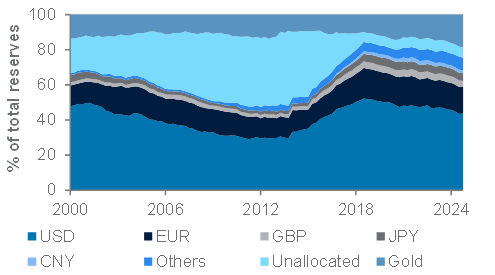
Source: ECB, IMF, World Gold Council, Brookings. All data as of end-2024 except SWIFT payments (Mar-25) and FX transactions (2022). China is included in ‘Others’ for international loans and deposits. Sum of shares of foreign exchange transactions totals 200%. Unallocated reserves are FX reserves held by countries that do not report the currency breakdown. USD as share of allocated reserves for LHS chart.
involved advanced economies and only 25% was EM-to-EM or EM-to-China trade. That smaller slice is where de-dollarisation is gaining ground. This is not yet enough to unseat the greenback, but is reshaping parts of the global economy, especially as EM-to-EM trade growth outpaces DM-to-EM trade growth in the coming years.
Structural risks from within
The bigger risks to the USD may come from within. US federal debt is projected to hit 99% of GDP in 2024 and 118% within a decade, according to the US Congressional Budget Office. This raises concerns about the long-term appeal of US government bonds as the world’s preferred safe asset.
Foreign ownership of US bonds is slipping. With slower reserve accumulation and diversification, foreign holdings of US bonds have fallen to about 30% of outstanding amounts. There are no signs of a broad sell-off, but the US may have to offer higher yields relative to other major markets to keep attracting global capital as issuances continue to rise.
Hedging of FX risks increasingly important
Beyond central banks and trade, a quiet shift is happening among institutional investors. Foreign investors have accumulated USD 56.6trn in US financial assets, up from just USD 2.2trn in 1990. That includes USD 16.5trn in equities, USD 14.5trn in debt securities, and USD 16.5trn in foreign direct investment. For many years, most investors – pension funds, insurers, sovereign wealth funds – did not hedge their USD exposure aggressively. The dollar’s historical tendency to rise in times of stress made it a natural portfolio hedge. This so-called ‘USD smile’ worked well for years, but the smile is fading. US government bonds and the dollar have become less reliable portfolio stabilisers during periods of market stress. That’s made the cost of being unhedged far more painful. As a result, we’re seeing early signs of increasing FX hedging activity, which could create sustained downward pressure on the dollar.
Even in funding markets, decoupling from USD is emerging. HIBOR has diverged from US rates due to excess liquidity
Fig. 15 US government bonds have not been an effective hedge against equity market sell-offs
S&P500 drawdowns vs. US government bond returns
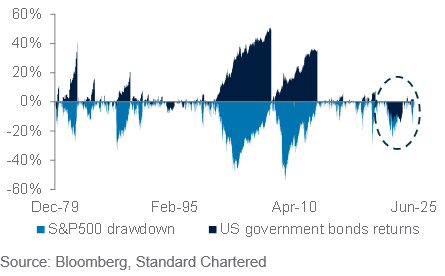
in HKD and weak demand for HKD-funded carry trade – a gap likely to persist short-term, but converge over the longer term.
Gold: diversification in uncertain times
If there’s a winner from the de-dollarisation push, it’s gold. Central banks, especially in EMs, have ramped up gold purchases. The People’s Bank of China, for instance, resumed gold buying in 2022 after a three-year pause. According to a World Gold Council survey, 76% of global central banks surveyed believe that gold will comprise a higher share of global reserves five years from now, up from 69% in last year’s survey. Gold now accounts for an estimated 18% of global reserves, up from 11% in 2018. Part hedge, part symbol, gold’s appeal is clear in a world of rising inflation, geopolitical friction and currency uncertainty.
What does this mean for investment portfolios?
In the near term, these forces point to a softer USD, especially if FX hedging continues to rise. The USD is unlikely to lose its primacy anytime soon, but its share in global reserves, debt markets and transactions is gradually declining. Investors, policymakers and institutions would be wise to plan for a world where the USD’s leadership becomes more contested.
It’s important for global investors to distinguish between cyclical and structural USD weakness. The former, driven by interest rate differentials, relative US equity market underperformance or mean reversion in terms of valuations, calls for tactical repositioning away from the USD. But structural weakness, rooted in lasting shifts in global trade, reserve composition and capital flows, would require rethinking strategic asset allocation.
For now, tactical allocation shifts would involve increasing exposure to non-US equities and local-currency bonds or adding to gold on dips, not just as a short-term hedge, but as a medium-term diversifier. In structural allocations, the USD remains a foundation currency, but portfolios will need to be tweaked via higher hedging ratios on USD-denominated assets or greater non-US exposure in the coming years to reflect the global economic, trade and political rebalancing.
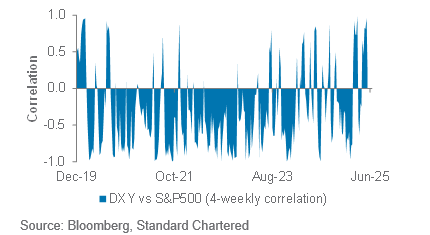
Fig. 16 USD has lately correlated positively with the S&P500, amplifying losses/gains for foreign investors
USD index (DXY) vs. S&P500 rolling correlation
Macro overview – at a glance
Our macroeconomic outlook and key questions
|
Key themes
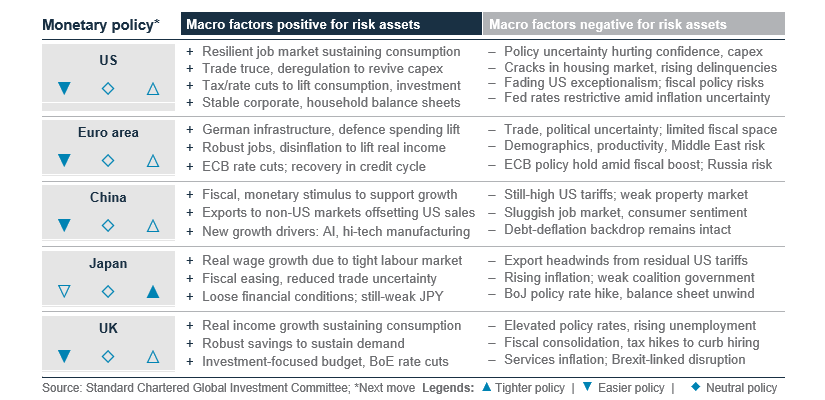
Core scenario (soft landing, 55% probability): The US-China trade truce lifted the chance of a US economic soft landing to 55% from 50%. We expect the Trump administration to finalise preliminary trade deals with key partners and pass a modestly stimulating budget in Q3 25. The Fed is likely to cut rates by 75bps over the next 12 months, starting from Q3 25, to counter a slowing job market. Meanwhile, monetary and fiscal policy easing should support growth in EMs and Europe.
Downside risk (hard landing, 25% probability): Business confidence remains weak globally, especially in the US and Euro area, dented by US policy uncertainty. We still see a 25% chance of a US hard landing/recession in the next 12 months. A surge in US bond yields, either due to unfunded tax cuts or higher oil prices, and a USD sell-off are other risks to the soft-landing view.
Upside risk (no landing, 20% probability): We reduce the probability of a no landing from 25% in favour of a soft landing, given residual trade risks and the latest Middle East tensions. Under a no-landing scenario, trade deals and policy stimulus, especially in Europe and China, could revive consumer and business sentiment, leading to a more balanced global economy.
Key chart
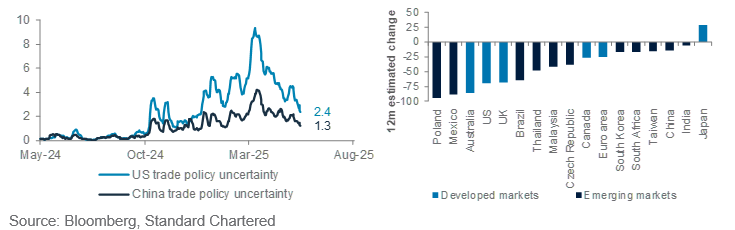
Global trade tensions have eased significantly following the US-China truce. Meanwhile, continued disinflation, especially in EMs, is setting the stage for further central bank rate cuts in H2 25
Fig. 17 Easing trade tensions and disinflation are setting the stage for more rate cuts
US, China trade policy uncertainty indices; Money market estimates of rate cuts over 12 months
Top macro questions
Will the US avoid a recession?
The US economy is likely to slow well below its 1.8% y/y long-term trend growth rate but avoid a recession. Uncertainty around trade, immigration and fiscal policy has hurt consumer and business confidence in recent months, especially after the imposition of ‘Liberation Day’ (2 April) import tariffs. Although there was a pause on most tariffs until 9 July after the market turmoil, the US average effective tariff rate, after factoring in consumption shifts, is at 14.5%, the highest since 1938. This is likely to hurt growth and lift inflation in the coming months, with expectations of higher inflation keeping the Fed from cutting rates until September.
Our base case: The latest thaw in US-China trade relations has reduced the risk of an all-out global trade war. The next focus is an agreement between the US and the European Union before the 9 July deadline – an extension looks likely. Our base case is that most of the world will follow the US-UK trade pact and agree to a 10% baseline US import tariff, with higher sectoral tariffs on strategic sectors such as steel, aluminium and semiconductors. Imports from China are likely to attract a higher tariff rate, around 30%.
Modest fiscal stimulus, deregulation. As concerns about an all-out trade war fade, US policy focus is shifting to passing a mildly stimulating budget for the next fiscal year. We expect the final budget to extend prior personal tax cuts and give tax incentives to companies to invest domestically. This would lift the US fiscal deficit to around 7% of GDP in the remaining years of the Trump administration from last year’s 6.4%, providing a marginally positive fiscal impulse.
While bond markets are likely to push back against an easier fiscal stance in a non-recessionary economy, backstops, such as Treasury buybacks of government bonds and re-incentivising domestic commercial banks to hold government debt, can keep bond yields in check. Once the budget is passed, potentially by July or August, the focus is likely to shift to deregulation of the banking, energy and other critical economic sectors. These measures, combined with a weaker USD and the Fed resuming rate cuts in Q3 25, are likely to revive consumer and business confidence and investment by 2026.
Near-term risks: There is a risk that higher tariffs and policy uncertainty could worsen an ongoing cyclical downturn. The US job market is slowing as companies curtail hiring. The job openings rate now almost matches the jobless rate for the first time since the pandemic. There is a risk of a rise in layoffs if corporate profit margins take a hit due to tariffs. We expect the Fed to accelerate rate cuts if the job market slows sharply, helping avoid a severe downturn. Other risk factors include a temporary surge in bond yields and a sharp drop in the USD if the government passes some of the extreme tax cut proposals. A sustained rise in oil prices due to the Middle East crisis – raising inflation expectations and delaying Fed rate cuts – are additional tail risks.
Will Germany’s fiscal stimulus lift Euro area growth?
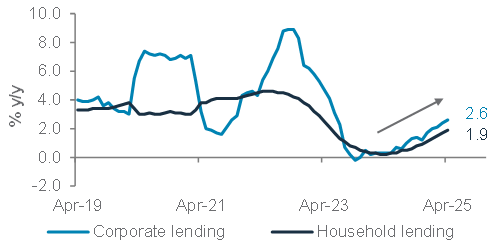
We expect Germany’s fiscal spending plans to lift Euro area growth by 0.3-0.5ppt from 2026. Additional defence spending by Euro area members could lift the region’s potential growth, narrowing the EU’s growth gap with the US. The new German coalition government is pursuing its infrastructure and defence spending plans, which has the potential to lift Germany’s annual growth by as much as 2ppt over the coming decade. Since Germany accounts for a quarter of the Euro area economy, this alone translates into a 0.3-0.5% lift to regional growth, depending on the pass-through effects of the stimulus. We expect the stimulus to lift growth from 2026. Given this expected upturn, we see the ECB pausing after cutting its policy rate by 25bps to 1.75% in Q3 25.
Is China’s economy turning around?
China’s planned fiscal stimulus for 2025, amounting to almost 2% of GDP, is already starting to filter through to the real economy. Retail sales growth accelerated to a 17-month high in May as front-loaded consumer goods trade-in programmes took effect. Meanwhile, the front-loading of exports ahead of US tariffs also supported the industrial sector. Although the latest thaw in US-China trade relations is a relief, we expect both these positive drivers to fade in H2 25. Besides, the property sector remains weak, with property investment contracting almost 11% y/y from January to May, sustaining deflationary pressures. We expect authorities to continue fiscal and credit stimulus in H2 25 to ensure the economy achieves the 5% full-year growth target.
Fig. 18 US vs. Euro area growth gap is narrowing
US and Euro area consensus growth, 2025-2027 estimates
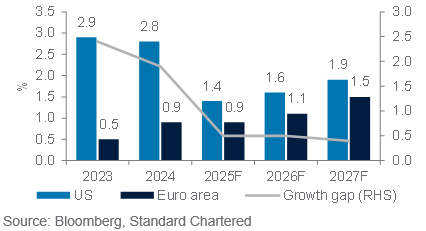
Fig. 19 ECB rate cuts are reviving Euro area lending
Euro area household and corporate lending growth
Asset Classes
Bonds – at a glance
|
|
||||
|
Key themes
Foundation: Global bonds are a core allocation in our portfolios. There is a ‘tug of war’ on yields, with expectations of Fed rate cuts counteracting concerns about the US budget deficit. We expect the 10-year US bond yield to move lower to 4.00-4.25% in 6-12 months, but would utilise any rebound above 4.50% as an attractive opportunity to add exposure. We believe 5-7-year bond maturities offer the best risk-adjusted returns by striking a balance between attractive yields and fiscal/inflation risks.
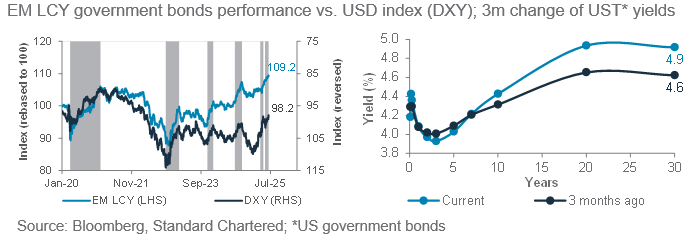
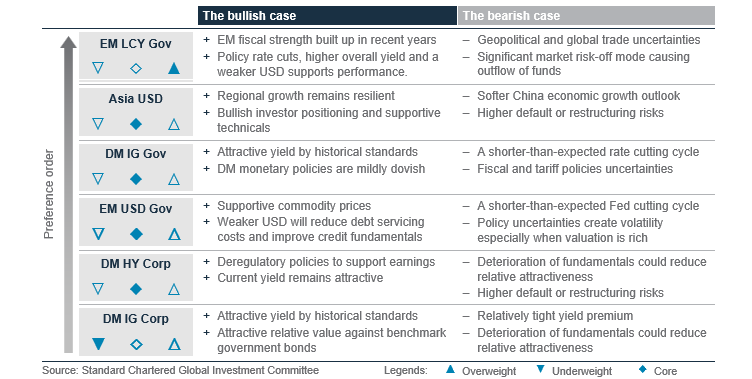
We upgrade Emerging Market (EM) local currency (LCY) government bonds to an Overweight. Benign local inflation and relatively strong fiscal positions are leading to high real (net-of-inflation) yields. Our expectation of a weaker USD is also supportive. Moreover, the asset class has low correlation with Developed Markets (DMs), providing diversification benefits. We downgrade DM Investment Grade (IG) corporate bonds to an Underweight owing to tight valuations and risks of widening yield premia stemming from uncertainties around US growth.
New opportunistic idea: We turn bullish on EM Asia LCY bonds. Other opportunistic ideas: We remain bullish on UK government bonds (FX-unhedged) and US Treasury Inflation-Protected Securities (TIPS).
Key chart
We expect EM LCY government bonds to benefit from monetary policy easing cycles, benign inflation and relatively strong fiscal positioning. A weaker USD also supports the case
Fig. 20 Weak USD supports EM LCY bonds. Medium-term US bonds outperformed
Overweight EM LCY government bonds
We are upgrading EM LCY government bonds to Overweight. EM central banks are more inclined to cut rates in a benign inflation environment. Furthermore, many EM economies have bolstered their fiscal and current accounts in recent years. We expect a weaker USD. However, we acknowledge that EMs remain susceptible to market volatility and geopolitical uncertainty, with weaker US demand and higher tariffs posing significant risks to these economies.
We initiate a new opportunistic bullish idea on EM Asia LCY bonds. A weaker USD is likely to lead to increased fund flows into Asia local currency bonds. EM Asia LCY bonds provide diversification benefits, with a low-to-moderate correlation with major DM bonds.
Underweight DM IG corporate bonds
Inflows into IG bonds are slowing. The yield premium on DM IG corporate bonds is tight relative to historical averages. The premium has fully retraced from the wide levels observed after ‘Liberation Day’. We believe this tight valuation makes DM IG corporate bonds susceptible to yield premium widening, leading to underperformance vs. DM IG government bonds as uncertainties surrounding US growth persist.
DM IG government bonds are core holding (Neutral allocation)
Major DM central banks still have room to cut policy rates as growth data slows. This can support the sub-asset class and help short-end yields move lower once current US tariff and spending worries abate. However, government bonds are more sensitive to interest rate volatility, and thus, one needs to balance the return against volatility.
Taking this into account, the 5-7-year bond maturity profile offers the best risk-adjusted returns by balancing the exposure to attractive yields and potential price gains from falling yields with avoiding excessive exposure to inflation or deficit risks associated with very-long maturities. We recommend an overweight allocation to 5-7-year bond maturities, expecting them to outperform longer-dated bonds on a risk-adjusted basis.
DM HY corporate bonds are core holding (Neutral allocation)
Yield premia in DM HY corporate bonds have tightened from their wide levels after ‘Liberation Day’, but we are yet to see full retracement. Valuations are still rich, but there is investor demand for capturing the high yield, supported by low default expectations in an economic soft-landing scenario.
EM USD government bonds are core holding (Neutral allocation)
Bond yield premia are at the tighter end of the range since the ‘Liberation Day’ announcement. The asset class is susceptible to market volatility and geopolitical uncertainty. However, a weaker USD eases EM economies’ debt servicing costs. Additionally, stronger fiscal and current account positions in major EM economies reduce the need for offshore bond issuance.
Asia USD bonds are core holding (Neutral allocation)
EM Asia still faces vulnerabilities from US tariff risks. Like other markets, Asia bond valuations are expensive. However, the valuations are likely to remain elevated due to strong external balances, flexible monetary policy tools and robust refinancing capabilities in capital markets. Domestic demand is holding up, as seen from increasing allocation within Asia to new bond issuance.
Opportunistically bullish: US TIPS
The risk/reward is still attractive. Despite lower-than-expected US consumer and producer price inflation in May, fiscal and inflation uncertainty is likely to persist. The market now expects peak US inflation to be pushed to August this year, rather than being front-loaded. There is potential upside risk to longer-term inflation expectations given the following three possible scenarios: 1) US tariffs ultimately stabilising at a high average level, 2) trade deals lowering the average tariff level accompanied with stronger growth and 3) a spike in oil prices due to geopolitical tensions.
Opportunistically bullish: UK government bonds (Gilts, FX-unhedged)
We favour the nominal yield pick-up on Gilts over other DM government bonds. Recent UK labour market data indicates a deteriorating trend, which feeds through to weaker wage growth and contributes to disinflationary pressures. While inflation expectations may remain elevated in the near term, ongoing trade tensions and tight financial conditions should keep growth subdued and inflation in check. These factors would likely enable the BoE to cut rates. Additionally, we expect GBP gains to add to potential returns. Risks to this view include stronger-than-expected UK inflation, wage growth and significant GBP weakness.
Note: We closed our opportunistically bullish ideas for US 20-year-plus US government bonds and US Agency Mortgage-Backed Securities on 12 June and 19 June, with 3.7% and 4.4% holding period returns, respectively.
Equity – at a glance
|
|
||||
|
|
||||
Key themes
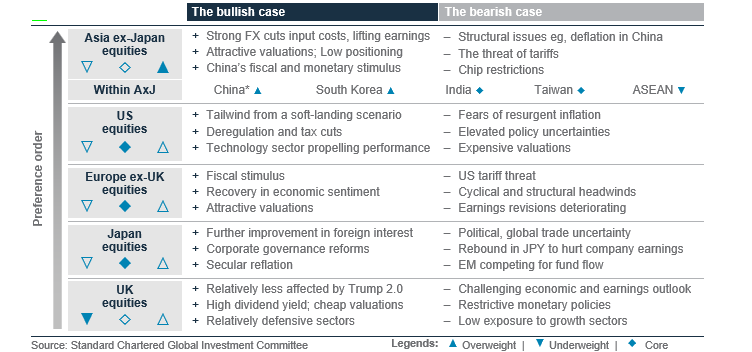
We remain Overweight global equities amid resilient fundamentals. The de-escalation of trade tensions continues and earnings growth is healthy, while inflation has remained under control so far, despite tariffs.
We upgrade Asia ex-Japan equities to an Overweight allocation. A weaker USD leads to more inflows into Emerging Markets (EMs). Valuations are appealing. We expect China and Korea equities to outperform within Asia ex-Japan. Korean equities have cheap valuations and good growth. The catalyst will come from fiscal expansion and market reforms from the new administration, which can narrow the Korean discount to other EMs. Chinese equities’ risk premium is subsiding – Beijing playing its ‘rare-earth’ card helped contain the trade war from escalating. India is a core holding. It is structurally attractive. Fiscal stimulus is a strong tailwind, although valuation is expensive.
We downgrade US equities to a core holding. Earnings is strong, but the ‘de-dollarisation’ narrative warrants a scaling back of excessive long positions. Europe ex-UK is a core holding. Rising fiscal spending is offset by tariff concerns.
Key chart
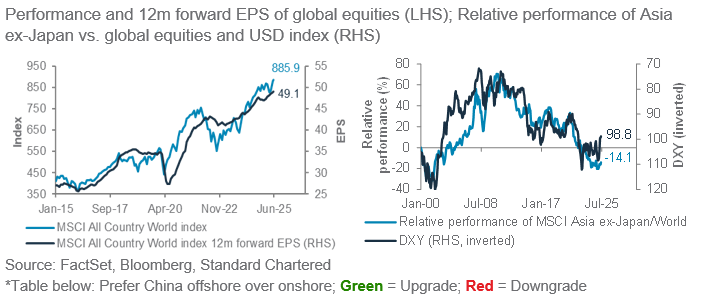
Stay Overweight global equities, rising earnings lends support
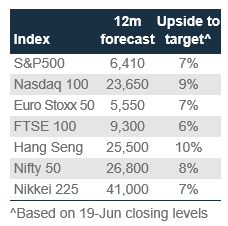
Fig. 21 Global equities continue to ride on strong fundamentals, including robust earnings, while equity flows and weak USD should propel Asia ex-Japan higher
Overweight Asia ex-Japan equities
We upgrade Asia ex-Japan equities to Overweight. The region benefits from strengthening currencies, which reduce input costs and boosts earnings. De-escalating trade tensions, and still-reasonable valuations are supportive factors.
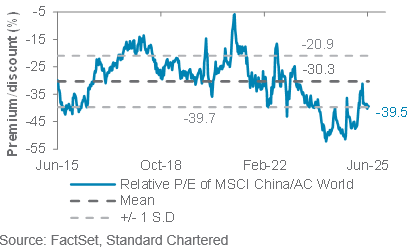
We retain our Overweight China allocation. China leveraged its ‘rare-earth’ card and de-escalated trade tensions with the US. Valuations are appealing, with the MSCI China index trading at c.40% discount to global equities. Fiscal policies can support corporate earnings growth. Within China, we are Overweight offshore equities relative to their onshore counterparts. Offshore equities have higher weightings in growth stocks, where we see upside potential due to their cheaper valuations compared to Europe and the US.
Fig. 22 China stocks still trade at significant discount to global equities
12m forward P/E of MSCI China index relative to MSCI ACWI index
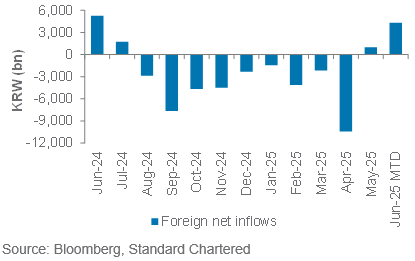
We upgrade Korea equities to Overweight. The newly-elected President Lee is expected to launch fiscal expansion and market reforms. This should drive Korea’s growth and equity returns. Valuations are compelling, with foreign flows turning positive in May after a prolonged period of outflows.
Fig. 23 Korea equity market saw foreign net inflows since May, reversing nine months of outflows
Foreign net inflows for Korean equities
We have a core allocation to India. The strong structural story remains. The one-off 50bps RBI policy rate cut, with lowered cash reserve ratio requirements for domestic banks, ensures good liquidity conditions in India. Fiscal policy now takes the baton in driving growth in the Indian economy. Valuation overall is expensive, and hence we favour large-cap over small-cap stocks amid greater margins of safety on earnings and valuations.
Taiwan is a core holding. Earnings is robust, but potential US import tariffs on semiconductor or AI-related products will affect earnings growth. We are Underweight ASEAN on weak EPS momentum and reduced investor positioning.
US equities – Core holding
We are downgrading US equities to a core holding. US stocks remain an integral part of investor portfolios, continuing to deliver strong ROE at 20.8%. Meanwhile, investor positioning is not crowded by historical standards. However, the ‘low hanging fruit’ rally from April lows has already played out, and the ‘de-dollarisation’ narrative may lead to outflows from US equities to the rest of the world. US equities continue to be expensive, with 12-month forward P/E of the MSCI US index at 21.9x, over 1 standard deviation above historical average.
Europe ex-UK equities – Core holding
Europe ex-UK equities is a core holding. Increasing fiscal spending plans and economic recovery across broader EU countries bolster investor sentiment. Elevated savings also suggest further room for consumer spending to accelerate. Nonetheless, trade tariffs and escalating geopolitical tensions, specifically Section 899, are near-term headwinds.
Japan equities – Core holding
Japan equities remain a core holding. Corporate governance reforms remain a catalyst, alongside increased share buybacks and acceleration of eliminating parent-subsidiary listings. Economic resilience and a reflationary environment should support growth across domestically exposed cyclical sectors. However, a stronger JPY can curtail earnings projections, given their exposure to foreign earnings.
UK equities – Underweight
We are Underweight UK equities. They are defensive, but earnings growth projections have moderated since the start of year, now standing at just 0.3% for 2025. Earnings revisions are also negative, showing a greater number of companies with earnings downgrades compared with upgrades. Following the region’s rally since the start of year, the valuation discount to its own history has closed. MSCI UK trades at 12-month forward P/E of 12.9x, around its historical average.
Equity opportunistic views
|
US: Taking profit selectively; rotating to Korea
Korea equities (new): The new President’s ‘Kospi 5,000’ campaign, fiscal expansion and corporate governance reforms can narrow the ‘Korean discount’. Fund flows have turned positive after a long series of monthly outflows. The valuation and growth mix is also favourable. Weaker-than-expected policy impact is a risk.
Closing US communication services: We are closing for a 27.9% gain (since 27 March 2024) ahead of potential market volatility as the US tariff pause expires on 9 July.
Closing US-listed semiconductors: We are closing for a 9.1% gain (since 22 May 2025) for similar reasons.
Fig. 24 Opportunistically bullish ideas
Open bullish ideas
US major banks: They benefit from expected deregulation in the banking sector, which can supportgreater share buybacks. A soft landing also benefits credit quality and loan demand. A sharp slowdown in the US economy is a risk.
US technology software: The industry remains relatively resilient against tariffs, helped by its strong pricing power. Artificial intelligence (AI) continues to support software development and enhance software products. Weakness in IT spending is a risk.
Europe banks: The ECB rate cuts and Germany’s fiscal stimulus lend tailwinds to growth, benefiting European banks, which generate two-thirds of revenue domestically. Europe banks continue to offer attractive dividends and share buybacks. A sharp slowdown in Europe’s economy is a risk.
Europe industrials: Europe’s plans to boost infrastructure and defence spending support the aerospace and defence, electrical equipment and machinery industries. A sharp slowdown in Europe’s economy is a risk.
China non-financial high-dividend state-owned enterprises (SOEs): Their predominantly domestic exposure means they should benefit from the government’s stimulus to stabilise growth. Non-financial SOEs are less exposed to the troubled property sector. Adverse regulatory changes are a risk.
Hang Seng technology: Policymakers’ support for AI and technology development underpin the growth outlook. Valuations remain cheap compared with their US counterparts. Weaker-than-expected stimulus is a risk.
Sector views: Remaining constructive
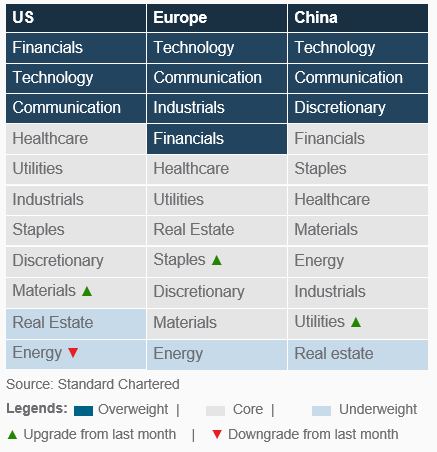
We remain constructive, with an Overweight on technology in the US, Europe and China. We also remain Overweight on financials and communication services in the US. We downgrade energy to Underweight, as we expect oil prices to trend lower with excess capacity and limited disruptions to oil supply. In Europe, we upgrade staples to core ahead of potential market volatility as the US tariff pause expires on 9 July. Similarly, we upgrade utilities in China to core to have more defensive cover. We maintain exposure to improving consumption and AI adoption in China, with our preference for technology, communication and discretionary.
Fig. 25 Our sector views by region
FX – at a glance
|
Key themes
Cyclical factors should result in a weaker USD over the next 6-12 months. Since April, much attention has been focused on the structural risk of ‘de-dollarisation’ of the global economy. Nevertheless, we expect the USD to remain under pressure from shorter-term cyclical factors over H2. Key drivers include the USD’s still-elevated valuation, the potential for narrowing rate differentials as the Fed cuts rates and uncertain US trade policy. Excessive short positioning may limit weakness over the next 1-3 months, but this is unlikely to be a constraint over a longer 6-12-month horizon.
The EUR, and JPY are likely to be winners from a weak USD, with the GBP also showing resilience. German fiscal policy is expected to loosen, with increased defence spending and additional expenditure from the new infrastructure fund. Germany’s cabinet has already approved a EUR 46bn package of tax breaks for companies to spur growth. We expect EUR/USD to trade at 1.16 in 3 months and at 1.17 in 12 months. In Japan, domestic investors hold most of the government debt, insulating the debt burden to some extent from global financial markets. This is in contrast to the US, where foreign investors hold a significant portion of government debt. We believe Japan’s fiscal outlook will push USD/JPY to 144 in 3 months and to 140 in 12 months. The CHF is likely to stay rangebound as low domestic rates balance against USD weakness.
Key chart
Tariff concerns and a reduced preference for US assets amid US policy uncertainty meant the USD is decoupling from the signal from rate differentials
Fig. 26 USD has fallen more than what is justified by rate differentials; FX forecast table
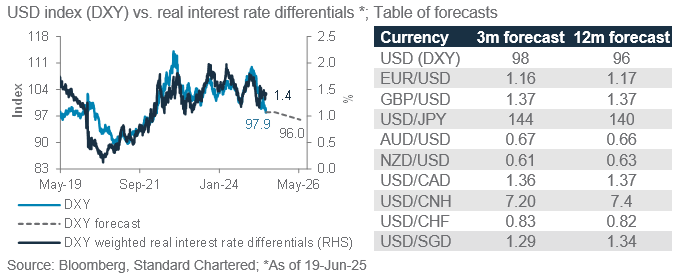
Fig. 27 Summary of major currency drivers
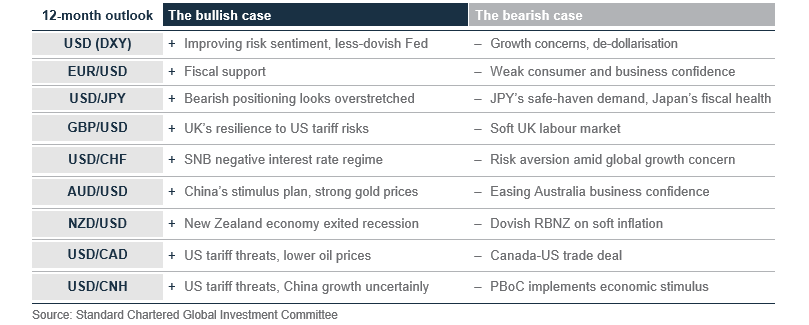
Currency outlook under de-dollarisation risk
European currency outlook: Bullish EUR/USD, stable GBP/USD. Besides Euro area’s improving fiscal outlook, we see EUR/USD benefitting from a less-dovish ECB. President Lagarde signalled an end to the ECB’s monetary policy easing cycle after reducing rates by 200bps over eight meetings. Lagarde emphasised the role of the EUR as a global reserve currency amid ongoing global economic rebalancing. On the trade front, Euro area officials believe that the US tariff deadline (9 July) will be extended. In the UK, sustained retail sales growth since 2022 indicates that consumption is well supported. However, the BoE is likely to continue lowering rates this year amid slowing wage growth and a cooling job market. We expect the GBP to remain stable around 1.37 vs. the USD over the next 12 months.
Fig. 28 Looking for USD/JPY downside, support at 140
USD/JPY and key moving averages
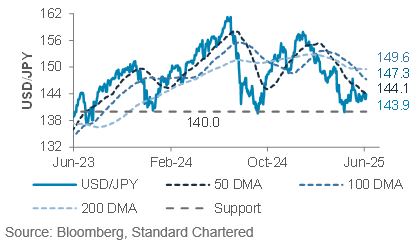
Safe haven currencies’ outlook: Stable USD/CHF, bearish USD/JPY. The SNB has already cut 175bps in this cycle to counter local deflationary pressures. The rate cuts are helping offset safe haven demand for the CHF, helping stabilise USD/CHF in recent months. The broader environment (Swiss external surpluses, its geopolitical neutrality, a disciplined fiscal stance) is continuing to support USD/CHF around the 0.82-0.83 range. Meanwhile, the JPY may strengthen further due to diverging rate expectations between the US and Japan and increasing safe-haven demand for JPY (refer to p.20).
Commodity currencies’ outlook: Stable AUD/USD, bullish NZD/USD, stable USD/CAD. AUD/USD is expected to draw modest support from elevated commodity prices and a broadly softer USD. However, the upside remains capped by
mounting global uncertainty and concerns over Australia’s weakening domestic outlook, particularly in the labour market, where strong supply contrasts with slowing job growth. In New Zealand, the RBNZ is expected to lower the official cash rate to 3% by end-2025. However, we see NZD/USD around 0.61 in the next 1-3 months, and 0.63 over the next 12 months as the pair is expected to receive support from strong growth in retail spending and manufacturing output. Construction, which had been a drag in recent quarters, levelled out at the start of 2025. We see USD/CAD stabilising at 1.36-1.37. The recent decline in USD/CAD likely reflects the USD’s weakness instead of any improvement in Canada’s outlook. With no hawkish bias from the BoC, we expect USD/CAD to stay rangebound.
Fig. 29 SGD’s nominal effective exchange rate (SGD NEER) is likely to ease along with cooling inflation
SGD nominal exchange rate and policy band
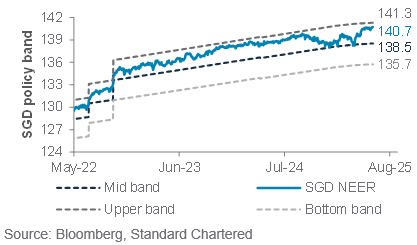
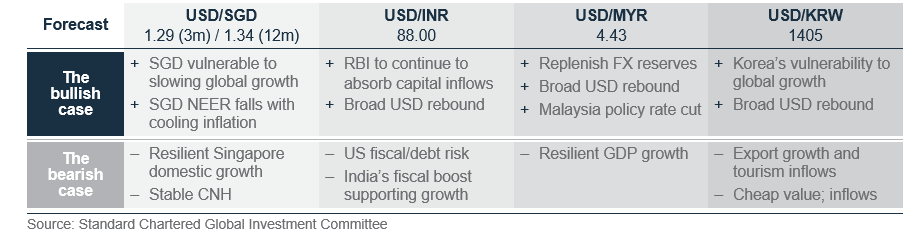
Asian currencies’ outlook: Bullish USD/SGD and USD/CNH. Singapore’s exports fell in May, signalling that the earlier front-loading of US demand to avoid tariffs is fading. Growth momentum is expected to slow further. Despite delayed US tariffs and a temporary US-China trade truce, we expect a material slowdown in Singapore’s growth. With the SGD NEER near the strong end of its policy band, we expect USD/SGD to rise to 1.29 in 3 months, and 1.34 in 12 months. China’s stimulus lifted retail sales growth to a one-year high. We see USD/CNH around 7.20 in 1-3 months, although trade risks could lift it to 7.40 in 12 months. A weaker USD and depressed HKD rates make the HKD interesting from a funding perspective. The main risk to this is a break in the USD-HKD peg, but history suggests this is highly unlikely.
Fig. 30 Summary of Asian currency drivers
Gold, crude oil – at a glance
|
|
||||
Key themes
Gold has limited near-term upside if Middle East tensions stay contained, but remains a key strategic hedge. We raise our 3-month price expectation to USD 3,400, but leave our 12-month expectation unchanged at USD 3,500.
Oversupply remains the dominating theme in oil markets. We expect West Texas Intermediate (WTI) oil prices to trade in a range around USD 65/bbl over the next 3-12 months. Geopolitical risks may result in temporary spikes in oil prices.
Key chart
Fig. 31 Gold remains an essential hedge against ‘de-dollarisation’
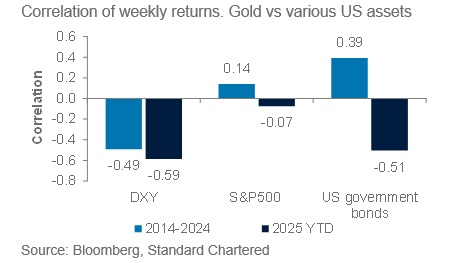
Fig. 33 Tensions in the Middle East could see gold-oil ratio decline
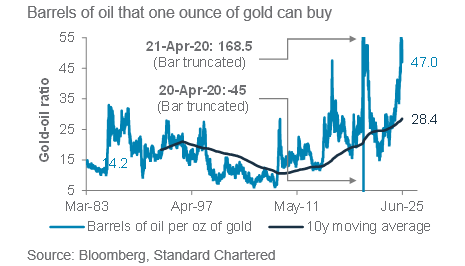
Fig. 32 Positioning in gold is now slightly bearish, suggesting room for return of long positions
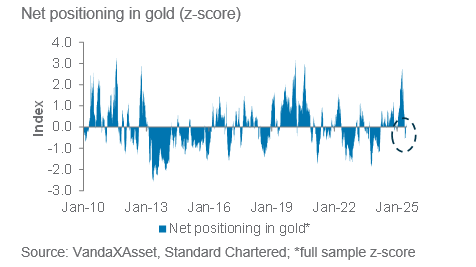
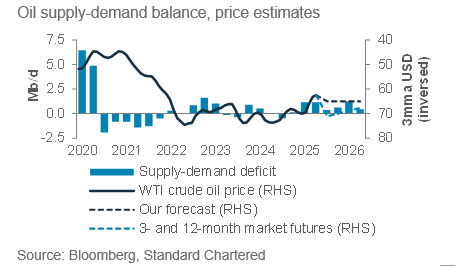
Fig. 34 The oil market is likely to remain in surplus this year, keeping prices in check
Gold outlook: Gold is hovering near record highs amid geopolitical tensions, and with positioning now also more Neutral, there is room for renewed inflows. Moreover, with key risks looming in July – including the expiration of the US’s 90-day tariff pause and the anticipated passing of Trump’s fiscal bill – gold remains a vital hedge against the building narrative of ‘de-dollarisation’ and market volatility. Still, barring extreme outcomes, further upside may be limited in the near-term, given the sharp rally seen already this year. We retain gold as a
core allocation and see gold as having transitioned to a higher price regime above USD 3,000 for the rest of 2025.
Oil outlook: A standalone demand-supply outlook continues to argue for an oversupplied oil market, which is behind our USD 65/bbl forecast for WTI over 6-12 months. Geopolitics is a clear upside risk – while the extent of excess supply and OPEC+ spare capacity can help offset this, near-term spikes in prices cannot be ruled out. See page 5 for more.
Additional perspectives
Quant perspective
Neutral equities
|
|
||||
Summary
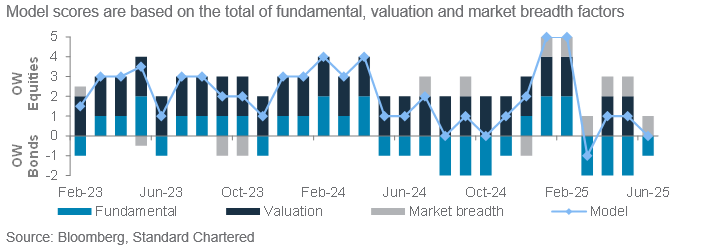
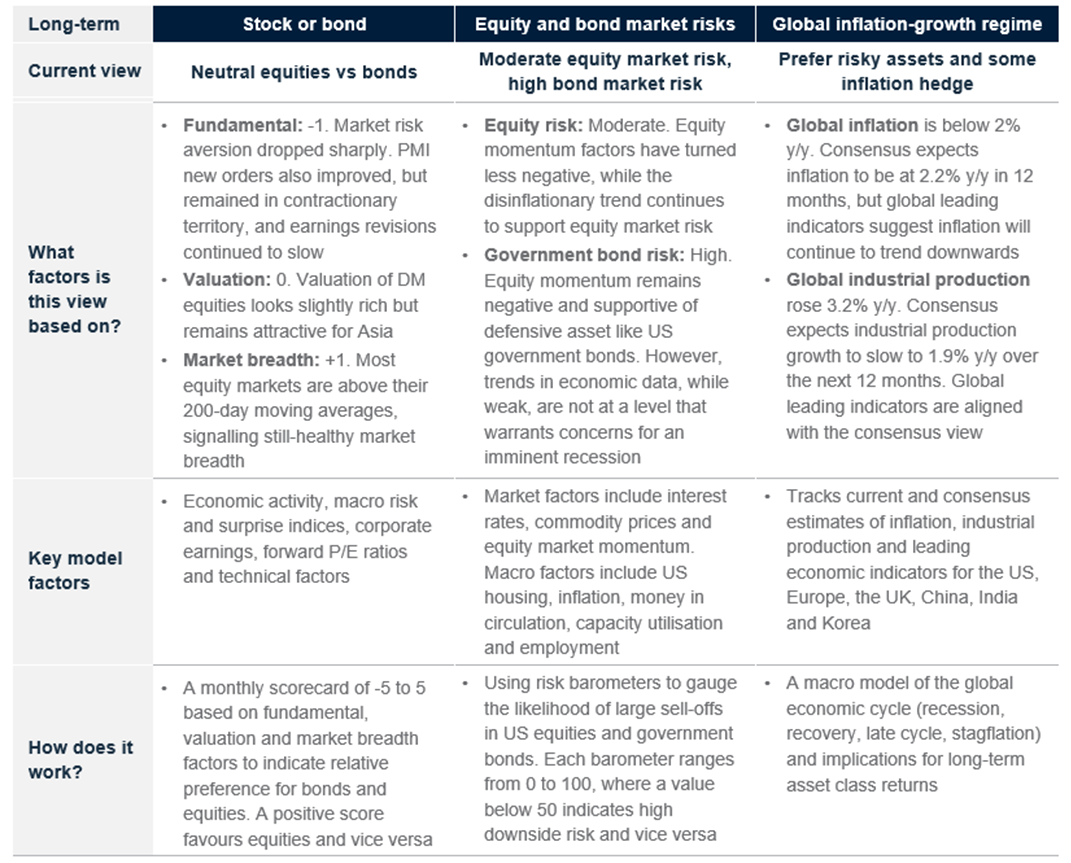
Our stock-bond model turned Neutral as gains in several major equity markets slowed after hitting key resistance levels. Fundamental factors improved slightly in June, starting with market risk aversion falling sharply since its peak in April and now being below historical average. The economic surprise index, which measures the number of positive surprises in economic data, has also turned slightly positive. However, valuations for Developed Market (DM) equities now look slightly rich, more than offsetting the improvement in fundamentals. The changes led to a drop in the model’s score from 1 to 0, which is Neutral for equities and bonds. The model’s year-to-date return stands at 5.3%, lagging the 60/40 equity/bond benchmark by 1.4% due to poor equity market performance in Q1 25. The model’s long-term performance (since February 2023) remains strong, standing at 39% in absolute return, delivering 3.9% alpha (outperformance).
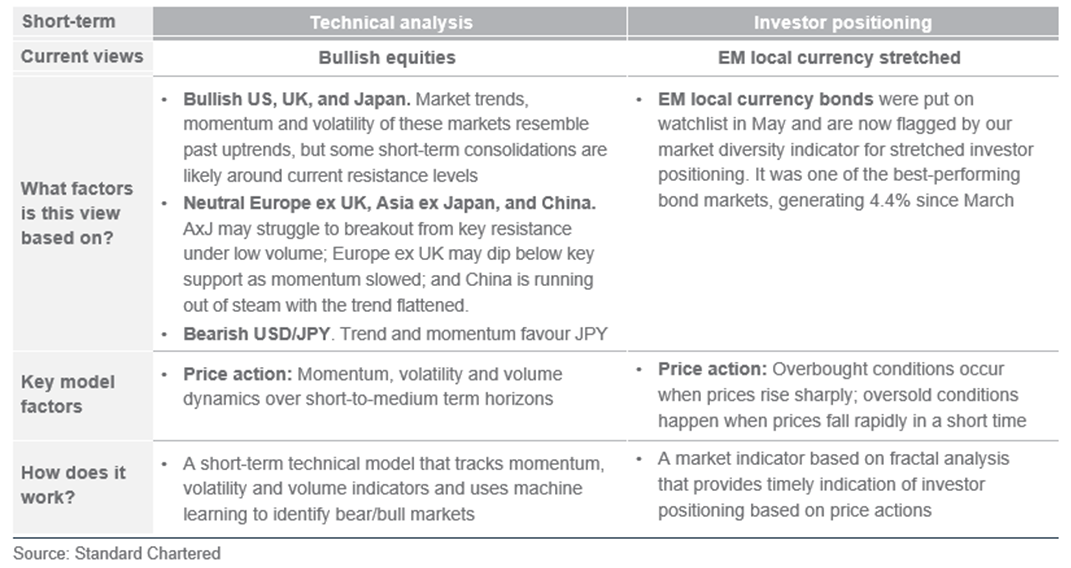
Our technical framework is bullish on most equity markets over the next three months. Risks of short-term consolidation is likely, as gains in many markets have started to slow after hitting their key resistance levels. However, our models remain broadly bullish on equities over a three-month horizon as market trends remain favourable and market volatility has subsided significantly since their April highs. Our market regime indicators point to greater similarity to historical periods when equities are in uptrend. Our models are currently bullish on US, UK and Japan, and Neutral on Europe ex UK, Asia ex Japan and China.
Emerging Market (EM) local currency (LCY) bonds face risk of short-term reversal amid stretched positions. EM LCY bonds have generated 4.4% return since March, beating Global High Yield and DM Investment Grade credits. Our market diversity indicator now suggests that investor positioning in EM LCY is stretched and the risk of a short-term reversal has risen.
Key chart
Our stock-bond model score dropped from +1 to 0 (out of 5), despite improvements in fundamentals, as the valuation component deteriorated
Fig. 35 Our stock vs. bond rotation model has turned neutral again
Our technical model retains a bullish-bias view on the S&P500, with first resistance/ support at 6,104/ 5,812
Fig. 36 Our technical model turned bullish on S&P500 in early May
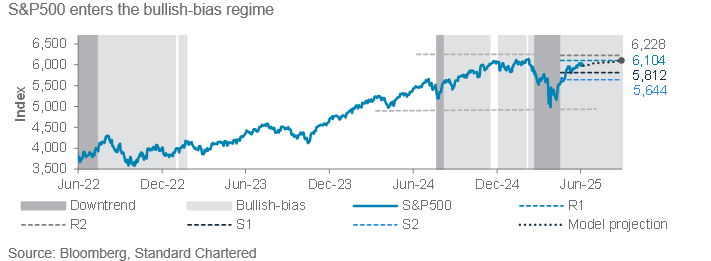
Fig. 37 Long-term quantitative models are neutral risky assets, while short-term models are bullish
Long-term models below have a typical time horizon of 3-6 months, while short-term models have a 1-3-month horizon
Performance review
Foundation: Asset allocation summary
Foundation+: Asset allocation summary
Market performance summary
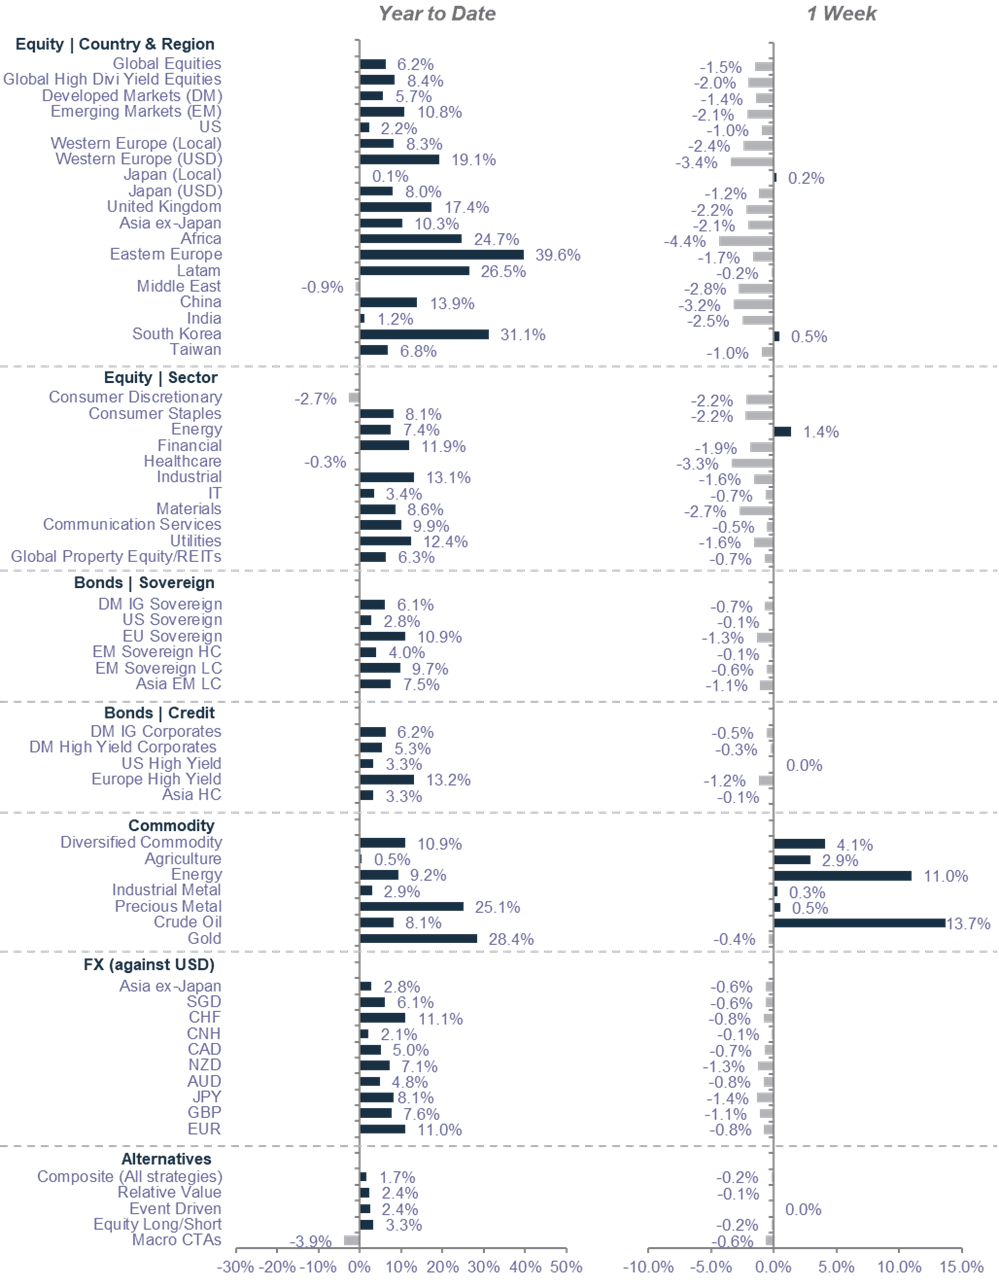
Source: MSCI, JPMorgan, Citigroup, Dow Jones, HFRX, FTSE, Bloomberg, Standard Chartered
*All performance shown in USD terms, unless otherwise stated
*YTD performance data from 31 December 2024 to 19 June 2025; 1-week performance from 12 to 19 June 2025
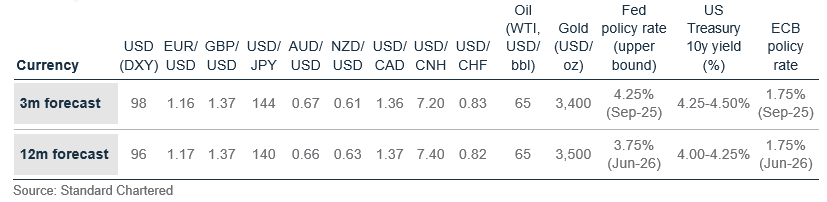
Our key forecasts and calendar events
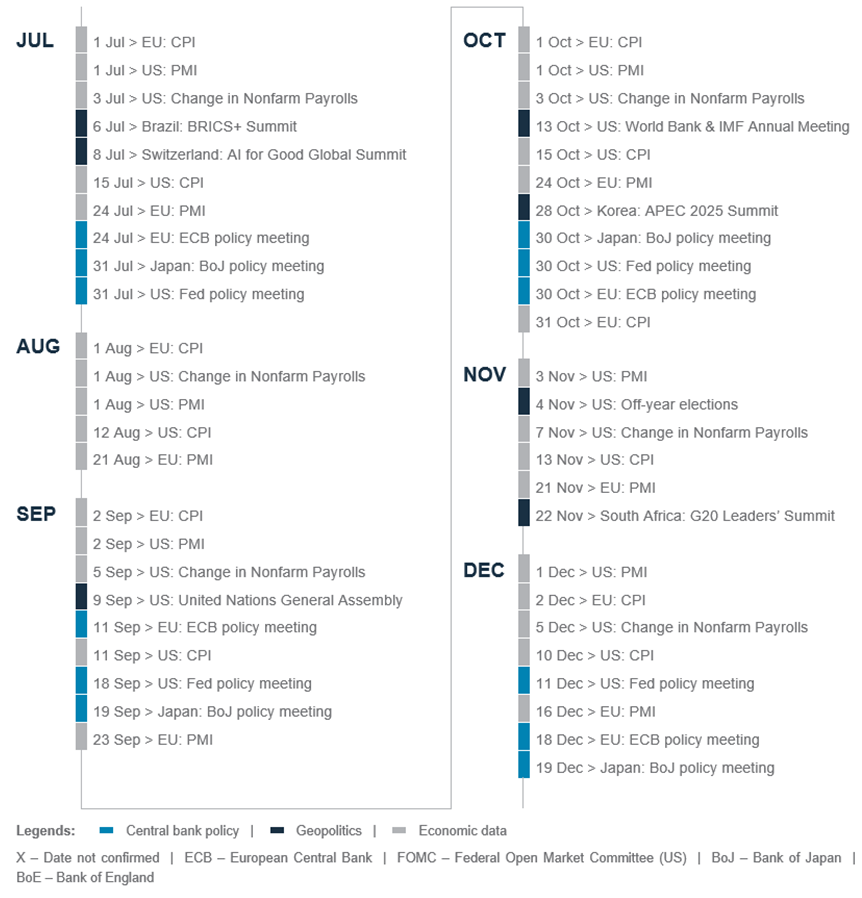
Today, Tomorrow and Forever


Explanatory notes
The figures on page 5 show allocations for a moderately aggressive risk profile only – different risk profiles may produce significantly different asset allocation results. Page 5 is only an example, provided for general information only and they do not constitute investment advice, an offer, recommendation or solicitation. They do not take into account the specific investment objectives, needs or risk tolerances of a particular person or class of persons and they have not been prepared for any particular person or class of persons.
Contingent Convertibles are complex financial instruments and are not a suitable or appropriate investment for all investors. This document is not an offer to sell or an invitation to buy any securities or any beneficial interests therein. Contingent convertible securities are not intended to be sold and should not be sold to retail clients in the European Economic Area (EEA) (each as defined in the Policy Statement on the Restrictions on the Retail Distribution of Regulatory Capital Instruments (Feedback to CP14/23 and Final Rules) (“Policy Statement”), read together with the Product Intervention (Contingent Convertible Instruments and Mutual Society Shares) Instrument 2015 (“Instrument”, and together with the Policy Statement, the “Permanent Marketing Restrictions”), which were published by the United Kingdom’s Financial Conduct Authority in June 2015), other than in circumstances that do not give rise to a contravention of the Permanent Marketing Restrictions.
Disclosure
This document is confidential and may also be privileged. If you are not the intended recipient, please destroy all copies and notify the sender immediately. This document is being distributed for general information only and is subject to the relevant disclaimers available at our Standard Chartered website under Regulatory disclosures. It is not and does not constitute research material, independent research, an offer, recommendation or solicitation to enter into any transaction or adopt any hedging, trading or investment strategy, in relation to any securities or other financial instruments. This document is for general evaluation only. It does not take into account the specific investment objectives, financial situation or particular needs of any particular person or class of persons and it has not been prepared for any particular person or class of persons. You should not rely on any contents of this document in making any investment decisions. Before making any investment, you should carefully read the relevant offering documents and seek independent legal, tax and regulatory advice. In particular, we recommend you to seek advice regarding the suitability of the investment product, taking into account your specific investment objectives, financial situation or particular needs, before you make a commitment to purchase the investment product. Opinions, projections and estimates are solely those of SC at the date of this document and subject to change without notice. Past performance is not indicative of future results and no representation or warranty is made regarding future performance. The value of investments, and the income from them, can go down as well as up, and you may not recover the amount of your original investment. You are not certain to make a profit and may lose money. Any forecast contained herein as to likely future movements in rates or prices or likely future events or occurrences constitutes an opinion only and is not indicative of actual future movements in rates or prices or actual future events or occurrences (as the case may be). This document must not be forwarded or otherwise made available to any other person without the express written consent of the Standard Chartered Group (as defined below). Standard Chartered Bank is incorporated in England with limited liability by Royal Charter 1853 Reference Number ZC18. The Principal Office of the Company is situated in England at 1 Basinghall Avenue, London, EC2V 5DD. Standard Chartered Bank is authorised by the Prudential Regulation Authority and regulated by the Financial Conduct Authority and Prudential Regulation Authority. Standard Chartered PLC, the ultimate parent company of Standard Chartered Bank, together with its subsidiaries and affiliates (including each branch or representative office), form the Standard Chartered Group. Standard Chartered Private Bank is the private banking division of Standard Chartered. Private banking activities may be carried out internationally by different legal entities and affiliates within the Standard Chartered Group (each an “SC Group Entity”) according to local regulatory requirements. Not all products and services are provided by all branches, subsidiaries and affiliates within the Standard Chartered Group. Some of the SC Group Entities only act as representatives of Standard Chartered Private Bank and may not be able to offer products and services or offer advice to clients.
Copyright © 2026, Accounting Research & Analytics, LLC d/b/a CFRA (and its affiliates, as applicable). Reproduction of content provided by CFRA in any form is prohibited except with the prior written permission of CFRA. CFRA content is not investment advice and a reference to or observation concerning a security or investment provided in the CFRA SERVICES is not a recommendation to buy, sell or hold such investment or security or make any other investment decisions. The CFRA content contains opinions of CFRA based upon publicly-available information that CFRA believes to be reliable and the opinions are subject to change without notice. This analysis has not been submitted to, nor received approval from, the United States Securities and Exchange Commission or any other regulatory body. While CFRA exercised due care in compiling this analysis, CFRA, ITS THIRD-PARTY SUPPLIERS, AND ALL RELATED ENTITIES SPECIFICALLY DISCLAIM ALL WARRANTIES, EXPRESS OR IMPLIED, INCLUDING, BUT NOT LIMITED TO, ANY WARRANTIES OF MERCHANTABILITY OR FITNESS FOR A PARTICULAR PURPOSE OR USE, to the full extent permitted by law, regarding the accuracy, completeness, or usefulness of this information and assumes no liability with respect to the consequences of relying on this information for investment or other purposes. No content provided by CFRA (including ratings, credit-related analyses and data, valuations, model, software or other application or output therefrom) or any part thereof may be modified, reverse engineered, reproduced or distributed in any form by any means, or stored in a database or retrieval system, without the prior written permission of CFRA, and such content shall not be used for any unlawful or unauthorized purposes. CFRA and any third-party providers, as well as their directors, officers, shareholders, employees or agents do not guarantee the accuracy, completeness, timeliness or availability of such content. In no event shall CFRA, its affiliates, or their third-party suppliers be liable for any direct, indirect, special, or consequential damages, costs, expenses, legal fees, or losses (including lost income or lost profit and opportunity costs) in connection with a subscriber’s, subscriber’s customer’s, or other’s use of CFRA’s content.
Market Abuse Regulation (MAR) Disclaimer
Banking activities may be carried out internationally by different branches, subsidiaries and affiliates within the Standard Chartered Group according to local regulatory requirements. Opinions may contain outright “buy”, “sell”, “hold” or other opinions. The time horizon of this opinion is dependent on prevailing market conditions and there is no planned frequency for updates to the opinion. This opinion is not independent of Standard Chartered Group’s trading strategies or positions. Standard Chartered Group and/or its affiliates or its respective officers, directors, employee benefit programmes or employees, including persons involved in the preparation or issuance of this document may at any time, to the extent permitted by applicable law and/or regulation, be long or short any securities or financial instruments referred to in this document or have material interest in any such securities or related investments. Therefore, it is possible, and you should assume, that Standard Chartered Group has a material interest in one or more of the financial instruments mentioned herein. Please refer to our Standard Chartered website under Regulatory disclosures for more detailed disclosures, including past opinions/ recommendations in the last 12 months and conflict of interests, as well as disclaimers. A covering strategist may have a financial interest in the debt or equity securities of this company/issuer. All covering strategist are licensed to provide investment recommendations under Monetary Authority of Singapore or Hong Kong Monetary Authority. This document must not be forwarded or otherwise made available to any other person without the express written consent of Standard Chartered Group.
Sustainable Investments
Any ESG data used or referred to has been provided by Morningstar, Sustainalytics, MSCI or Bloomberg. Refer to 1) Morningstar website under Sustainable Investing, 2) Sustainalytics website under ESG Risk Ratings, 3) MCSI website under ESG Business Involvement Screening Research and 4) Bloomberg green, social & sustainability bonds guide for more information. The ESG data is as at the date of publication based on data provided, is for informational purpose only and is not warranted to be complete, timely, accurate or suitable for a particular purpose, and it may be subject to change. Sustainable Investments (SI): This refers to funds that have been classified as ‘ESG Intentional Investments – Overall’ by Morningstar. SI funds have explicitly stated in their prospectus and regulatory filings that they either incorporate ESG factors into the investment process or have a thematic focus on the environment, gender diversity, low carbon, renewable energy, water or community development. For equity, it refers to shares/stocks issued by companies with Sustainalytics ESG Risk Rating of Low/Negligible. For bonds, it refers to debt instruments issued by issuers with Sustainalytics ESG Risk Rating of Low/Negligible, and/or those being certified green, social, sustainable bonds by Bloomberg. For structured products, it refers to products that are issued by any issuer who has a Sustainable Finance framework that aligns with Standard Chartered’s Green and Sustainable Product Framework, with underlying assets that are part of the Sustainable Investment universe or separately approved by Standard Chartered’s Sustainable Finance Governance Committee. Sustainalytics ESG risk ratings shown are factual and are not an indicator that the product is classified or marketed as “green”, “sustainable” or similar under any particular classification system or framework.
Country/Market Specific Disclosures
Bahrain: This document is being distributed in Bahrain by Standard Chartered Bank, Bahrain Branch, having its address at P.O. 29, Manama, Kingdom of Bahrain, is a branch of Standard Chartered Bank and is licensed by the Central Bank of Bahrain as a conventional retail bank. Botswana: This document is being distributed in Botswana by, and is attributable to, Standard Chartered Bank Botswana Limited which is a financial institution licensed under the Section 6 of the Banking Act CAP 46.04 and is listed in the Botswana Stock Exchange. Brunei Darussalam: This document is being distributed in Brunei Darussalam by, and is attributable to, Standard Chartered Bank (Brunei Branch) | Registration Number RFC/61 and Standard Chartered Securities (B) Sdn Bhd | Registration Number RC20001003. Standard Chartered Bank is incorporated in England with limited liability by Royal Charter 1853 Reference Number ZC18. Standard Chartered Securities (B) Sdn Bhd is a limited liability company registered with the Registry of Companies with Registration Number RC20001003 and licensed by Brunei Darussalam Central Bank as a Capital Markets Service License Holder with License Number BDCB/R/CMU/S3-CL and it is authorised to conduct Islamic investment business through an Islamic window. China Mainland: This document is being distributed in China by, and is attributable to, Standard Chartered Bank (China) Limited which is mainly regulated by National Financial Regulatory Administration (NFRA), State Administration of Foreign Exchange (SAFE), and People’s Bank of China (PBOC). Hong Kong: In Hong Kong, this document, except for any portion advising on or facilitating any decision on futures contracts trading, is distributed by Standard Chartered Bank (Hong Kong) Limited (“SCBHK”), a subsidiary of Standard Chartered PLC. SCBHK has its registered address at 32/F, Standard Chartered Bank Building, 4-4A Des Voeux Road Central, Hong Kong and is regulated by the Hong Kong Monetary Authority and registered with the Securities and Futures Commission (“SFC”) to carry on Type 1 (dealing in securities), Type 4 (advising on securities), Type 6 (advising on corporate finance) and Type 9 (asset management) regulated activity under the Securities and Futures Ordinance (Cap. 571) (“SFO”) (CE No. AJI614). The contents of this document have not been reviewed by any regulatory authority in Hong Kong and you are advised to exercise caution in relation to any offer set out herein. If you are in doubt about any of the contents of this document, you should obtain independent professional advice. Any product named herein may not be offered or sold in Hong Kong by means of any document at any time other than to “professional investors” as defined in the SFO and any rules made under that ordinance. In addition, this document may not be issued or possessed for the purposes of issue, whether in Hong Kong or elsewhere, and any interests may not be disposed of, to any person unless such person is outside Hong Kong or is a “professional investor” as defined in the SFO and any rules made under that ordinance, or as otherwise may be permitted by that ordinance. In Hong Kong, Standard Chartered Private Bank is the private banking division of SCBHK, a subsidiary of Standard Chartered PLC. Ghana: Standard Chartered Bank Ghana Limited accepts no liability and will not be liable for any loss or damage arising directly or indirectly (including special, incidental or consequential loss or damage) from your use of these documents. Past performance is not indicative of future results and no representation or warranty is made regarding future performance. You should seek advice from a financial adviser on the suitability of an investment for you, taking into account these factors before making a commitment to invest in an investment. To unsubscribe from receiving further updates, please send an email to feedback.ghana@sc.com. Please do not reply to this email. Call our Priority Banking on 0302610750 for any questions or service queries. You are advised not to send any confidential and/or important information to Standard Chartered via e-mail, as Standard Chartered makes no representations or warranties as to the security or accuracy of any information transmitted via e-mail. Standard Chartered shall not be responsible for any loss or damage suffered by you arising from your decision to use e-mail to communicate with the Bank. India: This document is being distributed in India by Standard Chartered in its capacity as a distributor of mutual funds and referrer of any other third party financial products. Standard Chartered does not offer any ‘Investment Advice’ as defined in the Securities and Exchange Board of India (Investment Advisers) Regulations, 2013 or otherwise. Services/products related securities business offered by Standard Charted are not intended for any person, who is a resident of any jurisdiction, the laws of which imposes prohibition on soliciting the securities business in that jurisdiction without going through the registration requirements and/or prohibit the use of any information contained in this document. Indonesia: This document is being distributed in Indonesia by Standard Chartered Bank, Indonesia branch, which is a financial institution licensed and supervised by Otoritas Jasa Keuangan (Financial Service Authority) and Bank Indonesia. Jersey: In Jersey, Standard Chartered Private Bank is the Registered Business Name of the Jersey Branch of Standard Chartered Bank. The Jersey Branch of Standard Chartered Bank is regulated by the Jersey Financial Services Commission. Copies of the latest audited accounts of Standard Chartered Bank are available from its principal place of business in Jersey: PO Box 80, 15 Castle Street, St Helier, Jersey JE4 8PT. Standard Chartered Bank is incorporated in England with limited liability by Royal Charter in 1853 Reference Number ZC 18. The Principal Office of the Company is situated in England at 1 Basinghall Avenue, London, EC2V 5DD. Standard Chartered Bank is authorised by the Prudential Regulation Authority and regulated by the Financial Conduct Authority and Prudential Regulation Authority. The Jersey Branch of Standard Chartered Bank is also an authorised financial services provider under license number 44946 issued by the Financial Sector Conduct Authority of the Republic of South Africa. Jersey is not part of the United Kingdom and all business transacted with Standard Chartered Bank, Jersey Branch and other SC Group Entity outside of the United Kingdom, are not subject to some or any of the investor protection and compensation schemes available under United Kingdom law. Kenya: This document is being distributed in Kenya by and is attributable to Standard Chartered Bank Kenya Limited. Investment Products and Services are distributed by Standard Chartered Investment Services Limited, a wholly owned subsidiary of Standard Chartered Bank Kenya Limited that is licensed by the Capital Markets Authority in Kenya, as a Fund Manager. Standard Chartered Bank Kenya Limited is regulated by the Central Bank of Kenya. Malaysia: This document is being distributed in Malaysia by Standard Chartered Bank Malaysia Berhad (“SCBMB”). Recipients in Malaysia should contact SCBMB in relation to any matters arising from, or in connection with, this document. This document has not been reviewed by the Securities Commission Malaysia. The product lodgement, registration, submission or approval by the Securities Commission of Malaysia does not amount to nor indicate recommendation or endorsement of the product, service or promotional activity. Investment products are not deposits and are not obligations of, not guaranteed by, and not protected by SCBMB or any of the affiliates or subsidiaries, or by Perbadanan Insurans Deposit Malaysia, any government or insurance agency. Investment products are subject to investment risks, including the possible loss of the principal amount invested. SCBMB expressly disclaim any liability and responsibility for any loss arising directly or indirectly (including special, incidental or consequential loss or damage) arising from the financial losses of the Investment Products due to market condition. Nigeria: This document is being distributed in Nigeria by Standard Chartered Bank Nigeria Limited (SCB Nigeria), a bank duly licensed and regulated by the Central Bank of Nigeria. SCB Nigeria accepts no liability for any loss or damage arising directly or indirectly (including special, incidental or consequential loss or damage) from your use of these documents. You should seek advice from a financial adviser on the suitability of an investment for you, taking into account these factors before making a commitment to invest in an investment. To unsubscribe from receiving further updates, please send an email to clientcare.ng@sc.com requesting to be removed from our mailing list. Please do not reply to this email. Call our Priority Banking on 02 012772514 for any questions or service queries. SCB Nigeria shall not be responsible for any loss or damage arising from your decision to send confidential and/or important information to Standard Chartered via e-mail. SCB Nigeria makes no representations or warranties as to the security or accuracy of any information transmitted via e-mail. Pakistan: This document is being distributed in Pakistan by, and attributable to Standard Chartered Bank (Pakistan) Limited having its registered office at PO Box 5556, I.I Chundrigar Road Karachi, which is a banking company registered with State Bank of Pakistan under Banking Companies Ordinance 1962 and is also having licensed issued by Securities & Exchange Commission of Pakistan for Security Advisors. Standard Chartered Bank (Pakistan) Limited acts as a distributor of mutual funds and referrer of other third-party financial products. Singapore: This document is being distributed in Singapore by, and is attributable to, Standard Chartered Bank (Singapore) Limited (Registration No. 201224747C/ GST Group Registration No. MR-8500053-0, “SCBSL”). Recipients in Singapore should contact SCBSL in relation to any matters arising from, or in connection with, this document. SCBSL is an indirect wholly owned subsidiary of Standard Chartered Bank and is licensed to conduct banking business in Singapore under the Singapore Banking Act, 1970. Standard Chartered Private Bank is the private banking division of SCBSL. IN RELATION TO ANY SECURITY OR SECURITIES-BASED DERIVATIVES CONTRACT REFERRED TO IN THIS DOCUMENT, THIS DOCUMENT, TOGETHER WITH THE ISSUER DOCUMENTATION, SHALL BE DEEMED AN INFORMATION MEMORANDUM (AS DEFINED IN SECTION 275 OF THE SECURITIES AND FUTURES ACT, 2001 (“SFA”)). THIS DOCUMENT IS INTENDED FOR DISTRIBUTION TO ACCREDITED INVESTORS, AS DEFINED IN SECTION 4A(1)(a) OF THE SFA, OR ON THE BASIS THAT THE SECURITY OR SECURITIES-BASED DERIVATIVES CONTRACT MAY ONLY BE ACQUIRED AT A CONSIDERATION OF NOT LESS THAN S$200,000 (OR ITS EQUIVALENT IN A FOREIGN CURRENCY) FOR EACH TRANSACTION. Further, in relation to any security or securities-based derivatives contract, neither this document nor the Issuer Documentation has been registered as a prospectus with the Monetary Authority of Singapore under the SFA. Accordingly, this document and any other document or material in connection with the offer or sale, or invitation for subscription or purchase, of the product may not be circulated or distributed, nor may the product be offered or sold, or be made the subject of an invitation for subscription or purchase, whether directly or indirectly, to persons other than a relevant person pursuant to section 275(1) of the SFA, or any person pursuant to section 275(1A) of the SFA, and in accordance with the conditions specified in section 275 of the SFA, or pursuant to, and in accordance with the conditions of, any other applicable provision of the SFA. In relation to any collective investment schemes referred to in this document, this document is for general information purposes only and is not an offering document or prospectus (as defined in the SFA). This document is not, nor is it intended to be (i) an offer or solicitation of an offer to buy or sell any capital markets product; or (ii) an advertisement of an offer or intended offer of any capital markets product. Deposit Insurance Scheme: Singapore dollar deposits of non-bank depositors are insured by the Singapore Deposit Insurance Corporation, for up to S$100,000 in aggregate per depositor per Scheme member by law. Foreign currency deposits, dual currency investments, structured deposits and other investment products are not insured. This advertisement has not been reviewed by the Monetary Authority of Singapore. Taiwan: SC Group Entity or Standard Chartered Bank (Taiwan) Limited (“SCB (Taiwan)”) may be involved in the financial instruments contained herein or other related financial instruments. The author of this document may have discussed the information contained herein with other employees or agents of SC or SCB (Taiwan). The author and the above-mentioned employees of SC or SCB (Taiwan) may have taken related actions in respect of the information involved (including communication with customers of SC or SCB (Taiwan) as to the information contained herein). The opinions contained in this document may change, or differ from the opinions of employees of SC or SCB (Taiwan). SC and SCB (Taiwan) will not provide any notice of any changes to or differences between the above-mentioned opinions. This document may cover companies with which SC or SCB (Taiwan) seeks to do business at times and issuers of financial instruments. Therefore, investors should understand that the information contained herein may serve as specific purposes as a result of conflict of interests of SC or SCB (Taiwan). SC, SCB (Taiwan), the employees (including those who have discussions with the author) or customers of SC or SCB (Taiwan) may have an interest in the products, related financial instruments or related derivative financial products contained herein; invest in those products at various prices and on different market conditions; have different or conflicting interests in those products. The potential impacts include market makers’ related activities, such as dealing, investment, acting as agents, or performing financial or consulting services in relation to any of the products referred to in this document. UAE: DIFC – Standard Chartered Bank is incorporated in England with limited liability by Royal Charter 1853 Reference Number ZC18.The Principal Office of the Company is situated in England at 1 Basinghall Avenue, London, EC2V 5DD. Standard Chartered Bank is authorised by the Prudential Regulation Authority and regulated by the Financial Conduct Authority and Prudential Regulation Authority. Standard Chartered Bank, Dubai International Financial Centre having its offices at Dubai International Financial Centre, Building 1, Gate Precinct, P.O. Box 999, Dubai, UAE is a branch of Standard Chartered Bank and is regulated by the Dubai Financial Services Authority (“DFSA”). This document is intended for use only by Professional Clients and is not directed at Retail Clients as defined by the DFSA Rulebook. In the DIFC we are authorised to provide financial services only to clients who qualify as Professional Clients and Market Counterparties and not to Retail Clients. As a Professional Client you will not be given the higher retail client protection and compensation rights and if you use your right to be classified as a Retail Client we will be unable to provide financial services and products to you as we do not hold the required license to undertake such activities. For Islamic transactions, we are acting under the supervision of our Shariah Supervisory Committee. Relevant information on our Shariah Supervisory Committee is currently available on the Standard Chartered Bank website in the Islamic banking section. For residents of the UAE – Standard Chartered UAE (“SC UAE”) is licensed by the Central Bank of the U.A.E. SC UAE is licensed by Securities and Commodities Authority to practice Promotion Activity. SC UAE does not provide financial analysis or consultation services in or into the UAE within the meaning of UAE Securities and Commodities Authority Decision No. 48/r of 2008 concerning financial consultation and financial analysis. Uganda: Our Investment products and services are distributed by Standard Chartered Bank Uganda Limited, which is licensed by the Capital Markets Authority as an investment adviser. United Kingdom: In the UK, Standard Chartered Bank is authorised by the Prudential Regulation Authority and regulated by the Financial Conduct Authority and Prudential Regulation Authority. This communication has been approved by Standard Chartered Bank for the purposes of Section 21 (2) (b) of the United Kingdom’s Financial Services and Markets Act 2000 (“FSMA”) as amended in 2010 and 2012 only. Standard Chartered Bank (trading as Standard Chartered Private Bank) is also an authorised financial services provider (license number 45747) in terms of the South African Financial Advisory and Intermediary Services Act, 2002. The Materials have not been prepared in accordance with UK legal requirements designed to promote the independence of investment research, and that it is not subject to any prohibition on dealing ahead of the dissemination of investment research. Vietnam: This document is being distributed in Vietnam by, and is attributable to, Standard Chartered Bank (Vietnam) Limited which is mainly regulated by State Bank of Vietnam (SBV). Recipients in Vietnam should contact Standard Chartered Bank (Vietnam) Limited for any queries regarding any content of this document. Zambia: This document is distributed by Standard Chartered Bank Zambia Plc, a company incorporated in Zambia and registered as a commercial bank and licensed by the Bank of Zambia under the Banking and Financial Services Act Chapter 387 of the Laws of Zambia.