24 February 2023
Global Market Outlook
Global Market Outlook
The income window reopens
Markets had become too optimistic over the prospects of a peak in Fed rates in early 2023. The market’s recent reassessment of the Fed’s policy rate path, however, has reopened the window to add to high-quality income assets at attractive levels.
We had anticipated gains in Asia ex-Japan equities and Asia USD bonds, but the pace of the rally exceeded our expectations. We would add on pullbacks, given stretched positioning. Growth, earnings and credit quality are likely to be well-supported.
The pullback in gold offers a rebalancing opportunity given its diversification value. We view the reversal in the USD downtrend as temporary.
Where are the tactical opportunities for investors?
What are the key macro indicators to monitor?
What is the message from your quant models?
Strategy
Investment strategy and key themes
|
|
||||
|

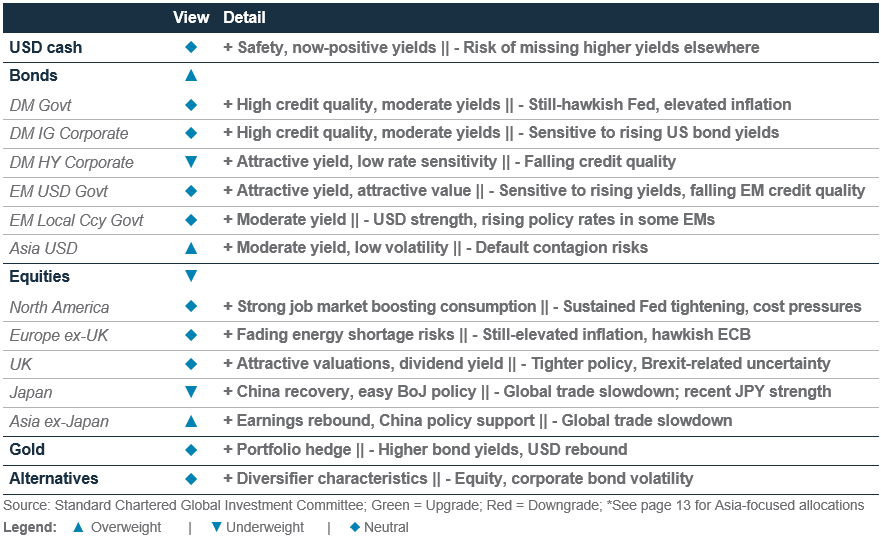
Our top preferences
(12-month outlook)
Foundation overweights
- Bonds – both government and corporate
- In equities: Asia ex-Japan
- In bonds: Asia USD
Sector overweights
- US: Healthcare, Staples, Energy
- Europe: Energy, Financials
- China: Comms. Services, Consumer Discretionary
FX views
- EUR, JPY top beneficiaries of a weaker USD
Structural macro trends*
- A digital tomorrow
- Preparing for an aging world
- From unipolarity to multipolarity
- Investing in a climate-constrained world
*Individual reports available
The income window reopens
- Markets had turned too optimistic over the prospects of a peak in Fed rates in early 2023. The market’s recent reassessment of the Fed’s policy rate path, however, has reopened the window to add to high-quality income assets at attractive levels.
- We had anticipated gains in Asia ex-Japan equities and Asia USD bonds, but the pace of the rally exceeded our expectations. We would add on pullbacks, given stretched positioning. Growth, earnings and credit quality are likely to be well-supported.
- The pullback in gold offers a rebalancing opportunity given its diversification value. We view the reversal in the USD downtrend as temporary.
Navigating the wide swings in sentiment
Since we published our Outlook 2023, risky assets have done well as markets factored in the positive surprises to global growth, especially in Europe and China. Chinese equities led the way, with the MSCI China index surging c.60% from its late-October trough to its late January peak. The S&P500 index is also up c.4.5% YTD. We do not, however, agree with the market’s optimism, given hawkish central banks remain a threat to growth.
In China, we believe the optimism is justified, though. A rapid reopening is starting to reflect in economic activity data and has room to extend further, especially with the authorities providing more policy support, given inflation is not a major concern.
In the US, though, economic data is starting to paint a different picture. Economic growth, especially in the services sector, remains surprisingly strong given the extent of policy tightening. However, the rise in shorter-term inflation expectations illustrates how relatively strong data can revive inflation and further Fed tightening concerns.
Having said that, we would read this as illustrating a shift in expectations from an imminent Fed rate pause to a few more hikes. Market expectations are now consistent with our view of the Fed policy rate peaking above 5% and a relatively longer pause thereafter. This gives us confidence that the macro environment remains consistent with our SAFE strategy: Securing your yield, Allocating to Asian assets offering long-term value, Fortifying against further surprises and Expanding beyond the traditional.
Fig.1 US one-year inflation expectations have ticked higher in recent weeks following strong US growth data
Inflation expectations based on US inflation-protected bonds
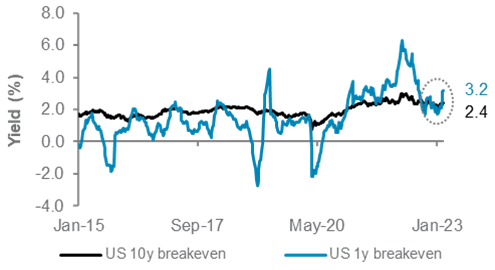
The income window reopens
The turn lower in bond yields in January (the 10-year US government bond yield approached 3.3% last month) was starting to raise concerns that the window to take advantage of attractive bond yields was starting to close. That window now appears to have reopened, with the 10-year yield rebounding above 3.9%, US IG Corp yield above 5% and Asia USD bond yield close to 6.5%.
For investors who were not able to take advantage of the peak in yields in late 2022, we believe markets have created another attractive opportunity to add high-quality income assets. In terms of asset classes, we retain a relative preference for IG bonds. Asia USD bonds top our preference order, though in the short term, we would be patient about adding further until one-sided positioning unwinds.
HY bonds continue to rank last, despite their higher yield, as we believe their relatively higher correlation with equities makes them more vulnerable to a downturn and a rise in default rates should growth slow. Instead, we believe multi-asset income strategies offer a more attractive way of earning a higher yield in return for higher risk, given the wider diversification of underlying income asset classes.
Long-term value meets short-term positioning
Asia ex-Japan equities have rebounded strongly since we published our 2023 Outlook, led by c.15% rise in Chinese equities to their recent peak in late January.
On a 6-12-month horizon, we continue to see value in Asia ex-Japan equities, a view driven by our preference for Chinese equities to a significant extent. China’s economic data has continued to improve, consistent with its reopening. Chinese equities are approaching long-term average valuations only now, despite the scale of the bounce. Following the stronger-than-expected January money supply and new loan growth, we are seeing more pro-growth policy signals ahead of the Two Sessions (starting on 5 March), including the injection of over CNY600bn in liquidity via reverse repos in mid-February. Chinese equities’ tendency for momentum-led overshoots means we see room for this market rebound to extend.
Fig.2 The USD rebound has triggered a pause in Asian/EM equities and bonds
USD Index (DXY), JPMorgan Asia Credit Index (inverted)
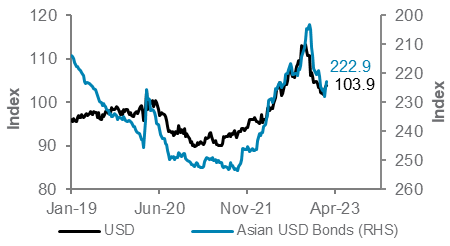
We recommend balanced exposures to offshore and onshore China equities, though the latter is more sensitive to policy support and resilient against geopolitical tensions. The only fly in the ointment is data from fund manager surveys illustrating the optimism could have reached excessive levels. This means a period of consolidation is likely for the extreme positioning to unwind. However, we would add exposure on any pullback, given our positive fundamental view.
We remain less sanguine on US/European equity markets. While the 2023 rally has taken a pause, we remain concerned that earnings remain at risk due to the tightening Fed and ECB policies, particularly if strong economic growth data causes both central banks to extend policy tightening.
Fortress Gold
Gold tends to have a negative long-term relationship with US bond yields and the USD. Hence, gold has pulled back as both yields and the USD have rebounded in recent weeks.
Having said that, we would view this as an opportunity to moderately add exposure (we are Neutral on gold – see page 13 for suggested allocations) where appropriate for portfolio diversification. Gold’s diversification benefits remain attractive, particularly vs the risk of short-term equity market volatility. Such volatility could be triggered by geopolitical risks, given the recent rise in tensions across several fault lines, or earnings growth worries as the US economy slows.
USD strength likely only a speed breaker
We believe the recent USD strength is only a multi-week breather within an ongoing downtrend. The rebound in bond yields amid a reassessment of Fed policy likely explains the pause. However, we continue to expect the USD to weaken from today’s level on both 3- and 12-month horizons.
This has two key implications. First, it means major G10 peers are likely to strengthen (see page 9 for our updated 3-month forecasts). Second, it suggests the tailwind for Emerging Market assets is likely to remain in place (a weakening USD generally correlates with stronger EM asset returns).
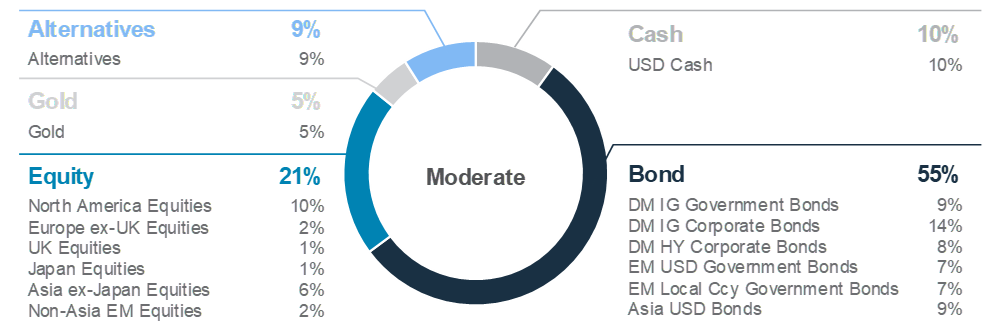
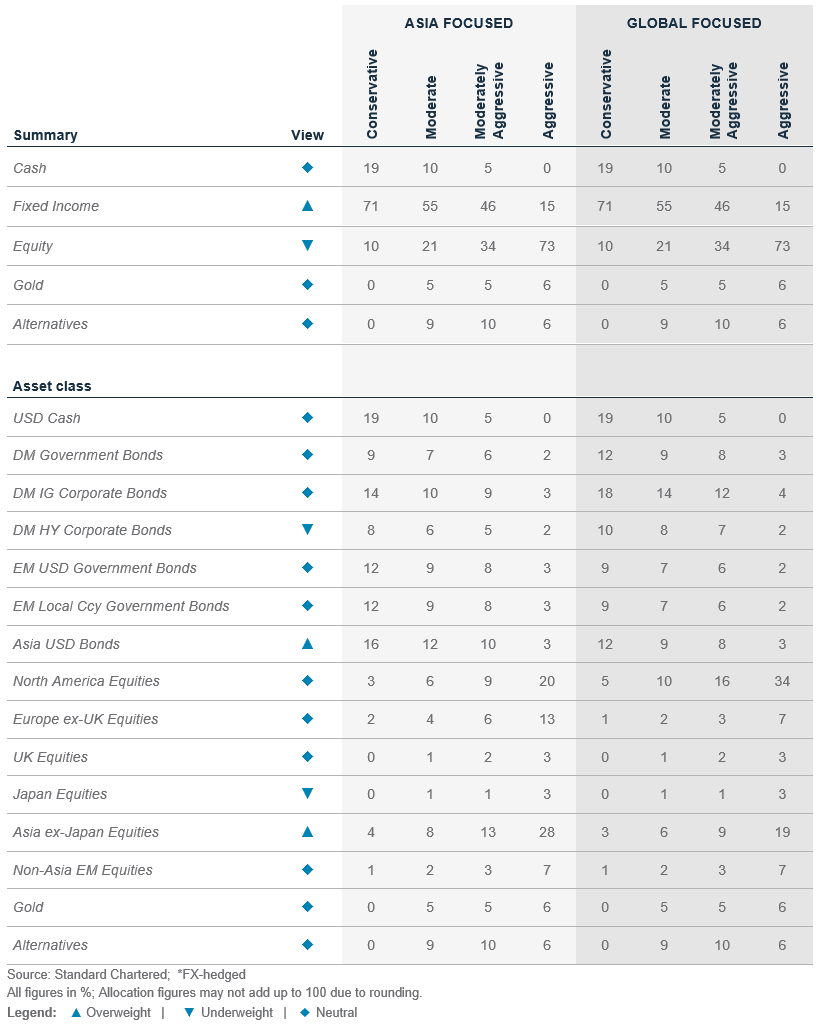
Foundation: Our tactical asset allocation
Global* allocation for a moderate risk profile
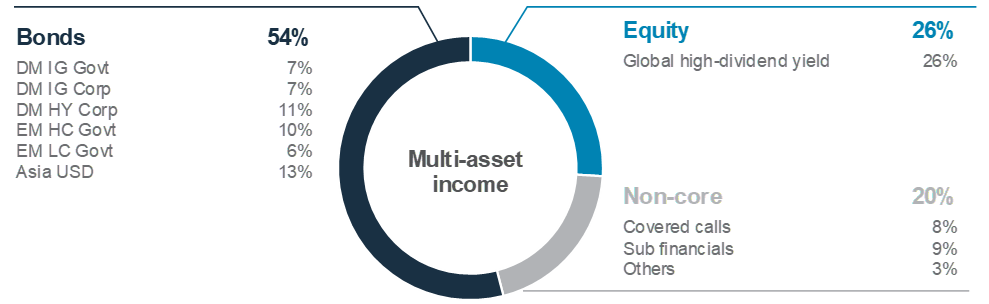
Multi-asset income allocation for a moderate risk profile
Macro overview – at a glance
Summary
|
|
||||
Key themes
The risk of an imminent global economic recession has receded in recent weeks. In the US, a still-robust job market, substantial household savings and waning inflation pressures have helped revive consumer sentiment and supported services sector activity. In Europe, an unusually warm winter has helped the region avoid widespread energy shortages triggered by the Russia-Ukraine conflict, leading to a rebound in consumer and services business confidence. Meanwhile, in China, the early lifting of COVID-19-related mobility restrictions has led to a faster-than-expected normalisation of economic activity.
However, we see the latest improvements in the US and Europe as temporary. Inflation remains well above central bank targets in both the regions, forcing policymakers to turn increasingly hawkish. As a result, money markets now estimate the Fed funds rate and the ECB deposit rate to peak in the current hiking cycle close to 5.5% and 3.75%, respectively, in Q3 this year. More importantly, and aligned with our own views, markets expect policy rates to stay near the peak for longer, raising the risk of an economic downturn later in the year or early next year. In contrast with the outlook for Developed Markets, we expect China’s outlook to keep improving as still-low inflation enables authorities to further ease monetary, credit and fiscal policies to revive domestic consumption and, potentially, the property sector.
Key chart
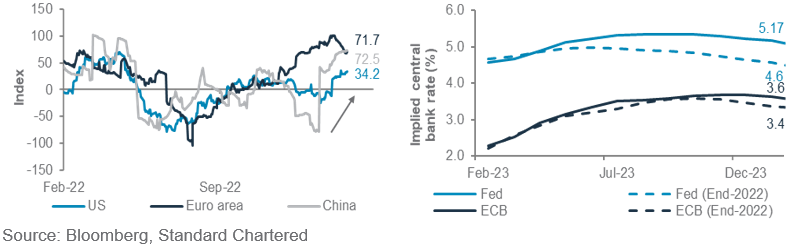
Global economic data has surprised positively in recent weeks, especially in the US, aided by strong services sector consumption in the US, a warm winter in Europe and a faster-than-expected normalisation of economic activity in China
Fig. 3 Economic data has positively surprised globally, lifting policy rate estimates
Citi economic surprise indices; money market projection of Fed, ECB rates (today vs end-22)
Macro factors to watch
- US job market, inflation, Fed policy stance: The outlook for financial markets this year is likely to be determined by whether the Fed manages a soft-landing for the US economy, ie, brings down inflation towards its 2% target without causing a deep recession. The surprisingly strong job market, service sector activity and inflation in January have made the Fed’s job harder, in our view, as it would need to keep policy rates higher for longer to induce a slowdown in job creation and subdue wage inflation. Thus, we would closely watch early job market indicators, including initial jobless claims, job openings and the quits-to-layoffs ratio, to assess the pace of slowdown in job creation and as early warning signals for the Fed to pause its rate hikes. Shelter costs and services sector ex-shelter inflation (Fed Chair Powell’s preferred measure of wage growth) are other key indicators to watch to assess the stickiness of inflation. We see a rising risk of structural factors keeping inflation above the Fed’s target for longer, complicating its monetary policy.
- China’s pace of recovery: China has surprised markets with its rapid pace of normalisation. Domestic Lunar New Year holiday trips surged 74% y/y to 226m, its highest since 2020, according to state media. Although that number was half that of the pre-pandemic level (2019), it shows pent-up demand for leisure travel. Similarly, we expect domestic consumption to receive a boost this year as at least some of the excess savings accumulated during the pandemic are spent. We will monitor the measures the National People’s Congress will be taking in March to revive local demand and, potentially, the property sector.
- Euro area inflation, ECB rate hikes. The Euro area avoided a contraction in Q4 22, thanks to an unusually warm winter. It now needs to see a sustained decline in core inflation to keep the ECB from turning more hawkish, stymying the recovery. Markets expect the ECB to raise rates to 3.75%, the highest on record. The Euro area job market remains tight despite slowing growth, suggesting structural factors are at play in keeping inflation elevated. Any escalation in the Ukraine conflict is another key risk.
Asset Classes
Bonds – at a glance
|
|
||||
Key themes
US government bond yields rebounded as the recent strength in US macro data made markets reassess their expectations of Fed rate hikes and near-term recession risk. Money markets now expect a higher peak Fed rate and a more extended period of tight policy relative to the start of the year. However, while these expectations now more closely match that of our own, we believe a tight policy will still result in slower growth eventually. This is ultimately likely to result in gradually lower bond yields later in the year. This is also the reason why we view the current levels as an attractive opportunity to lock in high-quality yields.
We remain Overweight Asia USD bonds amid a rebound in regional economic activity after China’s reopening. The asset class comprises c.85% Investment Grade bonds, which suggests the over 6% yield offers an attractive risk/reward.
We remain Underweight Developed Market (DM) High Yield bonds. We expect their positive performance YTD to reverse as risks of economic downturn and credit quality deterioration come through. We are Neutral on other major bond asset classes. For DM corporate IG bonds, the surge in bond yields, driven by higher government bonds, has offered a better entry point; however, market expectation of a higher-for-longer monetary tightening cycle could drive bond price volatility higher due to their higher sensitivity towards interest rate changes. For Emerging Market (EM) bonds, we believe the USD’s strength in recent weeks is likely to drag short-term performance. However, our long-term 12-month view of a modestly weaker USD should support EM assets going forward.
Key chart
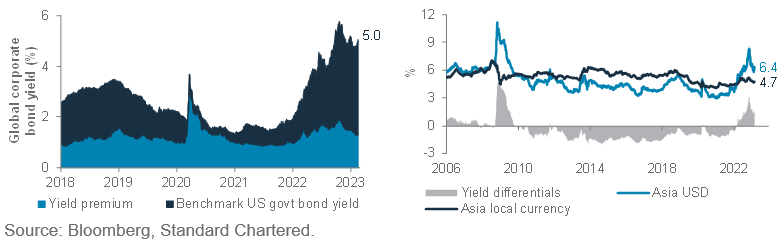
Higher government bond yields offer an attractive entry point to bonds; Asia USD bonds should continue to attract regional demand given positive yield differential over local currency bonds
Fig. 4 Recent surge in bond yields is driven by government bond yields; Asia USD bonds remain attractive despite their recent rally
Global corporate bond yield components; Asia corporate bond yields (USD, local currency)
What is your latest view on Asia USD bonds?
We are Overweight Asia USD bonds. Although both nominal yields and the yield premium over US government bonds have fallen to their long-term average levels, we continue to favour this bond asset class for four main reasons:
- China recovery: We believe current valuations still offer room for China USD bonds to outperform. As China’s new central committee members are expected to release their new strategic plan in March, we would closely monitor the sectors of focus.
- Regional demand: We continue to expect local demand to be a strong supporting factor, given the USD asset class continues to offer an attractive yield pick-up, compared with local currency bonds.
- High quality: Asia USD bonds remain largely dominated by Investment Grade bonds. We believe their strong credit fundamentals and lower historical return volatility vs DM IG corporate bonds should offer relatively defensive exposure against the backdrop of rising risk of a global growth downturn later this year.
- Peaking default risk: Default risk has been a big concern for Asia USD bond investors in 2022, which was led by tightening financing channels and higher policy scrutiny in the Chinese property sector. In late 2022, though, we witnessed several rounds of supportive policy measures. We believe default risks have likely peaked, with residential property prices showing preliminary signs of moderation and quality developers gradually regaining access to on/offshore capital markets.
Equity – at a glance
|
|
||||
|
Key themes
We remain Underweight on global equities. Major central banks are likely to maintain their tight monetary stance following surprisingly strong economic data, thus hurting equities’ valuation and earnings growth this year.
We are Neutral on US equities. Tight Fed policy and a potential US recession, likely later this year or early next year, would dampen corporate earnings at a time when valuations remain relatively expensive. We are also Neutral on the Euro area and UK equities. While a milder winter in the region has reduced the likelihood of an energy crisis, expected earnings growth in both regions has been downgraded to the negative territory this year amid tighter monetary conditions. We are Underweight on Japan equities in view of the risk of a significant strengthening of the JPY, which could hurt earnings growth from exports.
We remain Overweight on Asia ex-Japan equities. Our view is led by China, where we remain Overweight within the region, with the economic reopening likely adding significant support to earnings growth from a consumption rebound. This comes in addition to the support from China’s policy stimulus, amid still-attractive valuations. This Lunar New Year witnessed a rebound in tourism revenue, with further potential upside still to come. We also expect a weaker USD to support fund inflows to Emerging Markets in 2023. We remain Neutral on Indian equities given the trade-off between strong earnings growth and elevated valuations.
Key chart
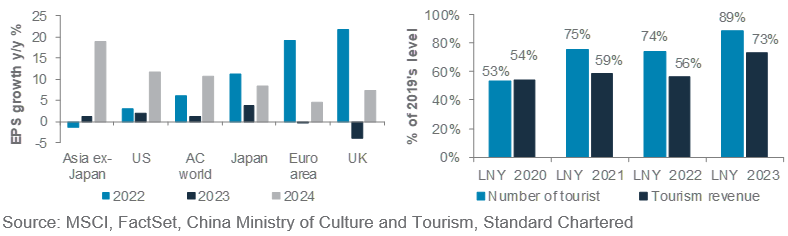
Subdued earnings growth in 2023 will likely be followed by a recovery in 2024, led by Asia ex-Japan. We expect China’s economic rebound to support China and Asia ex-Japan equities
Fig. 5 Global earnings growth will likely be subdued globally for 2023, with Asia ex-Japan leading in 2024. China tourism revenue recovered to 73% of 2019 levels, with potential for further recovery
Consensus earnings growth for various regional MSCI equity indices. Number of tourists and tourism revenue in China during Lunar New Year, as a percentage of 2019’s level.
Higher-for-longer rates to hurt earnings
Recent data suggest resilient economic growth in the US and Europe. In our view, this is likely to keep interest rates higher for longer as the Fed and ECB remain focused on slowing growth to contain inflation. We believe this will act as an important headwind for global equities, particularly in the US and Europe. We remain Underweight on global equities for the next 6-12 months.
US equities rallied this year, helped in part by expectations of a reversal of the Fed’s monetary tightening. However, we believe this is premature. Q4 2022 earnings have delivered positive surprises but against lowered expectations. 2023 earnings growth expectations have also been revised down to just 2%. In the Euro area, Q4 2022 earnings surprises have also been positive so far. Coupled with a warmer winter and a rebound in China supporting a better exports outlook, Euro area equities have done well this year. However, we remain cautious on the growth outlook from here as restrictive interest rates work through the economy. We remain Neutral on US and Euro area equities relative to global equities.
Asia ex-Japan remains a preferred market. Here, we see further upside in China’s economic recovery, supported by the easing of mobility restrictions, border reopening and pro-growth policies. This will likely lead to improving earnings growth. Although China equities have rebounded strongly since October 2022, valuation remains attractive, with the benchmark trading at an 18% discount to Asia ex-Japan. We are Overweight on China and Asia ex-Japan equities. We are Neutral on India within Asia ex-Japan as valuation remains elevated despite the superior earnings growth. India’s 12m forward PE is at a 55% premium to Asia ex-Japan, above the historical average premium of 38%.
FX – at a glance
|
|
||||
Key themes
A reset in market expectations of Fed rates in 2023 towards a higher peak and a longer pause than before is likely to trigger a short-lived bounce higher in the US Dollar on the back of higher US bond yields. However, we do not expect this to be long lasting and believe the USD downtrend is likely to resume within a three-month window. This is because (i) much of the adjustment in recent weeks has been on US yields alone and non-US yields are likely to catch up and (ii) US bond yields are likely to be ultimately capped by prospects of slowing growth.
The EUR has seen some support from stronger-than-expected regional economic growth data and a relatively hawkish ECB. However, the rebound in the USD has been a more dominant factor in February, pushing the EUR modestly lower. We expect the EUR/USD weakness to be temporary, though, given our view that the USD rebound is likely to be fleeting and Euro area growth and policy drivers remain positive. On a three-month horizon, we believe a return to 1.08-1.09 is likely.
The JPY has been much more in focus lately than the EUR given the speculation over the longevity of the BoJ’s yield curve control (YCC) policy. We believe an eventual modification of the YCC policy is probable, though any change could be delayed till at least the April BoJ meeting after current Governor Kuroda departs. While this means USD/JPY could be relatively rangebound between 128 and 132 in the coming months, longer term, we expect the JPY to strengthen on lower rate differentials.
Commodity currencies are likely to see continued support from China’s economic reopening and the resulting boost to demand for commodities. The AUD has added support from a renewed hawkish turn in the RBA’s monetary policy. On a longer 6-12-month horizon, we continue to expect a weaker USD as the tug of war between higher Fed rate expectations (pushing US bond yields higher) and slower growth prospects (pushing yields lower) are ultimately dominated by slower growth expectations. The USD’s expensive valuation backdrop coincides with the gradual softening of US inflation, narrowing the currency’s rate differentials vs other major currencies. Increased capital flows towards non-US markets and easing geopolitical uncertainty are other USD negatives. We expect the AUD and JPY to be the key outperformers on a 6-12-month horizon.
Key chart
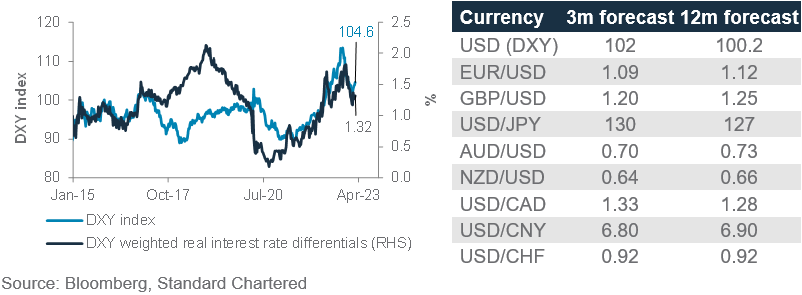
Our updated three-month forecasts reflect our view that the USD’s ongoing bounce higher is likely to prove temporary
Fig. 6 Higher US rate expectations were likely behind the USD’s short-term bounce
USD Index (DXY) and DXY-weighted real interest rate differential; Table of forecasts
What drove the recent change to three-month forecasts?
A key debate at our Global Investment Committee was the likely longevity of the recent rebound in the USD.
The US Dollar index (DXY) fell over 10% since its late-October 2022 peak, with a narrower downtrend channel developing from November. While the USD did pause briefly in January, financial market variables rarely move in a straight line.
Relative interest rate differentials remain one of the most important drivers, in our view. This explains the recent rebound following the rise in US bond yields, a move that could extend briefly in the coming weeks.
However, we believe this move is likely to be temporary as any rise in US bond yields is capped by worsening US growth expectations. Hence, we remain USD bears over the full year and expect the downtrend to resume within three months.
Gold, crude oil – at a glance
|
Key themes
We remain Neutral on gold vs other major asset classes, with a three-month forecast of USD 1,875, and see it as a portfolio ballast. Gold prices have been trending downwards after testing the 1,950 level in January. Higher real yields and USD strength, on the back of rebounding bond yields, are weighing on gold as the Fed stays on its hiking cycle. Physical demand is weakening, with ETF flows turning negative again. However, central bank purchases are likely to continue, putting a floor under gold prices. Furthermore, the recent flare-up of geopolitical tensions is likely to drive safe haven flows to gold. On a 12-month horizon, our base scenario of an eventual pullback of real bond yields and the USD would remove key headwinds against the precious metal, allowing it to move even higher than our three-month forecast.
We remain positive on oil prices in the next three months as China’s demand continues to recover on higher consumption and improving economic activity. Receding global economic recession risks in the near term could also buoy investor sentiment. Supply remains tight and uncertain, with the EU embargo on Russian oil, evolving Russa-Ukraine conflict and gradually depleting global oil inventories. In the long run, we see a deteriorating global economy slowing oil demand, while OPEC+ responds with output cuts to ensure a balanced demand-supply dynamic in oil markets. This is likely to stabilise oil prices at c.USD 75/bbl.
Key chart
Central banks continue to buy gold, supporting the case for higher prices in the near term
There is still more room for China oil demand to recover on higher consumption
Fig. 7 Global central banks purchased a record volume of gold in 2022; China oil demand remained sluggish on still-depressed mobility
LHS chart: Quarterly central bank gold purchases (tonnes)
RHS chart: Total China apparent oil demand (bbl/d)
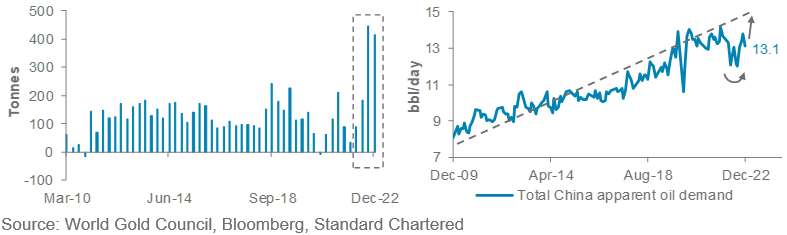
Central banks go on a gold-buying spree
Central banks purchased 1,136 tonnes of gold in 2022, the highest on records dating back to 1950, according to the World Gold Council. Within this, China, historically a large buyer of gold, is the most notable, as it resumed purchases for the first time since September 2019. Turkey was the largest buyer in 2022, with its gold reserves almost quadrupling. The Middle East was also an active gold buyer.
The strong official sector demand can be attributed to geopolitical uncertainty, which has led many central banks to diversify their holdings away from major currencies such as the USD and EUR. We expect central banks to remain net gold purchasers for a while amid elevated geopolitical risks, offsetting weaker demand in physical and ETF markets. The recent escalation in US-China and Russia-Ukraine tensions also enhances gold’s appeal as a hedge against short-term volatility.
Slowly but surely
After China removed its zero-COVID measures abruptly at the end of 2022, the consensus was expecting a swift recovery in China’s crude oil consumption. However, the recovery seems to be taking longer than expected. China’s apparent oil demand, an aggregate of oil processing volume and net import of oil, fell m/m in December, after a short-lived rebound. The surge in infections after the full reopening continued to keep mobility depressed, limiting the pickup in fuel demand.
However, the slowdown in demand is likely to be temporary. Recent infection figures and high frequency indicators are suggesting that a lift-off in China’s oil demand is due. China refiners are also buying crude oil cargoes and stocking up in anticipation of a recovery. We expect the government to stimulate domestic consumption, which would likely accelerate oil demand recovery. We see the surge in demand, amid tight global supplies, boosting oil prices in the near term.
Quant perspective
US market risk model remains bearish
|
Bearish equity but bullish bond market risks
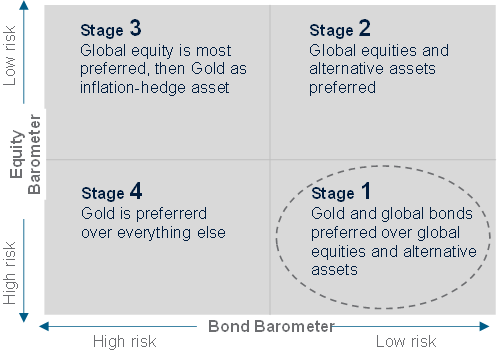
Our US Equity-Bond Market Risk (EBMR) model estimates the downside risks to US equities and 10-year government bonds. It uses 11 economic and market factors to create equity and bond risk barometers. If the value of a barometer falls below 50, it signals higher downside risks and vice versa.
The model continues to indicate that the US financial market cycle remains in Stage 1. Thus, there remains significant downside risk to US equities, suggesting investors should fade the rally in the S&P500 index. Meanwhile, the model views US government bonds favourably in a Stage 1 environment as the risk of a big yield spike is considered low. The model’s equity barometer has captured -15% downside in the S&P 500 since it turned bearish in Jan-22, while the bond barometer has reacted early by turning bullish on US government bond in Jun-22 after capturing a 2.2% rise in US the 10-year Treasury yield previously (Aug-21 to May-22).
Fig. 8 EBMR bearish on equity and bond market risks
US equity and bond market risk barometers
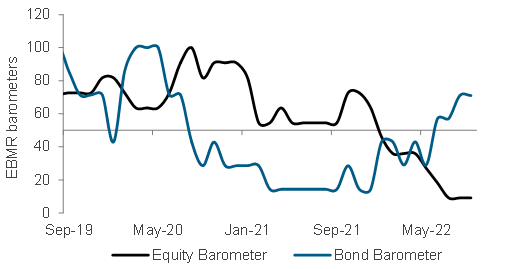
The equity barometer consists of 11 equity indicators. In February, the barometer improved from 9 to 27 but it is primarily supported by equity market momentum; fundamental factors remained unsupportive. Rising interest rates, still-high inflation, slowing housing starts and contracting monetary base remain the bearish factors for equities. While the 12% rebound in the S&P500 index since mid-Oct begs the question if the worst is over, we learned from a similar rally between June and Aug-22 (+17% in S&P500) that it could also quickly turn sour.
Meanwhile, our bond barometer, which tracks six bond indicators, has remained bullish since Jun-22 and is currently sitting at a score of 71. The key drivers behind the bullish bond barometer are the slowdown in economic growth as defensive assets tend to be more favourable. This is indicated by the US ISM Manufacturing PMI that has fallen below 50, indicating a contraction of factory activity for the first time since Jun-20, and US housing starts, which has fallen by 27%. Stronger equity market momentum and low US jobless claims are the only negative factors for the bond barometer.
Our model currently projects that the US will remain in Stage 1 until May-23. For bonds, we have continually cautioned against taking excessive duration risks despite the model’s view due to the monetary policy uncertainty.
Implications on global assets
Data since 1999 suggest gold and bonds are the most preferred in Stage 1. The model’s preference for the assets is based on its long-term relationship with the market cycle, which favours defensive assets in Stage 1.
Fig. 9 Scenarios over the coming months till May 2023 vs September 2022 projections
Probability of the evolution of financial market risk cycle from the current Stage 1 and preferred assets
Model’s estimated probabilities in September 2022
| Stage | Sep-22 | Oct-22 | Nov-22 | Dec-22 |
|---|---|---|---|---|
| 1 | 100% | 100% | 98% | 85% |
| 2 | 0% | 0% | 1% | 15% |
| 3 | 0% | 0% | 0% | 0% |
| 4 | 0% | 0% | 1% | 0% |
Model’s estimated probabilities in January 2023
| Stage | Feb-23 | Mar-23 | Apr-23 | May-23 |
|---|---|---|---|---|
| 1 | 100% | 97% | 96% | 68% |
| 2 | 0% | 0% | 3% | 27% |
| 3 | 0% | 0% | 0% | 3% |
| 4 | 0% | 2% | 1% | 3% |
Tracking market diversity
|
About our market diversity indicators
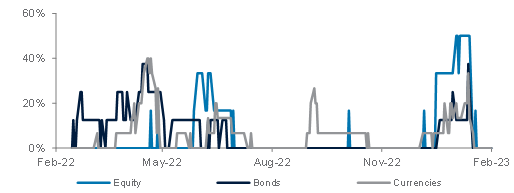
Our market diversity indicators help to identify a potential change in short-term trends due to a fall in market breadth across equities, credit, FX and commodities. When market diversity falls, it implies either buyers or sellers are dominating, leading to a rapid rise or fall in asset prices. This is usually unsustainable and is likely to be followed by a consolidation or a reversal. Our diversity indicator is based on a statistical index called fractal dimension; a value below 1.25 serves as a guideline that prices are rising or falling too fast.
Where is diversity falling or rising this month?
General market diversity has improved significantly over the past few weeks as reversals took place in some equity, bond and currency markets. This can be seen in Fig. 10 and 11 where average diversity within each asset class has risen significantly above 1.25, and the percentage of assets by asset class with diversity below 1.25 fell to 0. These changes came on the back of the recent risk-off environment.
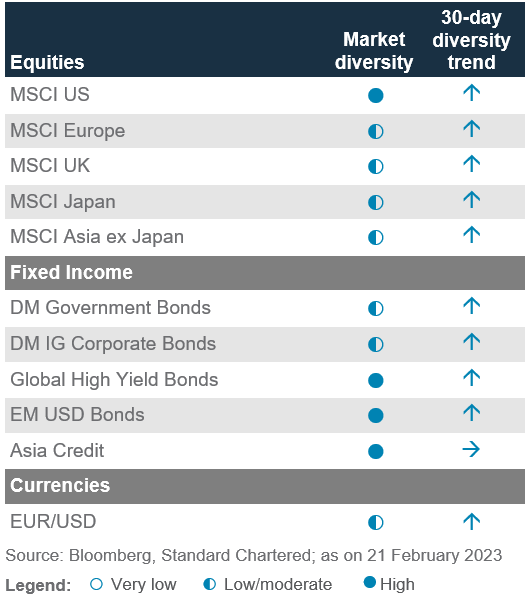
In equities, Asia ex-Japan and European equities have the lowest diversity due to their strong rebound since Oct-22. Our indicators flagged the risk of a reversal or slowdown in both markets in early February. This has worked well for the MSCI Asia ex Japan Index as there was a correction (-4.5% MTD), but not yet for the MSCI Europe Index (+2.1% MTD). Meanwhile, the US and Japan have the highest market diversity currently. This is partly due to the recent reversal in US equities (-1.6% MTD for S&P 500), and the lack of clear trends in Japan equities (in USD terms).
Fig. 10 Average market diversity score by asset class
General diversity has risen post reversals
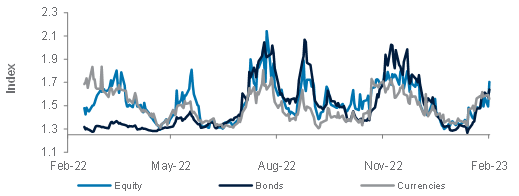
Fig. 11 Percentage of assets with diversity score <1.25
No assets are currently flagged
For bonds, we are seeing a similar rise in market diversity due to their recent price reversals. Many of these bond markets were flagged by our market diversity indicator, some as early as mid-January. These include DM IG credit, global High Yield, EM USD credit and government bond and Asia USD credits. The reversals in these bond markets have coincided with a surge in the US 10-year government bond yield (+37bps MTD) as markets do not expect Fed rate hikes to pause anytime soon following strong US job market data and inflation slowing less than expected.
For currencies, the USD decline paused at the same time as markets turned risk-off in February. The DXY has regained 3.3% after an 11% drawdown since Sept-22. Our diversity indicator missed flagging the turn in the DXY slightly, but it successfully raised a red flag for EUR/USD in early February. The pair has fallen by 3.6% from its peak in February.
Fig. 12 Diversity across key assets
Performance Review
Foundation: Asset allocation summary
Market performance summary
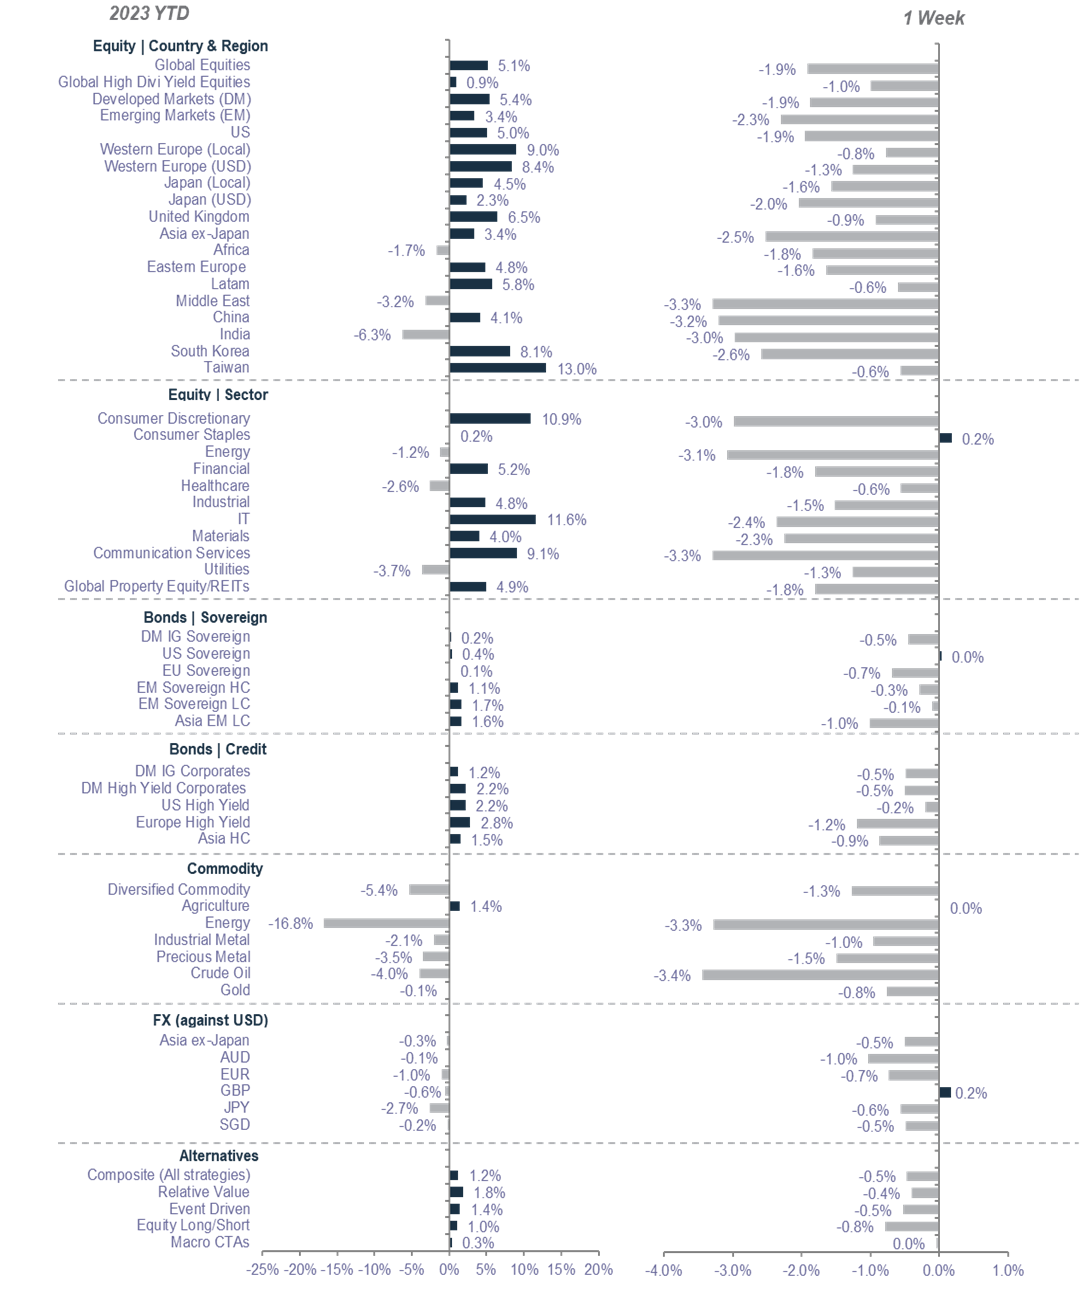
*All performance shown in USD terms, unless otherwise stated
*YTD performance data from 31 December 2022 to 23 February 2023 and 1 week-performance from 16 February 2023 to 23 February
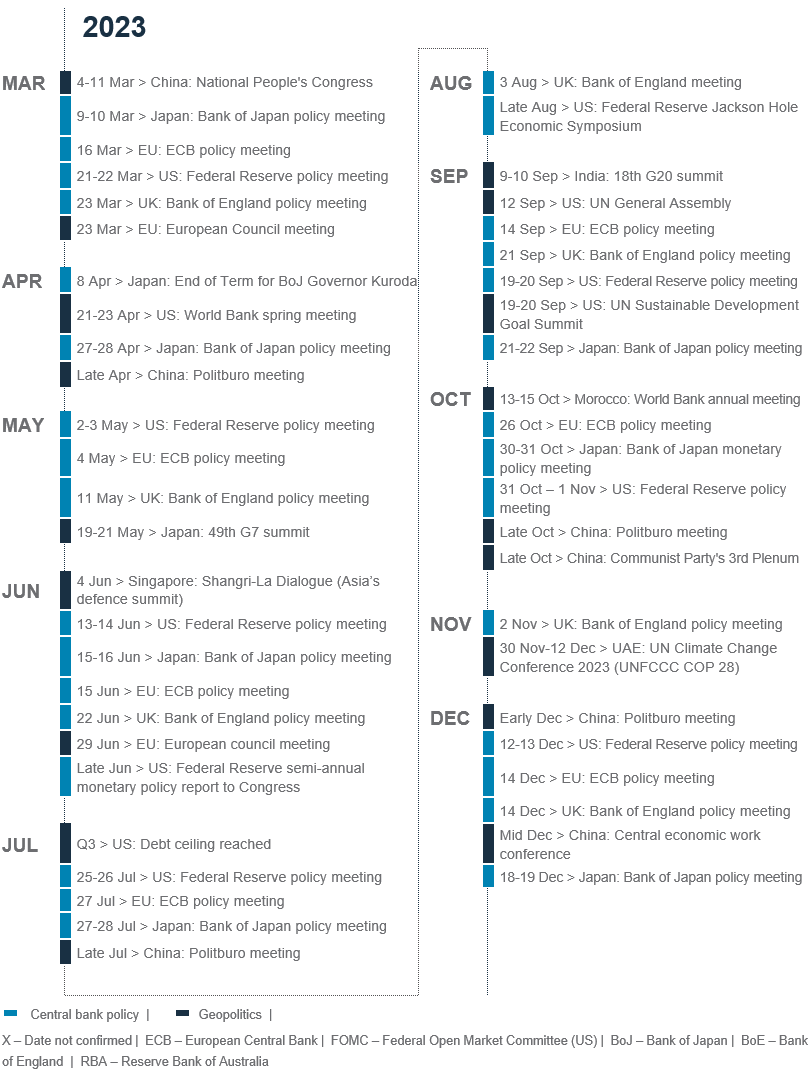
2023
Key events
Explanatory notes
1. The figures on page 7 show allocations for a moderate risk profile only – different risk profiles may produce significantly different asset allocation results. Page 7 is only an example, provided for general information only and they do not constitute investment advice, an offer, recommendation or solicitation. They do not take into account the specific investment objectives, needs or risk tolerances of a particular person or class of persons and they have not been prepared for any particular person or class of persons.
2. Contingent Convertibles are complex financial instruments and are not a suitable or appropriate investment for all investors. This document is not an offer to sell or an invitation to buy any securities or any beneficial interests therein. Contingent convertible securities are not intended to be sold and should not be sold to retail clients in the European Economic Area (EEA) (each as defined in the Policy Statement on the Restrictions on the Retail Distribution of Regulatory Capital Instruments (Feedback to CP14/23 and Final Rules) (“Policy Statement”), read together with the Product Intervention (Contingent Convertible Instruments and Mutual Society Shares) Instrument 2015 (“Instrument”, and together with the Policy Statement, the “Permanent Marketing Restrictions”), which were published by the United Kingdom’s Financial Conduct Authority in June 2015), other than in circumstances that do not give rise to a contravention of the Permanent Marketing Restrictions.
Disclosure
This document is confidential and may also be privileged. If you are not the intended recipient, please destroy all copies and notify the sender immediately. This document is being distributed for general information only and is subject to the relevant disclaimers available at our Standard Chartered website under Regulatory disclosures. It is not and does not constitute research material, independent research, an offer, recommendation or solicitation to enter into any transaction or adopt any hedging, trading or investment strategy, in relation to any securities or other financial instruments. This document is for general evaluation only. It does not take into account the specific investment objectives, financial situation or particular needs of any particular person or class of persons and it has not been prepared for any particular person or class of persons. You should not rely on any contents of this document in making any investment decisions. Before making any investment, you should carefully read the relevant offering documents and seek independent legal, tax and regulatory advice. In particular, we recommend you to seek advice regarding the suitability of the investment product, taking into account your specific investment objectives, financial situation or particular needs, before you make a commitment to purchase the investment product. Opinions, projections and estimates are solely those of SC at the date of this document and subject to change without notice. Past performance is not indicative of future results and no representation or warranty is made regarding future performance. The value of investments, and the income from them, can go down as well as up, and you may not recover the amount of your original investment. You are not certain to make a profit and may lose money. Any forecast contained herein as to likely future movements in rates or prices or likely future events or occurrences constitutes an opinion only and is not indicative of actual future movements in rates or prices or actual future events or occurrences (as the case may be). This document must not be forwarded or otherwise made available to any other person without the express written consent of the Standard Chartered Group (as defined below). Standard Chartered Bank is incorporated in England with limited liability by Royal Charter 1853 Reference Number ZC18. The Principal Office of the Company is situated in England at 1 Basinghall Avenue, London, EC2V 5DD. Standard Chartered Bank is authorised by the Prudential Regulation Authority and regulated by the Financial Conduct Authority and Prudential Regulation Authority. Standard Chartered PLC, the ultimate parent company of Standard Chartered Bank, together with its subsidiaries and affiliates (including each branch or representative office), form the Standard Chartered Group. Standard Chartered Private Bank is the private banking division of Standard Chartered. Private banking activities may be carried out internationally by different legal entities and affiliates within the Standard Chartered Group (each an “SC Group Entity”) according to local regulatory requirements. Not all products and services are provided by all branches, subsidiaries and affiliates within the Standard Chartered Group. Some of the SC Group Entities only act as representatives of Standard Chartered Private Bank and may not be able to offer products and services or offer advice to clients.
Copyright © 2025, Accounting Research & Analytics, LLC d/b/a CFRA (and its affiliates, as applicable). Reproduction of content provided by CFRA in any form is prohibited except with the prior written permission of CFRA. CFRA content is not investment advice and a reference to or observation concerning a security or investment provided in the CFRA SERVICES is not a recommendation to buy, sell or hold such investment or security or make any other investment decisions. The CFRA content contains opinions of CFRA based upon publicly-available information that CFRA believes to be reliable and the opinions are subject to change without notice. This analysis has not been submitted to, nor received approval from, the United States Securities and Exchange Commission or any other regulatory body. While CFRA exercised due care in compiling this analysis, CFRA, ITS THIRD-PARTY SUPPLIERS, AND ALL RELATED ENTITIES SPECIFICALLY DISCLAIM ALL WARRANTIES, EXPRESS OR IMPLIED, INCLUDING, BUT NOT LIMITED TO, ANY WARRANTIES OF MERCHANTABILITY OR FITNESS FOR A PARTICULAR PURPOSE OR USE, to the full extent permitted by law, regarding the accuracy, completeness, or usefulness of this information and assumes no liability with respect to the consequences of relying on this information for investment or other purposes. No content provided by CFRA (including ratings, credit-related analyses and data, valuations, model, software or other application or output therefrom) or any part thereof may be modified, reverse engineered, reproduced or distributed in any form by any means, or stored in a database or retrieval system, without the prior written permission of CFRA, and such content shall not be used for any unlawful or unauthorized purposes. CFRA and any third-party providers, as well as their directors, officers, shareholders, employees or agents do not guarantee the accuracy, completeness, timeliness or availability of such content. In no event shall CFRA, its affiliates, or their third-party suppliers be liable for any direct, indirect, special, or consequential damages, costs, expenses, legal fees, or losses (including lost income or lost profit and opportunity costs) in connection with a subscriber’s, subscriber’s customer’s, or other’s use of CFRA’s content.
Market Abuse Regulation (MAR) Disclaimer
Banking activities may be carried out internationally by different branches, subsidiaries and affiliates within the Standard Chartered Group according to local regulatory requirements. Opinions may contain outright “buy”, “sell”, “hold” or other opinions. The time horizon of this opinion is dependent on prevailing market conditions and there is no planned frequency for updates to the opinion. This opinion is not independent of Standard Chartered Group’s trading strategies or positions. Standard Chartered Group and/or its affiliates or its respective officers, directors, employee benefit programmes or employees, including persons involved in the preparation or issuance of this document may at any time, to the extent permitted by applicable law and/or regulation, be long or short any securities or financial instruments referred to in this document or have material interest in any such securities or related investments. Therefore, it is possible, and you should assume, that Standard Chartered Group has a material interest in one or more of the financial instruments mentioned herein. Please refer to our Standard Chartered website under Regulatory disclosures for more detailed disclosures, including past opinions/ recommendations in the last 12 months and conflict of interests, as well as disclaimers. A covering strategist may have a financial interest in the debt or equity securities of this company/issuer. All covering strategist are licensed to provide investment recommendations under Monetary Authority of Singapore or Hong Kong Monetary Authority. This document must not be forwarded or otherwise made available to any other person without the express written consent of Standard Chartered Group.
Sustainable Investments
Any ESG data used or referred to has been provided by Morningstar, Sustainalytics, MSCI or Bloomberg. Refer to 1) Morningstar website under Sustainable Investing, 2) Sustainalytics website under ESG Risk Ratings, 3) MCSI website under ESG Business Involvement Screening Research and 4) Bloomberg green, social & sustainability bonds guide for more information. The ESG data is as at the date of publication based on data provided, is for informational purpose only and is not warranted to be complete, timely, accurate or suitable for a particular purpose, and it may be subject to change. Sustainable Investments (SI): This refers to funds that have been classified as ‘Sustainable Investments’ by Morningstar. SI funds have explicitly stated in their prospectus and regulatory filings that they either incorporate ESG factors into the investment process or have a thematic focus on the environment, gender diversity, low carbon, renewable energy, water or community development. For equity, it refers to shares/stocks issued by companies with Sustainalytics ESG Risk Rating of Low/Negligible. For bonds, it refers to debt instruments issued by issuers with Sustainalytics ESG Risk Rating of Low/Negligible, and/or those being certified green, social, sustainable bonds by Bloomberg. For structured products, it refers to products that are issued by any issuer who has a Sustainable Finance framework that aligns with Standard Chartered’s Green and Sustainable Product Framework, with underlying assets that are part of the Sustainable Investment universe or separately approved by Standard Chartered’s Sustainable Finance Governance Committee. Sustainalytics ESG risk ratings shown are factual and are not an indicator that the product is classified or marketed as “green”, “sustainable” or similar under any particular classification system or framework.
Country/Market Specific Disclosures
Botswana: This document is being distributed in Botswana by, and is attributable to, Standard Chartered Bank Botswana Limited which is a financial institution licensed under the Section 6 of the Banking Act CAP 46.04 and is listed in the Botswana Stock Exchange. Brunei Darussalam: This document is being distributed in Brunei Darussalam by, and is attributable to, Standard Chartered Bank (Brunei Branch) | Registration Number RFC/61 and Standard Chartered Securities (B) Sdn Bhd | Registration Number RC20001003. Standard Chartered Bank is incorporated in England with limited liability by Royal Charter 1853 Reference Number ZC18. Standard Chartered Securities (B) Sdn Bhd is a limited liability company registered with the Registry of Companies with Registration Number RC20001003 and licensed by Brunei Darussalam Central Bank as a Capital Markets Service License Holder with License Number BDCB/R/CMU/S3-CL and it is authorised to conduct Islamic investment business through an Islamic window. China Mainland: This document is being distributed in China by, and is attributable to, Standard Chartered Bank (China) Limited which is mainly regulated by National Financial Regulatory Administration (NFRA), State Administration of Foreign Exchange (SAFE), and People’s Bank of China (PBOC). Hong Kong: In Hong Kong, this document, except for any portion advising on or facilitating any decision on futures contracts trading, is distributed by Standard Chartered Bank (Hong Kong) Limited (“SCBHK”), a subsidiary of Standard Chartered PLC. SCBHK has its registered address at 32/F, Standard Chartered Bank Building, 4-4A Des Voeux Road Central, Hong Kong and is regulated by the Hong Kong Monetary Authority and registered with the Securities and Futures Commission (“SFC”) to carry on Type 1 (dealing in securities), Type 4 (advising on securities), Type 6 (advising on corporate finance) and Type 9 (asset management) regulated activity under the Securities and Futures Ordinance (Cap. 571) (“SFO”) (CE No. AJI614). The contents of this document have not been reviewed by any regulatory authority in Hong Kong and you are advised to exercise caution in relation to any offer set out herein. If you are in doubt about any of the contents of this document, you should obtain independent professional advice. Any product named herein may not be offered or sold in Hong Kong by means of any document at any time other than to “professional investors” as defined in the SFO and any rules made under that ordinance. In addition, this document may not be issued or possessed for the purposes of issue, whether in Hong Kong or elsewhere, and any interests may not be disposed of, to any person unless such person is outside Hong Kong or is a “professional investor” as defined in the SFO and any rules made under that ordinance, or as otherwise may be permitted by that ordinance. In Hong Kong, Standard Chartered Private Bank is the private banking division of SCBHK, a subsidiary of Standard Chartered PLC. Ghana: Standard Chartered Bank Ghana Limited accepts no liability and will not be liable for any loss or damage arising directly or indirectly (including special, incidental or consequential loss or damage) from your use of these documents. Past performance is not indicative of future results and no representation or warranty is made regarding future performance. You should seek advice from a financial adviser on the suitability of an investment for you, taking into account these factors before making a commitment to invest in an investment. To unsubscribe from receiving further updates, please send an email to feedback.ghana@sc.com. Please do not reply to this email. Call our Priority Banking on 0302610750 for any questions or service queries. You are advised not to send any confidential and/or important information to Standard Chartered via e-mail, as Standard Chartered makes no representations or warranties as to the security or accuracy of any information transmitted via e-mail. Standard Chartered shall not be responsible for any loss or damage suffered by you arising from your decision to use e-mail to communicate with the Bank. India: This document is being distributed in India by Standard Chartered in its capacity as a distributor of mutual funds and referrer of any other third party financial products. Standard Chartered does not offer any ‘Investment Advice’ as defined in the Securities and Exchange Board of India (Investment Advisers) Regulations, 2013 or otherwise. Services/products related securities business offered by Standard Charted are not intended for any person, who is a resident of any jurisdiction, the laws of which imposes prohibition on soliciting the securities business in that jurisdiction without going through the registration requirements and/or prohibit the use of any information contained in this document. Indonesia: This document is being distributed in Indonesia by Standard Chartered Bank, Indonesia branch, which is a financial institution licensed and supervised by Otoritas Jasa Keuangan (Financial Service Authority) and Bank Indonesia. Jersey: In Jersey, Standard Chartered Private Bank is the Registered Business Name of the Jersey Branch of Standard Chartered Bank. The Jersey Branch of Standard Chartered Bank is regulated by the Jersey Financial Services Commission. Copies of the latest audited accounts of Standard Chartered Bank are available from its principal place of business in Jersey: PO Box 80, 15 Castle Street, St Helier, Jersey JE4 8PT. Standard Chartered Bank is incorporated in England with limited liability by Royal Charter in 1853 Reference Number ZC 18. The Principal Office of the Company is situated in England at 1 Basinghall Avenue, London, EC2V 5DD. Standard Chartered Bank is authorised by the Prudential Regulation Authority and regulated by the Financial Conduct Authority and Prudential Regulation Authority. The Jersey Branch of Standard Chartered Bank is also an authorised financial services provider under license number 44946 issued by the Financial Sector Conduct Authority of the Republic of South Africa. Jersey is not part of the United Kingdom and all business transacted with Standard Chartered Bank, Jersey Branch and other SC Group Entity outside of the United Kingdom, are not subject to some or any of the investor protection and compensation schemes available under United Kingdom law. Kenya: This document is being distributed in Kenya by and is attributable to Standard Chartered Bank Kenya Limited. Investment Products and Services are distributed by Standard Chartered Investment Services Limited, a wholly owned subsidiary of Standard Chartered Bank Kenya Limited that is licensed by the Capital Markets Authority in Kenya, as a Fund Manager. Standard Chartered Bank Kenya Limited is regulated by the Central Bank of Kenya. Malaysia: This document is being distributed in Malaysia by Standard Chartered Bank Malaysia Berhad (“SCBMB”). Recipients in Malaysia should contact SCBMB in relation to any matters arising from, or in connection with, this document. This document has not been reviewed by the Securities Commission Malaysia. The product lodgement, registration, submission or approval by the Securities Commission of Malaysia does not amount to nor indicate recommendation or endorsement of the product, service or promotional activity. Investment products are not deposits and are not obligations of, not guaranteed by, and not protected by SCBMB or any of the affiliates or subsidiaries, or by Perbadanan Insurans Deposit Malaysia, any government or insurance agency. Investment products are subject to investment risks, including the possible loss of the principal amount invested. SCBMB expressly disclaim any liability and responsibility for any loss arising directly or indirectly (including special, incidental or consequential loss or damage) arising from the financial losses of the Investment Products due to market condition. Nigeria: This document is being distributed in Nigeria by Standard Chartered Bank Nigeria Limited (SCB Nigeria), a bank duly licensed and regulated by the Central Bank of Nigeria. SCB Nigeria accepts no liability for any loss or damage arising directly or indirectly (including special, incidental or consequential loss or damage) from your use of these documents. You should seek advice from a financial adviser on the suitability of an investment for you, taking into account these factors before making a commitment to invest in an investment. To unsubscribe from receiving further updates, please send an email to clientcare.ng@sc.com requesting to be removed from our mailing list. Please do not reply to this email. Call our Priority Banking on 02 012772514 for any questions or service queries. SCB Nigeria shall not be responsible for any loss or damage arising from your decision to send confidential and/or important information to Standard Chartered via e-mail. SCB Nigeria makes no representations or warranties as to the security or accuracy of any information transmitted via e-mail. Pakistan: This document is being distributed in Pakistan by, and attributable to Standard Chartered Bank (Pakistan) Limited having its registered office at PO Box 5556, I.I Chundrigar Road Karachi, which is a banking company registered with State Bank of Pakistan under Banking Companies Ordinance 1962 and is also having licensed issued by Securities & Exchange Commission of Pakistan for Security Advisors. Standard Chartered Bank (Pakistan) Limited acts as a distributor of mutual funds and referrer of other third-party financial products. Singapore: This document is being distributed in Singapore by, and is attributable to, Standard Chartered Bank (Singapore) Limited (Registration No. 201224747C/ GST Group Registration No. MR-8500053-0, “SCBSL”). Recipients in Singapore should contact SCBSL in relation to any matters arising from, or in connection with, this document. SCBSL is an indirect wholly owned subsidiary of Standard Chartered Bank and is licensed to conduct banking business in Singapore under the Singapore Banking Act, 1970. Standard Chartered Private Bank is the private banking division of SCBSL. IN RELATION TO ANY SECURITY OR SECURITIES-BASED DERIVATIVES CONTRACT REFERRED TO IN THIS DOCUMENT, THIS DOCUMENT, TOGETHER WITH THE ISSUER DOCUMENTATION, SHALL BE DEEMED AN INFORMATION MEMORANDUM (AS DEFINED IN SECTION 275 OF THE SECURITIES AND FUTURES ACT, 2001 (“SFA”)). THIS DOCUMENT IS INTENDED FOR DISTRIBUTION TO ACCREDITED INVESTORS, AS DEFINED IN SECTION 4A(1)(a) OF THE SFA, OR ON THE BASIS THAT THE SECURITY OR SECURITIES-BASED DERIVATIVES CONTRACT MAY ONLY BE ACQUIRED AT A CONSIDERATION OF NOT LESS THAN S$200,000 (OR ITS EQUIVALENT IN A FOREIGN CURRENCY) FOR EACH TRANSACTION. Further, in relation to any security or securities-based derivatives contract, neither this document nor the Issuer Documentation has been registered as a prospectus with the Monetary Authority of Singapore under the SFA. Accordingly, this document and any other document or material in connection with the offer or sale, or invitation for subscription or purchase, of the product may not be circulated or distributed, nor may the product be offered or sold, or be made the subject of an invitation for subscription or purchase, whether directly or indirectly, to persons other than a relevant person pursuant to section 275(1) of the SFA, or any person pursuant to section 275(1A) of the SFA, and in accordance with the conditions specified in section 275 of the SFA, or pursuant to, and in accordance with the conditions of, any other applicable provision of the SFA. In relation to any collective investment schemes referred to in this document, this document is for general information purposes only and is not an offering document or prospectus (as defined in the SFA). This document is not, nor is it intended to be (i) an offer or solicitation of an offer to buy or sell any capital markets product; or (ii) an advertisement of an offer or intended offer of any capital markets product. Deposit Insurance Scheme: Singapore dollar deposits of non-bank depositors are insured by the Singapore Deposit Insurance Corporation, for up to S$100,000 in aggregate per depositor per Scheme member by law. Foreign currency deposits, dual currency investments, structured deposits and other investment products are not insured. This advertisement has not been reviewed by the Monetary Authority of Singapore. Taiwan: SC Group Entity or Standard Chartered Bank (Taiwan) Limited (“SCB (Taiwan)”) may be involved in the financial instruments contained herein or other related financial instruments. The author of this document may have discussed the information contained herein with other employees or agents of SC or SCB (Taiwan). The author and the above-mentioned employees of SC or SCB (Taiwan) may have taken related actions in respect of the information involved (including communication with customers of SC or SCB (Taiwan) as to the information contained herein). The opinions contained in this document may change, or differ from the opinions of employees of SC or SCB (Taiwan). SC and SCB (Taiwan) will not provide any notice of any changes to or differences between the above-mentioned opinions. This document may cover companies with which SC or SCB (Taiwan) seeks to do business at times and issuers of financial instruments. Therefore, investors should understand that the information contained herein may serve as specific purposes as a result of conflict of interests of SC or SCB (Taiwan). SC, SCB (Taiwan), the employees (including those who have discussions with the author) or customers of SC or SCB (Taiwan) may have an interest in the products, related financial instruments or related derivative financial products contained herein; invest in those products at various prices and on different market conditions; have different or conflicting interests in those products. The potential impacts include market makers’ related activities, such as dealing, investment, acting as agents, or performing financial or consulting services in relation to any of the products referred to in this document. UAE: DIFC – Standard Chartered Bank is incorporated in England with limited liability by Royal Charter 1853 Reference Number ZC18.The Principal Office of the Company is situated in England at 1 Basinghall Avenue, London, EC2V 5DD. Standard Chartered Bank is authorised by the Prudential Regulation Authority and regulated by the Financial Conduct Authority and Prudential Regulation Authority. Standard Chartered Bank, Dubai International Financial Centre having its offices at Dubai International Financial Centre, Building 1, Gate Precinct, P.O. Box 999, Dubai, UAE is a branch of Standard Chartered Bank and is regulated by the Dubai Financial Services Authority (“DFSA”). This document is intended for use only by Professional Clients and is not directed at Retail Clients as defined by the DFSA Rulebook. In the DIFC we are authorised to provide financial services only to clients who qualify as Professional Clients and Market Counterparties and not to Retail Clients. As a Professional Client you will not be given the higher retail client protection and compensation rights and if you use your right to be classified as a Retail Client we will be unable to provide financial services and products to you as we do not hold the required license to undertake such activities. For Islamic transactions, we are acting under the supervision of our Shariah Supervisory Committee. Relevant information on our Shariah Supervisory Committee is currently available on the Standard Chartered Bank website in the Islamic banking section. For residents of the UAE – Standard Chartered Bank UAE does not provide financial analysis or consultation services in or into the UAE within the meaning of UAE Securities and Commodities Authority Decision No. 48/r of 2008 concerning financial consultation and financial analysis. Uganda: Our Investment products and services are distributed by Standard Chartered Bank Uganda Limited, which is licensed by the Capital Markets Authority as an investment adviser. United Kingdom: In the UK, Standard Chartered Bank is authorised by the Prudential Regulation Authority and regulated by the Financial Conduct Authority and Prudential Regulation Authority. This communication has been approved by Standard Chartered Bank for the purposes of Section 21 (2) (b) of the United Kingdom’s Financial Services and Markets Act 2000 (“FSMA”) as amended in 2010 and 2012 only. Standard Chartered Bank (trading as Standard Chartered Private Bank) is also an authorised financial services provider (license number 45747) in terms of the South African Financial Advisory and Intermediary Services Act, 2002. The Materials have not been prepared in accordance with UK legal requirements designed to promote the independence of investment research, and that it is not subject to any prohibition on dealing ahead of the dissemination of investment research. Vietnam: This document is being distributed in Vietnam by, and is attributable to, Standard Chartered Bank (Vietnam) Limited which is mainly regulated by State Bank of Vietnam (SBV). Recipients in Vietnam should contact Standard Chartered Bank (Vietnam) Limited for any queries regarding any content of this document. Zambia: This document is distributed by Standard Chartered Bank Zambia Plc, a company incorporated in Zambia and registered as a commercial bank and licensed by the Bank of Zambia under the Banking and Financial Services Act Chapter 387 of the Laws of Zambia.