24 April 2026
Global Market Outlook
An uneasy truce
Further de-escalation of the Middle East conflict and a softening of oil prices remain our base case. However, bouts of market volatility are likely in the absence of a firm US-Iran deal. We remain Overweight equities and gold.
We remain Overweight US and Asia ex-Japan equities. Strong earnings are expected to support further gains in US equities, led by the technology sector. Asian equities should benefit from renewed USD weakness and robust earnings.
Oil price scenarios are key. Logistical challenges are expected to result in WTI crude oil settling in the USD 80-90/bbl range over the next 1-3 months even if the Strait of Hormuz fully reopens. Renewed conflict escalation and a resulting rise in oil prices remain key risks for now.
Why USD 100/bbl oil isn’t an economy killer
Managing allocations in volatile markets
Are quantitative models still bullish equities?
Strategy
Investment strategy and key themes
|
|
||||
|

12m Foundation Overweights:
- Global equities, gold
- US, Asia ex-Japan equities
- Emerging Market (EM) USD and local currency (LCY)
Opportunistic ideas – Equities
- Global: Semiconductors, buybacks, gold miners^
- US: Aerospace and defence, utilities
- China: Hang Seng Technology Index
Top Global Sectors:
- US: Technology, communication services^, utilities, healthcare
- Europe ex-UK: Financials
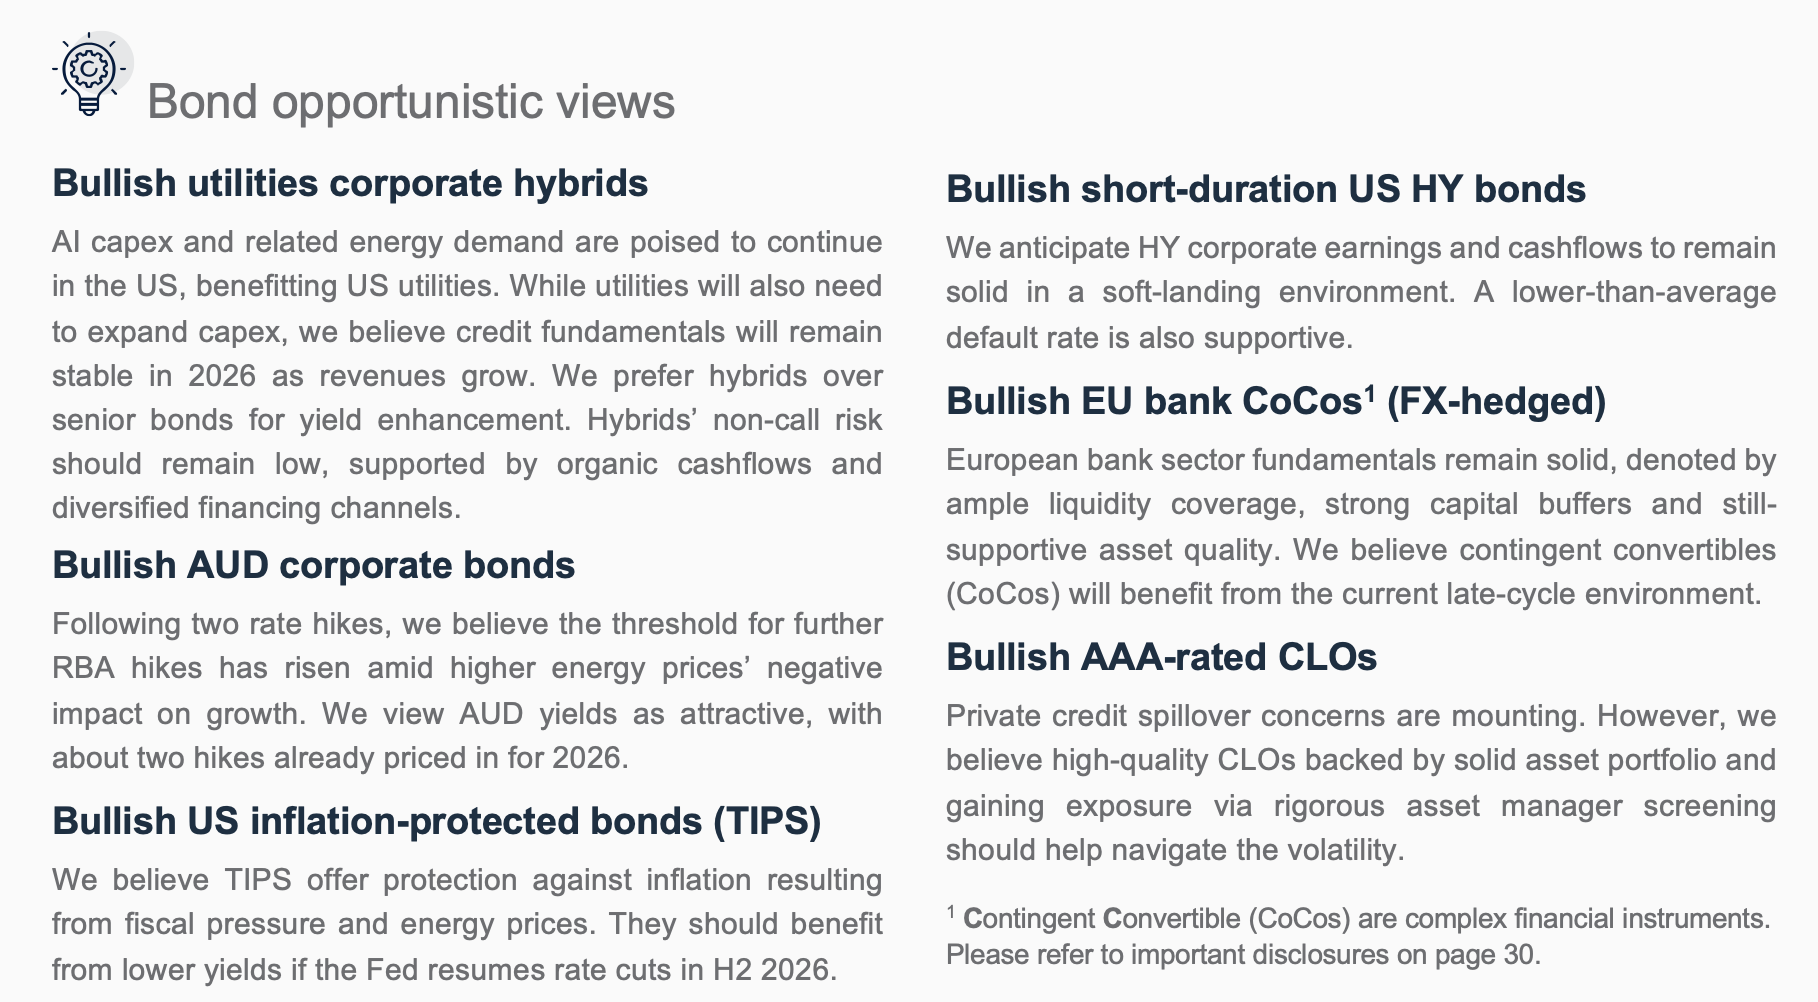
Opportunistic ideas – Bonds
- US: Treasury Inflation-protected Securities (TIPS), short-duration high-yield (HY) bonds, AAA CLOs, utility sector hybrids
- EU: Bank AT1s FX-hedged
- Others: AUD corporate bonds
An uneasy truce
- Further de-escalation of the Middle East conflict and a softening of oil prices remain our base case. However, bouts of market volatility are likely in the absence of a firm US-Iran deal. We remain Overweight equities and gold.
- We remain Overweight US and Asia ex-Japan (AxJ) equities. Strong earnings are expected to support further gains in US equities, led by the technology sector. Asian equities should benefit from renewed USD weakness and robust earnings.
- Oil price scenarios are key. Logistical realities are expected to result in WTI crude oil settling around USD 80-90/bbl over the next 1-3 months even if the Strait of Hormuz fully reopens. Renewed conflict escalation and a resulting rise in oil prices remain key risks for now.
We stay positive, but it’s never a straight line
The Middle East stand-off continues to dominate headlines and investor thinking, resulting in a sharp focus on when shipping transit through the Strait of Hormuz will restart, its impact on oil prices and related market movements. In our base case, we expect the ongoing move towards conflict de-escalation to continue in the coming weeks, albeit with bouts of headline volatility. Having said that, the tail risk of an unexpected resumption of hostilities remains present for now.
Financial markets thus far agree with us. Despite the Middle East conflict, US equities achieved a new record high after only a relatively modest pullback. This coincided with the return of oil prices to around USD 100/bbl and a related easing in US bond yields and the USD. We would avoid extrapolating straight-line gains, but overall, if de-escalation continues, we expect equities and gold to outperform bonds and cash.
The threat of inflation is likely to be an area of focus over the next couple of months. However, we expect the global economy to avoid a sustained rise in inflation. In the US, this should allow the Fed to achieve one rate cut before year-end 2026, while in Europe, the ECB likely needs to raise rates only once. That said, markets may be excessively overpricing the extent of central bank hawkishness, creating rate opportunities, particularly in short-to-intermediate US bond maturities.
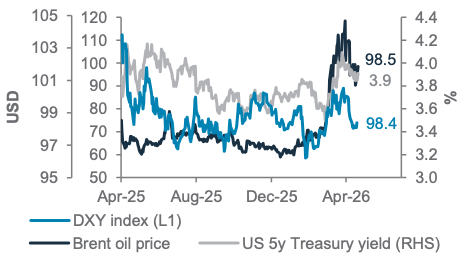
Fig. 1 Softening energy prices have helped US yields and the USD to fall, despite headline risks
Oil, US 5Y government bond yield and the US Dollar Index
Tech to lead US equities
We remain Overweight US equities, which have outperformed other major regions throughout the period of hostilities, including during the current rebound. This is due to the US economy’s lower dependence on Middle East energy versus Asia and Europe and a relatively stronger earnings outlook.
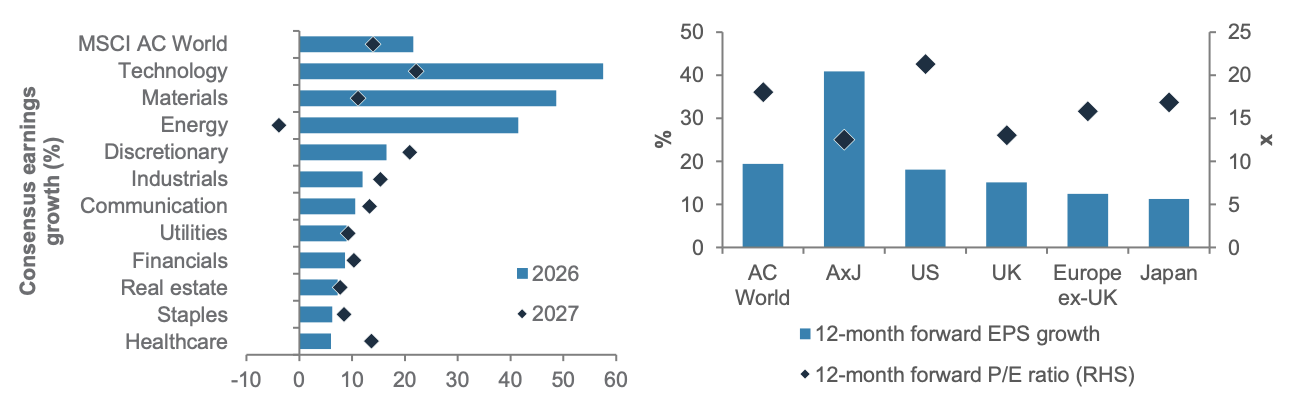
A more significant inflation shock would have been a stronger headwind for US equity markets. However, we believe easing energy prices and well-behaved, long-term market-based inflation expectations, together with a soft job market, will allow the Fed to stay on hold and resume rate cuts before year-end. This means equity markets are likely to continue their focus on earnings growth. Here, data remains very strong, with Q1 2026 earnings reinforcing market expectations for full-year 2026 earnings growth of 19%.
We expect the technology sector to keep its lead, especially after the recent valuation de-rating, light investor positioning and a recent positive set of catalysts via funding commitments and improved pricing power. We also raise the US communication services sector to Overweight on an improving digital advertising environment and expanding opportunities to monetise artificial intelligence (AI) investments.
We also maintain our Overweight on AxJ equities. The region undoubtedly remains sensitive to energy prices and any renewed rise in tensions from both the economic and corporate profitability perspectives. However, in a world of flat-to-lower oil prices from here, we expect two catalysts to pick up the slack. First, the strong technology sector earnings, which should spill over positively, particularly for North Asian equities. Second, the resumption of a weak USD, which is consistent with further outperformance of Asian equities.
Within Asia, we maintain our ‘barbell’ regional preference. Our Overweight to China and Taiwan equities should benefit from strong technology sector earnings and a renewed focus on the AI theme. At the other end, our Overweight on Indian equities has little direct exposure to AI, but this should benefit from very light investor positioning, well-supported earnings growth and gradually lower oil prices/weaker USD.
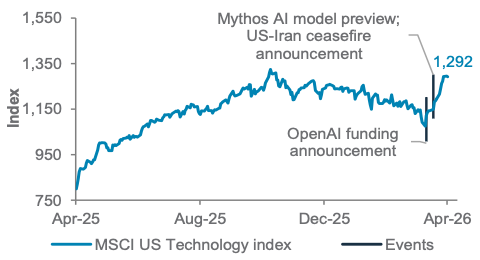
Fig. 2 Funding announcements and pricing power helped US tech sector bottom; we expect further gains
MSCI US technology sector Index
Capturing yield and taking profit in bonds
We expect long-term inflation expectations to remain stable. Thus, we see any rebound in bond yields as temporary and as opportunities to lock in the yield at the short-to-intermediate parts of yield curves as they re-steepen, with central banks delivering less tightening than currently priced by markets.
Our Overweight to Emerging Market (EM) bonds (USD and LCY) remains unchanged. Spreads widened in response to the Middle East conflict but have since retraced most of the move. Looking ahead, EM bonds should benefit from renewed appetite for risky asset classes and a softer USD as the conflict de-escalates. However, they remain vulnerable to a downside risk scenario involving a renewed rise in oil prices.
We also trim our view on Developed Market (DM) HY bonds to Neutral following a rise in valuations. Credit quality and yields remain attractive, but we see better risk-reward now in our short-duration US HY bonds opportunistic idea.
Oil prices could hit a near-term floor
One key assumption behind many of our views is that oil prices continue to drift gradually lower in our base case.
However, there are two reasons why a quick return to pre-conflict oil prices is unlikely. First, the time needed to fully resume Middle East oil and gas output. Shipping will take time to resume even if the Strait of Hormuz is reopened quickly, and damaged facilities will take time to repair. Second, inventories will need to be rebuilt, adding a new source of demand in the coming months and years. Together, this is why we revise higher our 3-month WTI oil price forecast to USD 80-90/bbl and our 12-month forecast to USD 70/bbl.
A downside scenario of renewed hostilities, with a resulting surge in energy prices, remains a risk. However, compared with the 1970s, the global economy is considerably more energy-efficient and oil prices in the current episode have remained below prior highs once adjusted for inflation. Thus, we expect risks to be manageable unless prices settle above USD 150/bbl.
Foundation asset allocation models
The Foundation and Foundation+ models are allocations that you can use as the starting point for building a diversified investment portfolio. The Foundation model showcases a set of allocations focusing on traditional asset classes that are accessible to most investors, while the Foundation+ model includes allocations to private assets that may be accessible to investors in some jurisdictions, but not others.
Fig. 3 Foundation asset allocation for a balanced risk profile
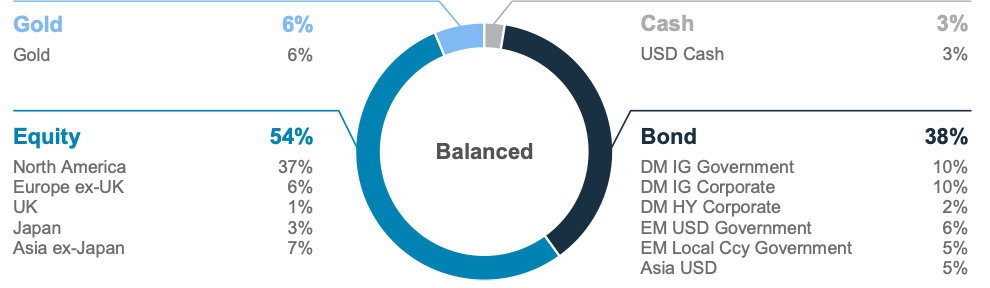
Fig. 4 Foundation+ asset allocation for a balanced risk profile
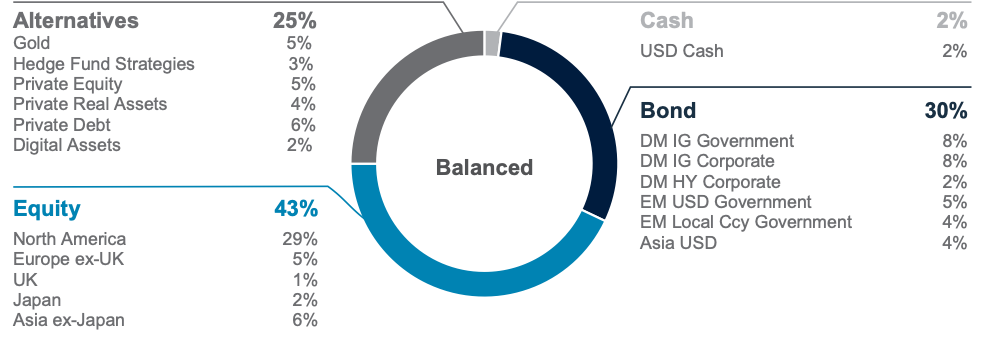
Fig. 5 Multi-asset income allocation for a moderate risk profile
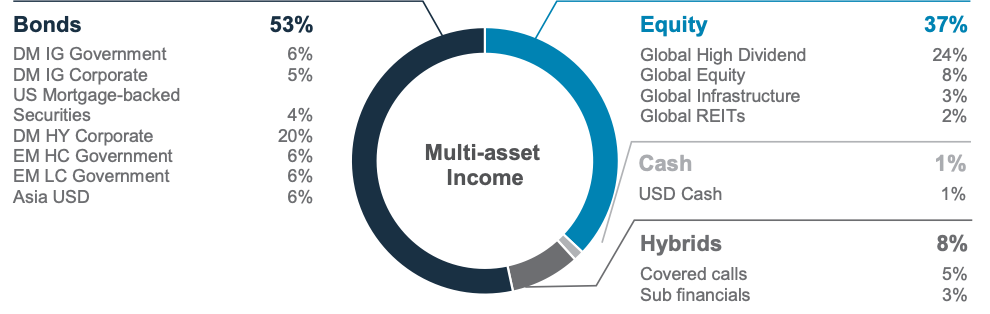
Source: Standard Chartered
Foundation: Our tactical asset allocation views
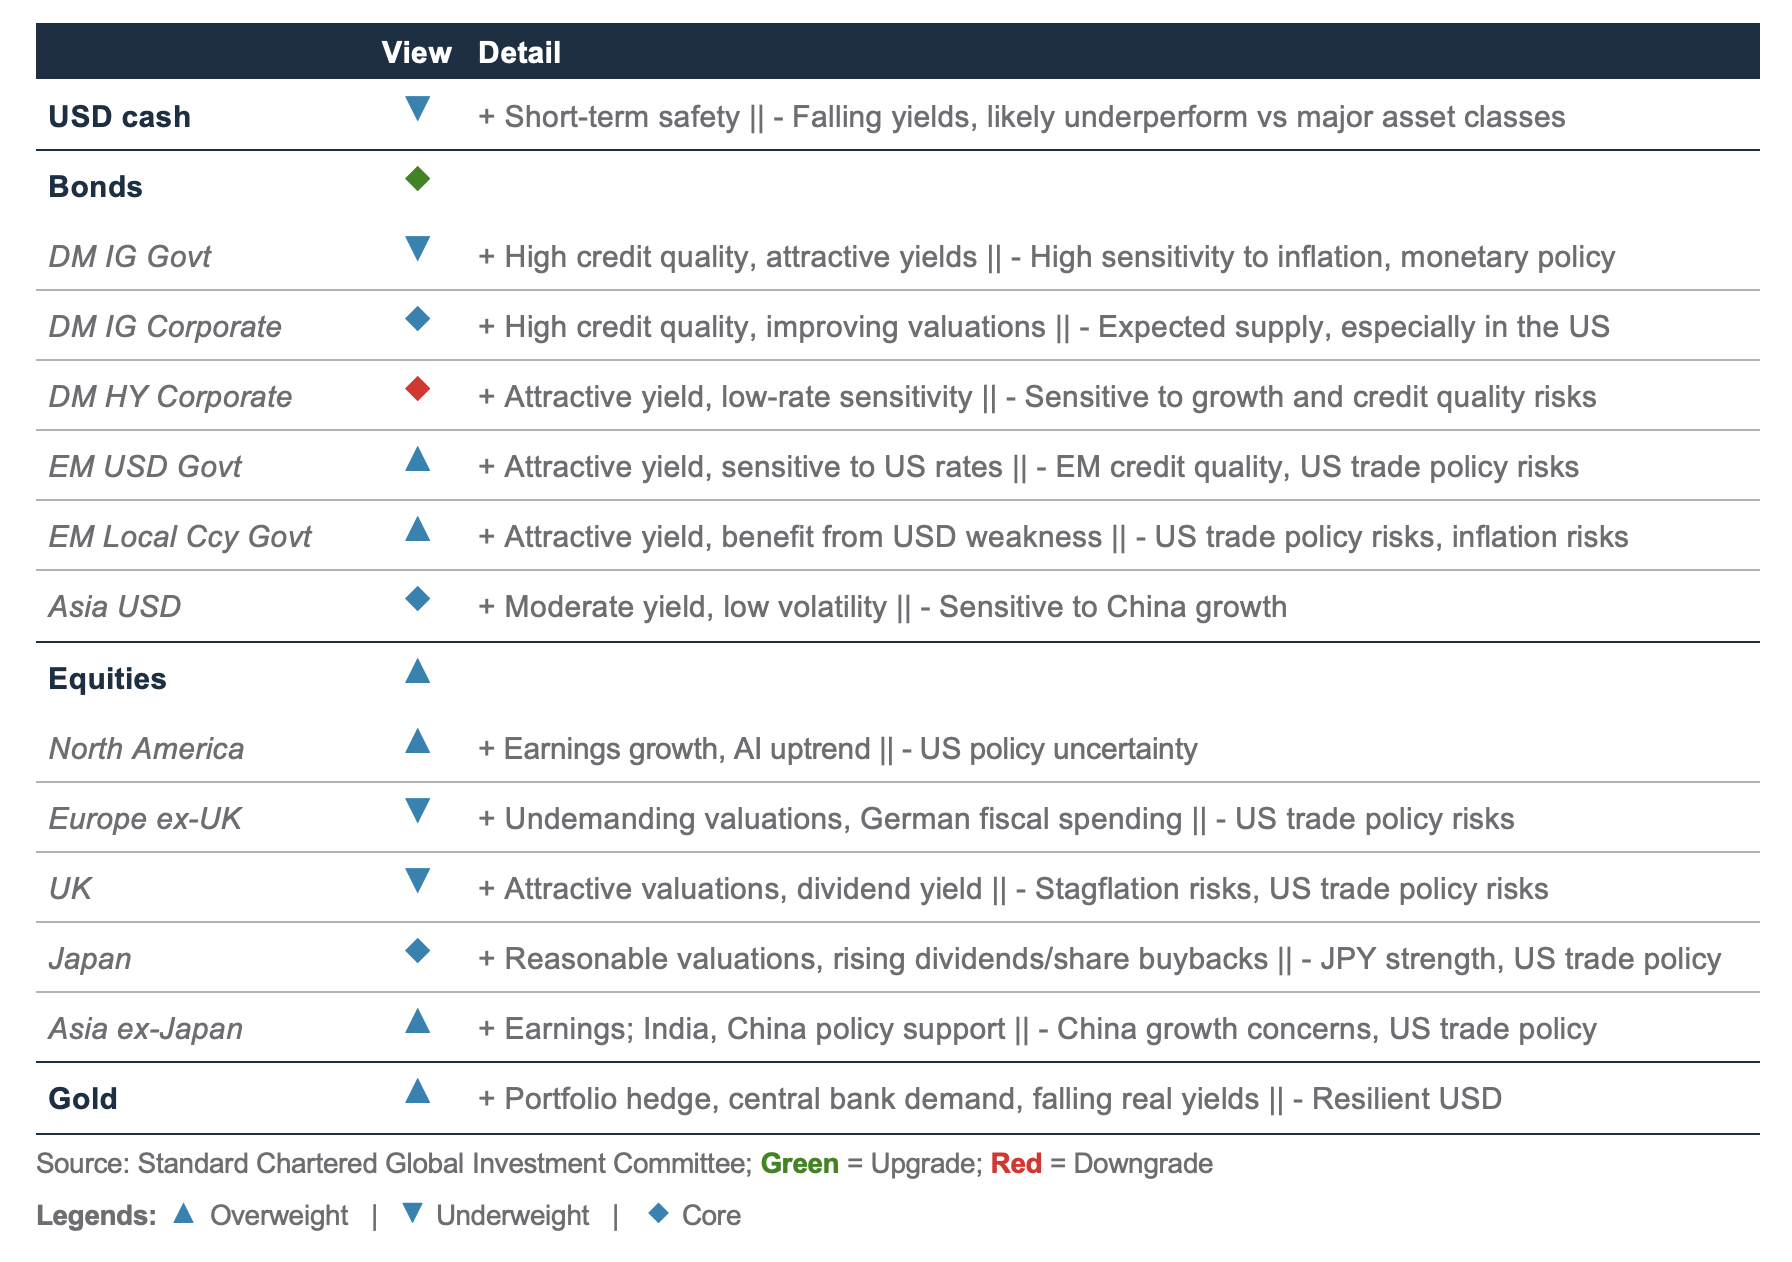
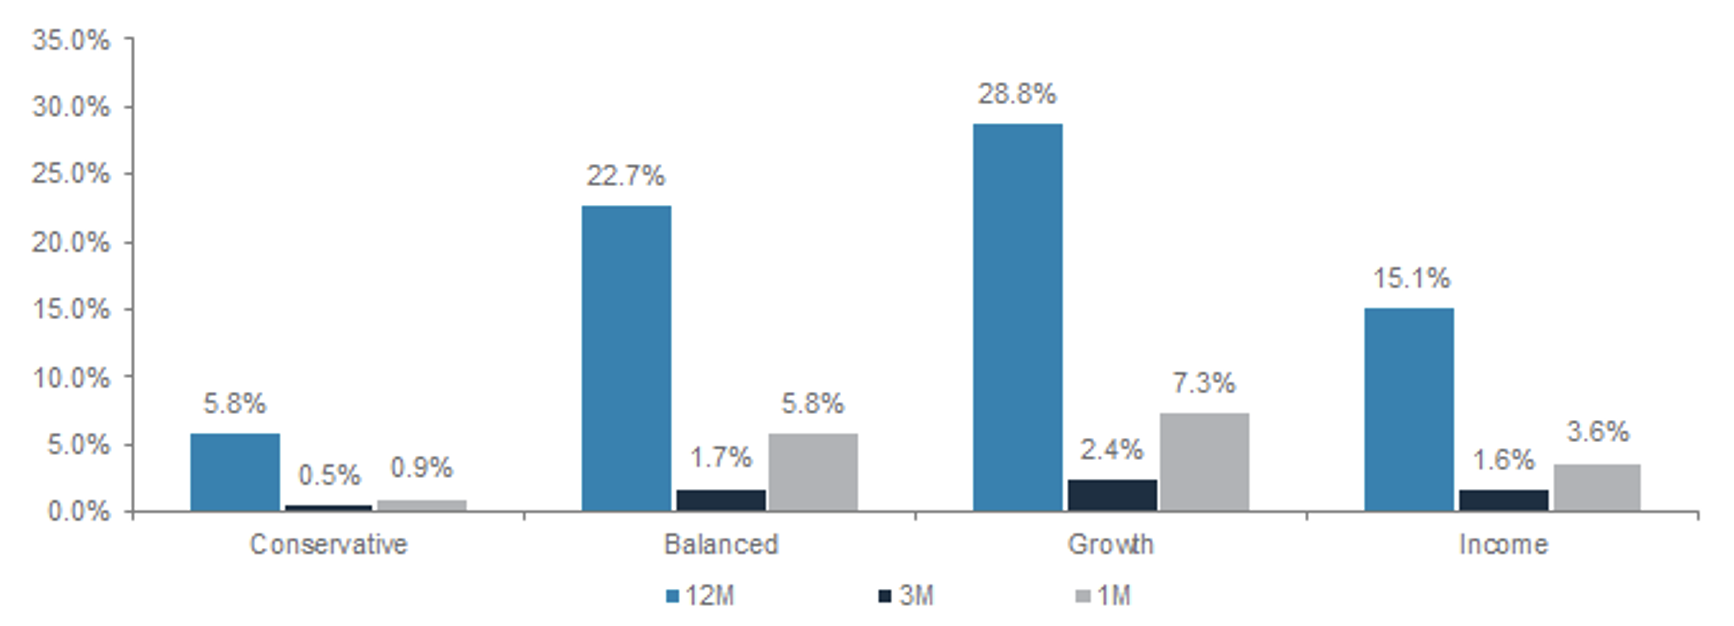
Fig. 6 Performance of our Foundation Allocations*
Perspectives on key client questions
|
|
|
Managing allocations in volatile markets
The current global macro environment, marked by uncertainty around Middle East tensions, oil price swings and inflationary pressures, presents a formidable challenge for investors. Allocation management in such tricky times can benefit from these eight historical lessons gathered from past events, including the 2008 global financial crisis and the 2020 pandemic:
Lesson 1: Investment timeframe matters
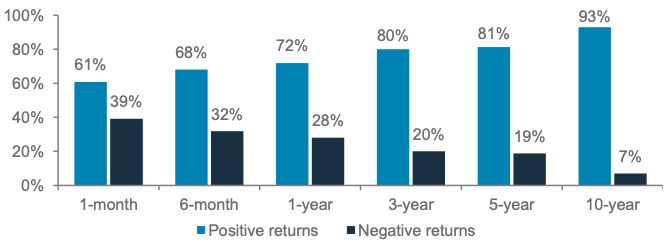
Bear markets tend to be sharp, but short-lived. A historical analysis of global equity returns from 1988 to 2026 shows that the probability of enduring negative returns drops substantially as the investment horizon extends. While the probability of a negative return is 32% over a six-month period, it falls to just 7% over a 10-year period. Thus, extending the time horizon significantly increases the probability of earning positive returns.
Fig. 7 Probability of return drawdown drops significantly as we extend investment timeframe
Distribution of 1-month, 6-month, 12-month, 3-year, 5-year and 10-year returns of MSCI All Country World Index (data from 1988 to 2026)

Lesson 2: Staying invested through volatility
Prospect theory suggests the pain of financial loss is twice as intensely felt as the joy of financial gain, often driving investors to exit the market when things are ugly. However, timing the market is, more often than not, a losing game.
Fig. 8 Despite intra-year volatility, the MSCI ACWI Index had positive year-end total returns 28 out of the last 38 years since 1988
MSCI ACWI largest declines vs. full year returns (1988-2025)
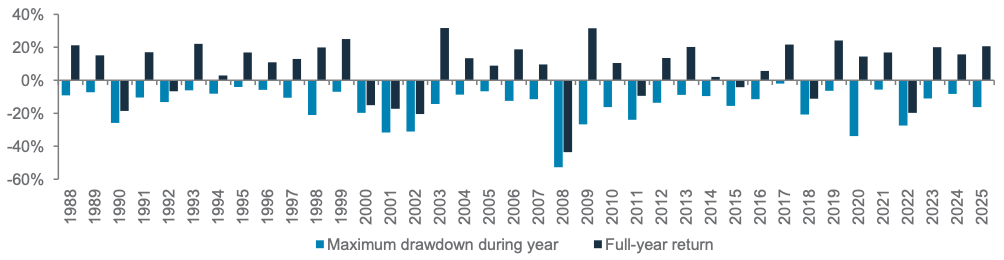
In the chart above, the light blue bars represent the largest declines from a peak to a trough that occurred within each year, while the dark blue bars represent the corresponding return for the full calendar year. Despite significant intra-year volatility, the global equity index had positive year-end total returns in 28 out of the last 38 years since 1988. Thus, history shows that staying invested and riding through bear markets proves beneficial.
Lesson 3: Power of diversification
Portfolio diversification is paramount during tough times, as it provides investors with more staying power – better risk tolerance and downside protection – to absorb emotions during distressed periods. Diversified allocations have historically performed well after periods of major market downturns.
Lesson 4: The cost of de-risking
If you think your portfolio is not aligned with your long-term
objectives, or if you have a more bearish future view, you might want to (i) reduce exposure to risky assets or (ii) incrementally add adequate protection.
That said, de-risking when market uncertainty is elevated is not free of risks. Rotating to a safe-haven asset, such as bonds, leaves you more vulnerable to a sharp rise in yields (bond prices fall when yields rise, a situation that played out in 2022). There are also embedded opportunity costs of missing out on gains from potential rebounds in risk assets, such as equities and HY bonds.
Lesson 5: Resilience for the long and winding road
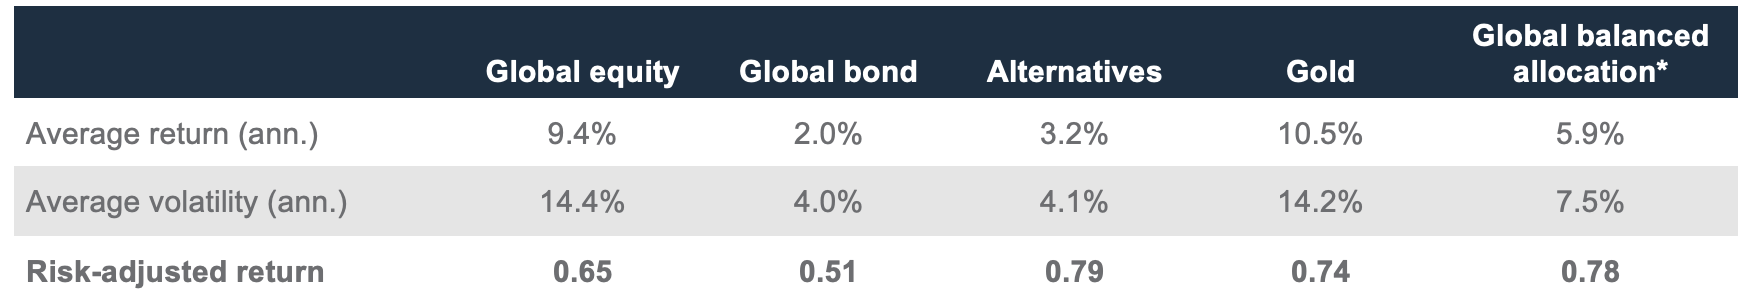
As we progress through a volatile economic cycle characterised by high interest rates and inflationary pressure, we believe a well-diversified, balanced allocation remains a prudent approach. Historically, such portfolios have shown superior risk-adjusted returns (lower risk per unit of return) once you look through the relatively short period of volatility.
Fig. 9 A well-diversified allocation shows superior long-term performance
Annualised returns and volatilities of various assets and a global balanced allocation since 2016
Lesson 6: Long-volatility strategies as a hedge
Instead of fearing volatility, long-volatility strategies seek to capitalise on it by providing insurance-like payoffs. However, appropriately sizing such strategies is key as one would expect these to deliver negative returns once risks recede. Common techniques to implement long-volatility strategies include:
- Options: Call and put options give investors the right to buy or sell assets at predetermined prices
- Strangle and straddle: These strategies allow investors to profit from extreme market volatility in either direction without needing a clear directional view
- Volatility Index (VIX)-based instruments: The VIX fear gauge measures expected volatility. VIX futures and options, or VIX-based exchange-traded funds or notes, provide ways to profit from or hedge against extreme market swings.
Lesson 7: Volatility targeting to stabilise portfolio risk
Volatility targeting is an emerging quant strategy used to keep portfolio risk at steady levels. Methods include
- Portfolio volatility targeting: Adjusts exposure to high-risk assets, such as derivatives, based on market volatility
- Dynamic volatility scaling: Adjusts allocations based on individual asset volatility and long-term correlations
- Volatility switching: Uses quant models to identify historical patterns and realign portfolios to benefit from major market dislocations
- Momentum filter: Helps limit further downside by avoiding investments in assets that are dipping
Lesson 8: Keep emotions and biases under check
Fear and panic often lead to massive sell-offs during market downturns. Similarly, euphoria and greed lead to heated valuations when the market is on an uptrend. Thus, decisions fuelled by anxiety often lead to poor market timing or investors abandoning their long-term financial plans. To counter this, investors should develop self-awareness of inherent biases, use well-structured investment plans, apply rule-based strategies – such as dollar-cost averaging and hedging – or consult an expert.
Why USD 100 oil isn’t the economy-killer it used to be?
Just how much should investors worry about high oil prices? Amid the ongoing Middle East conflict, it is not surprising investors are focused on energy prices, given these remain the main channel to global financial markets. However, many have been surprised by the uneven impact across different markets. For example, the pullback in US equities has been relatively muted, and the market subsequently went on to make a new record high.
While we should not be complacent about downside risks, it is equally important to balance the downside risk with what we see as attractive opportunities, especially if worst-case scenarios fail to play out.
Why this isn’t a 1970s sequel?
The 1970s oil crises involved two major supply shocks – the 1973 Arab oil embargo and the 1979 Iranian Revolution – which nearly quadrupled oil prices, triggered global stagflation (a debilitating combination of sustained high inflation and stagnant economic growth) and created severe fuel shortages.
Given this historical precedent, one would have thought that the recent Brent crude oil price rise of about 75% since mid-February would have resulted in markets focusing entirely on an upcoming inflation shock, recession risk and a stagflationary world ahead. However, over the same period, US equities fell by 7.5% and the 10-year US government bond yield held below 4.5% – not exactly the growth or inflation shock one would have expected, given the staggering rise in oil prices.
The clue sits in energy intensity – the amount of oil or gas needed per unit of GDP growth. Since the 1970s, energy intensity has fallen dramatically.
The World Bank, for instance, estimates that the amount of oil required to generate one unit of global GDP growth fell from 0.12 tonnes of oil equivalent (toe) in 1970 to 0.05 toe in 2022 – about a 58% reduction. Researchers at the Harvard Kennedy School found that the amount of oil required to generate USD 1,000 of global GDP has fallen by an average of 1.5 litres each year since 1984. S&P Global estimates that oil prices would have to rise to the USD 150-200/bbl range to have a macroeconomic impact similar to historical energy shocks over the past 60 years.
The bottom line? Oil prices hovering around USD 100/bbl are high, but not as high as they were for the global economy during historical energy price shocks.
Trust market resilience, but hedge the risks
The purpose of this perspective is not to foster complacency. Rather, it is to remind us that both risks and opportunities lie in front of us.
We certainly believe it is worthwhile to hedge against risks. Today’s USD 100/bbl oil prices are expected to result in at least a moderate rise in inflation. However, a significant energy shock would involve either a rise towards levels that had an impact previously, such as USD 150-200/bbl, or would result from prices staying above USD 100/bbl for a prolonged period, pushing the average price higher for the year.
One preferred short-term hedge is inflation-protected bonds, which directly hedge yields against the US inflation index. Gold would also be an attractive hedge against a more stagflationary environment.
Hunting for value amid uncertainty
Downside risks notwithstanding, our baseline view continues to be that the current energy supply disruption is likely to be relatively short-lived. In this scenario, it would make sense first and foremost to stay invested in well-diversified portfolios, which in themselves offer an attractive entry point for long-term investors. More specifically, we would look for opportunities in asset classes that may post the strongest rebound if the high energy price threat recedes.
At the top of our shopping list are Asian equities. This is based on their relatively higher growth and balance-of-payment sensitivity to both oil prices and the USD. An easing of energy supply disruptions and lower oil prices is a scenario in which Asian equities may post the strongest recovery as downside risks are priced out.
Ultimately, the goal isn’t just to survive the oil price spike, but to thrive beyond it. The current oil shock may very well prove to be a pivotal bargain-hunting opportunity this year.

Macro overview – at a glance
Our macroeconomic outlook and key questions
|
Key themes
Core scenario (soft landing, 60% probability): We expect the Strait of Hormuz to reopen to traffic in the next few weeks, given the constraints on both the US and Iran which argue against a prolonged blockade. This is likely to sustain our base scenario of an economic soft landing this year. While near-term inflation is likely to rise with elevated oil prices, an early resolution should keep long-term inflation expectations in check, allowing central banks to focus on fundamentals. As near-term inflation rises, we expect the Fed to hold rates in H1 but eventually cut by 25bps in H2 as focus turns to reviving the job market. The ECB is likely to hike rates once and the BoJ twice to counter inflation, while China eases policy to encourage consumption-led growth.
Downside risk (hard landing, 30% probability): We raise the risk of a hard landing from 25% if the Middle East conflict leaves oil prices significantly higher for longer, delaying Fed rate cuts and negatively impacting real incomes and consumption. A stock market downturn hurting investor confidence and/or a bond selloff on inflation and/or debt concerns are other tail risks.
Upside risk (no landing, 10% probability): In the event of a swift resolution in the Middle East, there is still a chance that US tax and Fed rate cuts, fiscal easing in Germany, China and Japan and a potential rollback of US tariffs could revive animal spirits. A Russia-Ukraine peace deal, a US-China grand bargain or EU-wide defence spending can potentially lift global growth.
Key chart
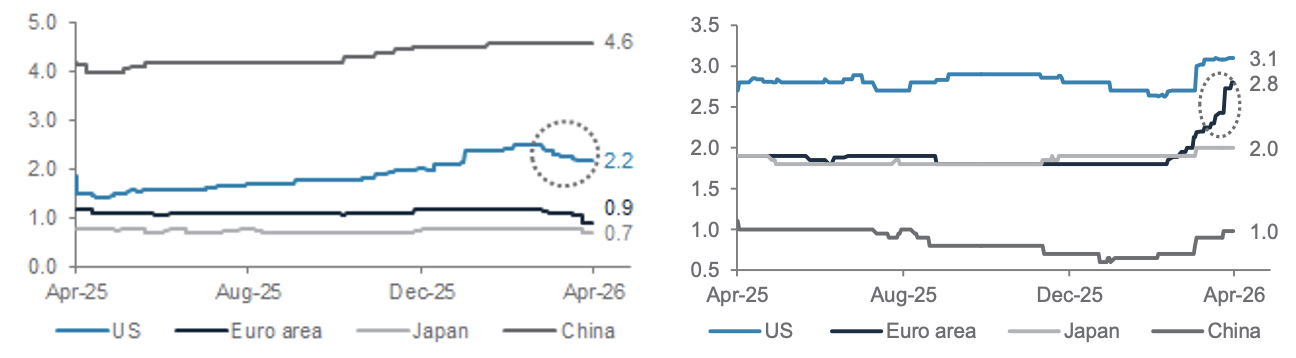
The Fed is likely to focus on reviving growth and the job market in H2 by cutting rates; the ECB, being an inflation- targeting bank, is likely to deliver an insurance hike to counter inflation pressures; China, facing low inflation, is likely to ease policy
Fig. 14 The US faces growth risk, the Euro area stagflation risk due to the Iran crisis
Consensus estimates for 2026 GDP growth and inflation across major economies
Policy rates watch
Fed to hold in H1, cut rates by 25bps to 3.5% by December: The US economy was poised for a soft landing before the Middle East conflict. Real consumer spending had slowed in February, wage growth was decelerating, consumer confidence was depressed and the job market was stalling. The surge in gasoline prices has delivered an estimated 0.5% of GDP equivalent hit to consumer disposable incomes, raising the risk of a Q2 growth slowdown. That said, under our base scenario of a short-lived conflict wherein the Strait of Hormuz reopens by May and oil prices retreat towards USD 80-90/bbl, the pre-existing US soft-landing story reasserts itself, with growth in 2026 estimated just below the 2% trend. Corporate margins would be preserved, and the energy shock would be absorbed as a temporary soft patch rather than a structural downturn.
A short-lived conflict implies the inflationary impulse remains transitory. Inflation swaps are pricing in around 3.3% inflation
over the next 12 months, but with job markets at a fragile equilibrium and wage growth and shelter inflation decelerating, the risk of a 1970s-style wage-price spiral is low. Tariffs continue to push core goods inflation 3ppt above pre-tariff trends, keeping inflation sticky even as energy risks fade.
Against this backdrop, the Fed is likely to remain on pause in H1 amid concerns about persistent inflation overshoots and wary of energy-price pressures. Nevertheless, under a new Chair (once Warsh is confirmed), it is likely to focus on reviving a soft job market and resume rate cuts. We expect a 25bps cut by December vs. less than half a cut priced by markets.
ECB to hike rate by 25bps to 2.25% by 2026-end: The Euro area economy entered the Middle East conflict with a recovery forming beneath the surface, with Germany’s fiscal stimulus showing up in factory orders via defence and infrastructure demand. If the Strait of Hormuz reopens by May, as the central case now suggests, Europe is well-placed for a modest rebound, with GDP growth estimated around 1% for
2026. The key structural tailwind remains Germany’s EUR 500bn infrastructure and climate spending programme, which carries large fiscal multipliers. That said, the energy shock has added meaningful tail risks: under pessimistic assumptions, the annual cost could be roughly 0.7-0.9% of GDP.
A short-lived conflict limits the inflationary damage. March inflation jumped to 2.6% y/y, driven entirely by energy inflation rising to 5.1% y/y from -3.1% in February, with no evidence of passthrough to core goods, food or services. Crucially, Euro area long-term inflation expectations remain anchored around 2%, supported by the ECB’s demonstrated determination to rectify any persistent overshoot. Under a muddle through scenario, headline inflation remains manageable.
The ECB has pivoted away from its initially hawkish tone, with some policymakers signalling they are in no rush to hike, preferring to assess the size and persistence of the inflation shock. The April meeting is unlikely to deliver a move, with any rate hike more likely in H2. The Euro area jobless rate is near record lows, but weaker demand and reduced household savings buffers cap the tightening the ECB can deliver. We expect one 25bps insurance hike to 2.25% by year-end 2026.
China to ease monetary/fiscal policies to support growth. China entered the Middle East conflict from a position of relative structural resilience. Q1 2026 GDP surprised to the upside, growing 5.0% y/y, accelerating from 4.5% in Q4 2025, driven by strong exports and a rebound in infrastructure investment. A short-lived conflict is broadly benign for China’s growth outlook. Unlike most large energy importers, China’s total energy exposure to the Middle East via oil and gas amounts to a manageable 6.5% of total energy consumption, cushioned further by sizable strategic crude reserves of approximately 1.2bn barrels (c. 108 days of import cover) and the ability to substitute through Russian crude. Critically, a short-lived conflict could even prove a net positive: China is the world’s leading green-technology powerhouse, and the energy shock has already triggered a surge in global orders for Chinese EVs, solar panels, wind turbines and energy storage systems. Green tech now accounts for 11% of China’s GDP. Given this, we expect 2026 GDP growth to hit the 4.5-5% target, further supported by infrastructure investment.
China’s deflationary pressures are easing, but the outlook remains structurally disinflationary. Productivity gains and supply-side improvements mean the disinflation impulse from industrial and housing overcapacity persists even as domestic spending rises gradually. Inflation is unlikely to hit the government’s 2% target amid weak domestic demand, a still-fragile property sector, and subdued consumer confidence.
With activity stabilising at subdued levels, the PBoC is likely to stay firmly accommodative, with a 10bps rate cut, another reserve ratio reduction, alongside managed RMB appreciation in 2026. On the fiscal side, the augmented deficit is likely to expand marginally this year, with additional focus on effective spending and boosting investment.
BoJ to hike rates by 50bps to 1.25% by December: Japan’s economy entered the Middle East conflict with significant domestic momentum. Wage growth has accelerated sharply, with contractual cash earnings rising at the strongest pace in decades, while Tankan business conditions remain robust. However, as one of the world’s largest net energy importers, Japan is acutely exposed to oil price shocks. If the Strait of Hormuz reopens by May, the energy drag could fade and Japan’s domestic re-acceleration story could reassert itself. We expect GDP growth to be supported by accelerating wage growth and a structurally undervalued JPY.
Japan’s inflation dynamics are at a critical juncture. Inflation expectations are at risk of un-anchoring upwards from 2%. The energy shock has added a stagflationary impulse, likely pushing headline inflation higher while simultaneously weighing on corporate profits and consumption. Thus, the Middle East conflict has complicated the BoJ’s normalisation path: having signalled a hawkish stance after its March meeting, the BoJ pivoted to a more cautious tone in April, with Governor Ueda emphasising two-way risks to both growth and inflation. We expect the BoJ to hold rates in H1 and deliver the next rate hike in Q3, with a subsequent hike to 1.25% expected in December. On the fiscal side, the Takaichi administration has signalled close co-operation with the BoJ, with fiscal support anticipated to be broadly commensurate with the negative income impact of the oil shock, helping cushion the economy through the near-term soft patch.
Fig. 15 Fed to cut rates in H2 to revive a soft job market
US quarterly job creation
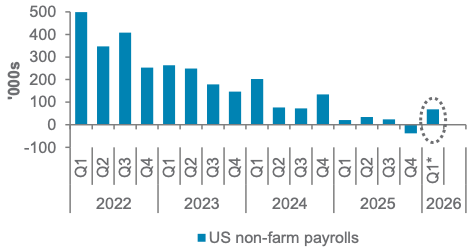
Source: Bloomberg, Standard Chartered
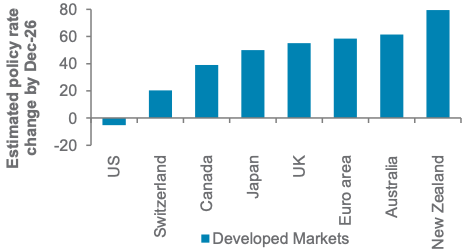
Fig. 16 Central bank rates outlooks to diverge in H2
Consensus estimates for policy rate changes by end-2026
Asset classes
Fixed Income – at a glance
|
|
||||
|
|
||||
Our view
Foundation: We view fixed income as a Core Holding. Within the asset class, we continue to Overweight EM USD and LCY bonds while maintaining an Underweight stance on DM government bonds. The potential US-Iran truce has already attracted inflows back to EM assets and should continue to support EM government bond performance, alongside improving fundamentals and more attractive valuations vs. DM peers. We have moved DM HY back to a Core Holding from Overweight, as strong performance in April has brought credit spreads close to recent tights. While we still find absolute yields attractive, we do not expect income from yields alone to drive further outperformance. Corporate fundamentals remain resilient, with leverage metrics largely stable and interest coverage ratios strong. This underpins our preference for credit over rates.
Opportunistic ideas: We are bullish (i) European bank AT1 bonds (CoCos1; FX-hedged), (ii) US TIPS, (iii) short-duration US HY bonds, (iv) AAA-rated collateralised loan obligations (CLOs), (v) US utilities’ corporate hybrids and (vi) AUD corporate bonds.
Key charts
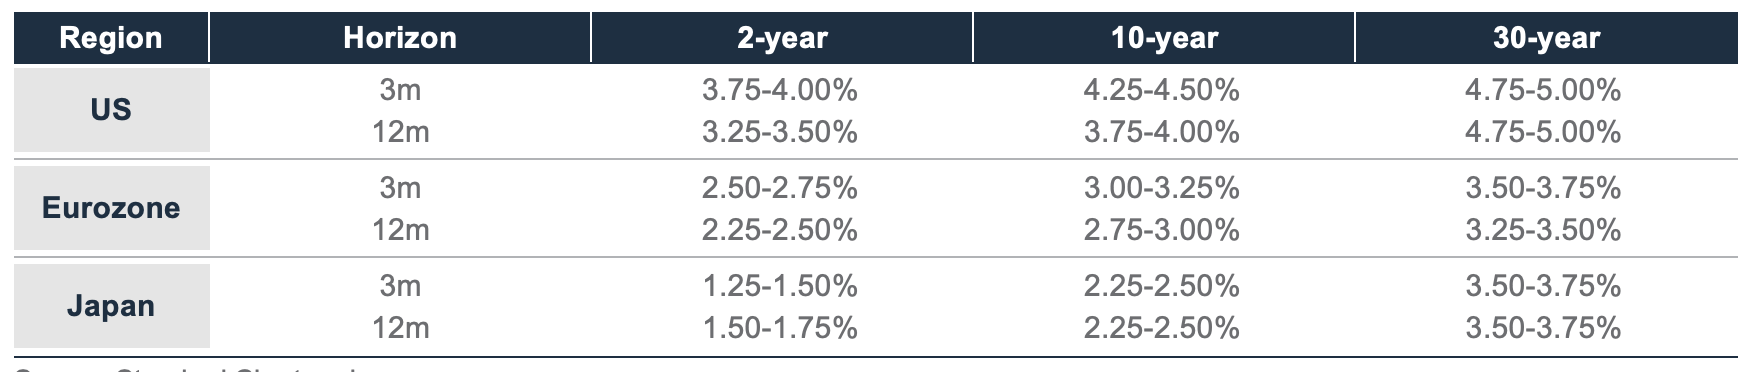
Fig. 17 Summary of rate forecasts
DM rates – Underweight
We are Underweight DM Investment Grade (IG) government bonds. In the US, we expect the term premium (compensation for holding long-duration bonds) to rise amid reflation expectations, a growing fiscal burden and concerns over the Fed’s independence. We now expect the Fed to cut rates once, to 3.5% by 2026-end, assuming the Strait of Hormuz reopens, and as the Fed shifts its focus towards
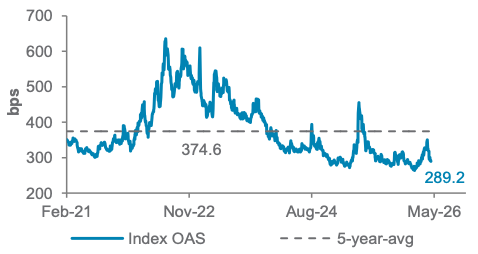
Fig. 18 DM IG corporate spreads retrace following
US-Iran peace talks
Bloomberg Global Agg Corp index, OAS-spread
emerging weakness in the labour market. We expect the US curve to bull-steepen as markets begin pricing in a resumption of Fed rate cuts. We continue to favour positioning in the belly of the curve (5-7 years) and remain Underweight long-dated tenors. We believe higher energy prices will have a greater impact on the Euro area and Japan. We expect both the ECB and BoJ to raise policy rates – once for the ECB and twice for the BoJ by 2026-end – leading their government bonds to underperform the US’ on an FX-hedged basis.
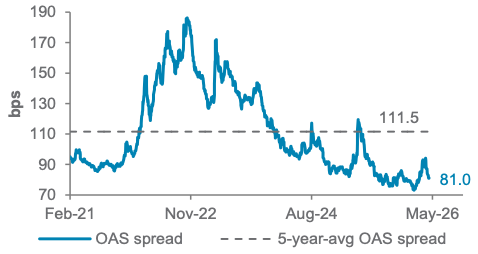
Fig. 19 DM HY corporate spreads tighten back towards the lows
Bloomberg Global HY Corp Index, OAS-spread
DM corporates – Core holding
We have moved DM HY corporate bonds back to Neutral. Since the peace talks resumed, DM HY spreads have retraced most of the earlier widening. We do not expect income from yield alone to support further outperformance. We continue to maintain a Neutral allocation to DM IG corporate bonds. While DM IG spreads have also retraced from the recent wides, the move has been less pronounced than in DM HY. In our view, AI capex-related supply pressures are likely to remain a longer-term overhang on sentiment for DM IG. Nevertheless, fundamentals for both IG and HY corporates remain resilient, supported by solid profitability and stable credit metrics.
EM bonds – Overweight
We prefer EM bonds over DM bonds due to their more
Fig. 20 EM USD yields look tight relative to DM but still offer 2%-plus pickup
Bloomberg EM USD Quasi/Sov 10% Capped Index, yield to worst, and yield over Bloomberg Global Treasury Index
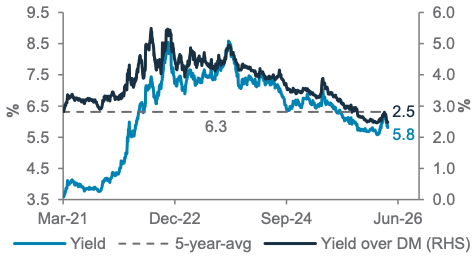
attractive yields. We are Overweight both EM USD sovereignbonds and EM LCY government bonds. While some EM assets remain susceptible to geopolitical uncertainty, most EM economies have bolstered their fiscal positions and current account balances in recent years. Their robust external balances, alongside our expectation of a weak USD, should support external debt servicing. In addition, leading EM USD bond issuers are net oil exporters, which we believe should remain resilient, particularly once the Middle East conflicts conclude and oil exports resume.
We retain our Neutral allocation to Asia USD bonds, which offer reasonably attractive nominal yields, favourable supply-demand dynamics and strong credit fundamentals, supported by higher cashflows, relatively low leverage and a higher proportion of sovereign or sovereign-linked issuers.
Fig. 21 EM LCY yields remain attractive
Bloomberg EM LCY Govt Index, yield to worst
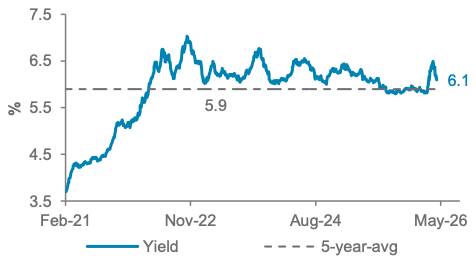
Source: Bloomberg, Standard Chartered
Equity – at a glance
|
|
||||
|
|
||||
Our view
We remain Overweight global equities. Although the Middle East conflict remains volatile, so far we remain comfortable with our expectation for mid-teens earnings growth in 2026 driving global equities higher. We remain Overweight US equities, where the heavyweight technology sector continues to benefit from AI investments. With the US Q1 26 earnings season underway, we look for corporate guidance to validate resilient fundamentals. We are also Overweight Asia ex-Japan (AxJ) equities, where technology is the largest sector and is also a beneficiary of AI capex.
Within AxJ, we have a diversified preference. Our Overweight stance on Taiwan reflects our positive view on semiconductor-driven earnings growth, while our Overweight on China reflects an attractive valuation re-rating potential amid resilient growth and policy support. Meanwhile, our Overweight on India reflects strong domestic growth and is less correlated to the AI theme.
We have a Core allocation to Japan, where expansionary fiscal plans are a positive offset to energy import sensitivities. We remain Underweight Europe ex-UK and UK equities, which have relatively muted earnings growth.
Key chart
US and AxJ equities are leading other regions in 2026
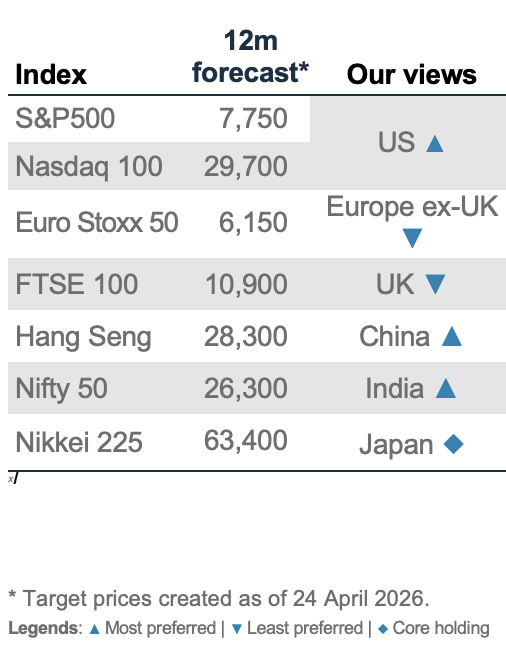
Fig. 22 Earnings growth is positive across all global sectors, led by technology; corporate earnings growth estimates for AxJ and the US are leading other regions
Earnings growth by sectors in the MSCI AC World Index in 2026 and 2027; consensus 12-month forward earnings growth estimates and price-earnings ratio for MSCI equity indices
Staying positive
The rally in global equities at the start of 2026 was interrupted by the Middle East conflict at the end of February. While the path to peace will be volatile, recent ceasefire talks point to some form of de-escalation. As we assess the impact on global growth prospects, we remain positive that earnings can continue to deliver solid growth, supporting equities higher.
Amid geopolitical risks, AI developments continue to make progress, sustaining solid earnings growth in the technology sector. This underpins our Overweight view on the US and AxJ equities, where tech is the largest sector. In addition, we expect an H2 26 Fed rate cut to offer liquidity support to US assets. The AxJ region is vulnerable to oil price spikes, so conflict de-escalation should be a tailwind for growth. Moreover, we expect a weak USD over the next 12 months to be a tailwind for AxJ.
Within AxJ, we are Overweight Taiwan, consistent with the AI investment theme driving strong growth in the semiconductor industry. However, we also seek out other drivers with our Overweight on China and India. China remains at an attractive valuation discount, supported by resilient growth. China is also pursuing tech innovation with its 15th Five-Year Plan. Meanwhile, India offers mid-teens earnings growth, which is less correlated to the AI theme and driven by domestic factors. As an oil importer, India is vulnerable to the Middle East conflict. However, India’s P/E valuation has also de-rated below its five-year average now, pricing in much of the risks , in our view.
Japan has outperformed global equities YTD, with optimism around the Takaichi government’s fiscal plans. We believe a normalisation of monetary policy is also positive for earnings growth. However, after the solid performance YTD, we expect it to perform in line with global equities in the next 6-12 months.
Equity opportunistic views
|
|
||||
|
|
||||
Add global gold miners idea
- We initiate an Opportunistic idea on global gold miners. We are constructive on gold prices and expect investors to look through near-term liquidity-driven weakness. Structural tailwinds remain, including solid central bank demand and expectations of a Fed rate cut in H2 26. These factors should enhance gold’s appeal and support earnings growth for gold miners.
- We take profit on European banks, locking in a 6.8% gain (11 December 2025-23 April 2026). The sector has rebounded strongly since early April on the back of solid Q4 25 earnings and a less dovish ECB to support net interest income. We are taking profit following the sharp rebound to reduce exposure to macro risks.
- We take profit on China non-financial high-dividend state-owned enterprises (SOEs) (H-shares), locking in a 56.3% gain (27 March 2024-23 April 2026). The theme has benefitted from government stimulus and investor demand for stable dividend income. We remain Overweight China equities within AxJ, and our pro‑risk positioning favours a rotation towards more growth‑oriented sectors.
Fig. 23 Opportunistic ideas
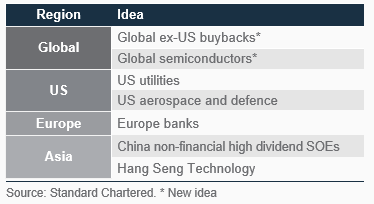
Ongoing ideas
Global ex-US buybacks: The idea performed well over the past month as firms with disciplined capital allocation and a strong commitment to shareholder returns outperformed under heightened market volatility. Exposure is concentrated in financials and energy, supported by strong balance sheets and robust cash‑generation. A sharp fall in oil prices is a risk.
Global semiconductors: We favour this industry within the tech sector, supported by accelerating AI-related capex and sustained memory chip demand. With recent valuation de-rating, the sector offers an attractive entry point. Geopolitical tensions resulting in supply chain disruption is a risk.
US utilities: The sector benefits from accelerating capex and rising power demand driven by AI‑related data centre growth.
It also provides a defensive exposure for portfolio diversification, while lower power prices pose a risk.
US aerospace and defence: Projected upward revisions in the US defence spending budget are likely to support earnings growth, on top of structural demand for air travel. Weaker-than-expected defence spending is a risk.
Hang Seng Technology: Tech innovation remains a priority under China’s 15th Five-Year Plan. The strong AI-related IPO pipeline supports investor sentiment, while valuations are reasonable. Adverse regulatory changes are risks.
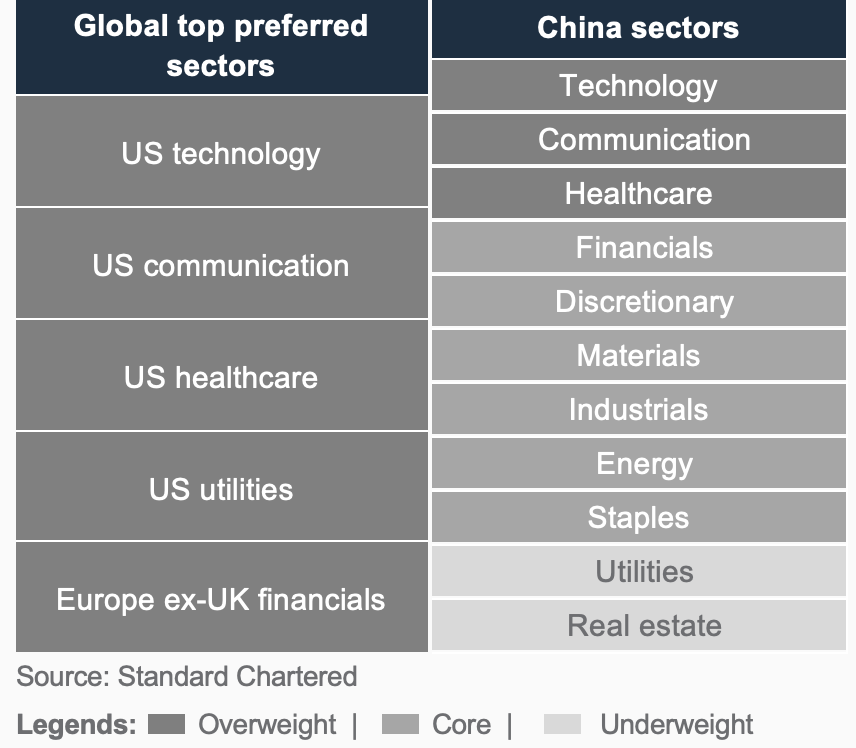
Sector views: Maintain a barbell approach
We upgrade US communication services to Overweight, amid an improving digital advertising environment and growing opportunities to monetise AI investments. Together with an Overweight stance on US technology, this provides growth exposure within a barbell strategy, balanced by defensive exposure to US healthcare and US utilities. The latter two sectors offer stable earnings, driven by resilient demand across economic cycles, enhancing portfolio resilience. We remain Overweight Europe ex-UK financials despite closing the short-term European banks opportunistic idea, given attractive shareholder returns.
Our China sector allocation remains unchanged. We expect technology and communication services to continue benefiting from tech innovation and supportive government policies. Meanwhile we see the healthcare sector strengthening, reflected in the improving quality and long-term potential of Chinese drug discovery and innovation.
Fig. 24 Our sector views
Gold, crude oil – at a glance
|
Our view
We remain Overweight gold but trim our 3- and 12-month gold price targets to USD 5,200/oz and USD 5,500/oz, respectively
We raise our three-month West Texas Intermediate (WTI) oil price forecast to USD 80-90/bbl on expectations that full output normalisation will take time.
Key chart
Fig. 25 Structural buying from central banks continues to support prices higher, despite a minority net selling
Largest changes in gold reserves in February 2026
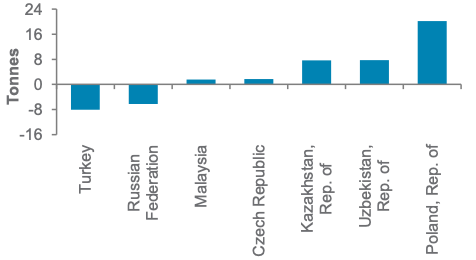
Fig. 27 Strait of Hormuz flows highlight Asia’s reliance on Gulf crude
Crude and condensates flows by destination (*H1 2025)
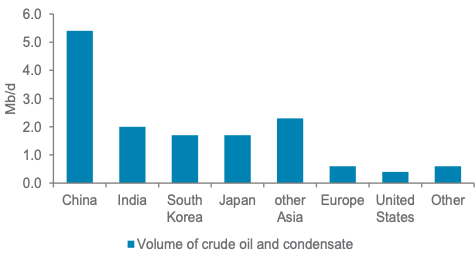
Fig. 26 Gold-silver ratio has recovered towards historical average
Gold-silver ratio
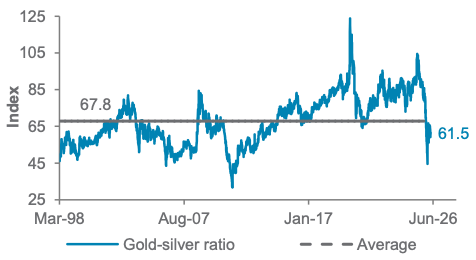
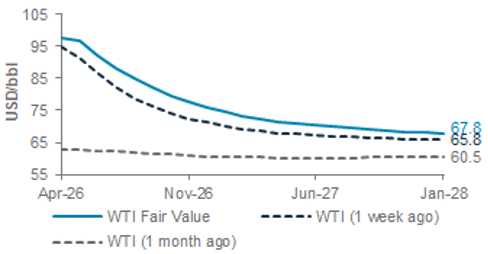
Fig. 28 WTI futures indicate near-term tight supplies, but prices are expected to fall by H2 as conflict eases
Oil supply-demand balance, price estimates
Gold outlook: Gold’s recent strength reflects a still-intact structural bull case underpinned by safe-haven demand, geopolitical risk and diversification away from US assets. We expect episodes of central bank selling to remain sporadic, with still-net positive overall official demand providing a firm anchor.
Oil outlook: Our base case assumes a two-phase normalisation. While transit flows should recover quickly in a scenario where shipping routes reopen, physical supply is
expected to lag as upstream and export infrastructure damage delays a return to pre-conflict output. Lower global inventories also reduce the market’s buffer. While we still expect a return towards surplus into late 2026, a two-phase recovery and the need for inventory rebuilding mean prices are likely to stay in the USD 80-90/bbl range for now, with a return to USD 70/bbl likely only over a longer 12-month horizon.
FX – at a glance
|
|
||||
USD view
We have revised down our three-month forecast for the US Dollar Index (DXY) to 96 from 100, with our 12-month forecast unchanged at 96. The Middle East conflict, which led to the recent oil price spikes, has highlighted the US’ status as a leading energy producer and exporter, leading investors to price in the improvement in their terms of trade from the rise in WTI oil price. Assuming the current conflict broadly de-escalates in the coming 3 months and energy prices moderate, the outlook points to further underperformance of the USD, and our 12-month target illustrates that most of the adjustment is expected to be front-loaded. However, the risk of a sudden resurgence in hostilities remains a persistent threat, sustaining investor caution and causing currency pairs to largely trade sideways in the near term. Consequently, despite expectations of delayed Fed rate cuts, once tensions in the Middle East subside, this should contribute to a depreciation of the USD.In our view, significant policy actions by major central banks have already been largely factored into market expectations for year-end 2026, with the DXY likely to stabilise around 96 unless fresh catalysts arise. However, this outlook faces several risks, including a renewed surge in inflation, a shift towards a more hawkish approach by the Fed or further geopolitical shocks. Any of these developments could reignite demand for the USD.
However, we continue to anticipate a resumption of USD weakness over a 12-month horizon, with the DXY expected to return towards 96. We believe the USD will depreciate once tensions surrounding the Middle East conflict ease, as it is unlikely to be prolonged. The fundamental factors that have underpinned USD strength in recent years, such as robust US economic performance and higher real interest rates, have been gradually fading. Risks to our outlook include the possibility of a renewed spike in inflation, a more hawkish Fed or additional geopolitical shocks that could once again drive demand for the USD.
Key charts
Fig. 29 Narrowing interest rate differentials likely to drive USD downside risk on a 12-month horizon
DXY, weighted interest rate differentials & five-year average
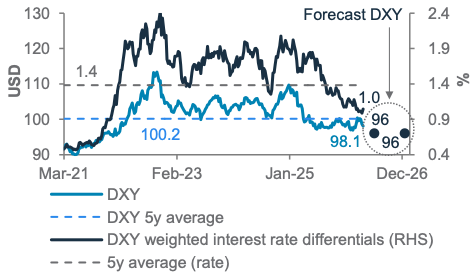
Fig. 31 NZD upside expected on rate differentials advantage amid hawkish RBNZ
NZD/USD, NZ-US interest rate differentials
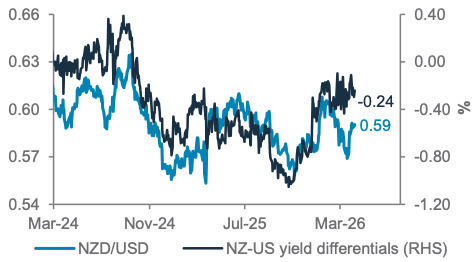
Fig. 30 RBNZ to significantly outpace most central banks in magnitude of rate hikes, supporting NZD
Market expectations of major central bank rate changes as of 23 April 2026
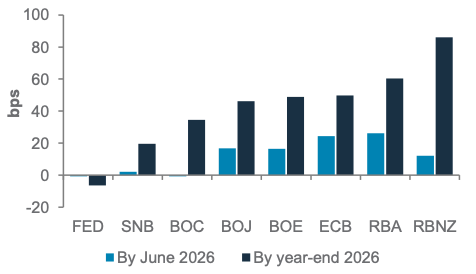
Fig. 32 USD/CHF downside risk remains. Diversify away from excessive exposure to CHF as carry currency
USD/JPY and forecast levels
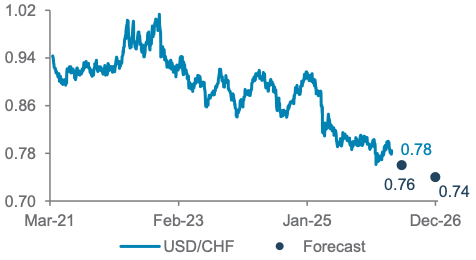
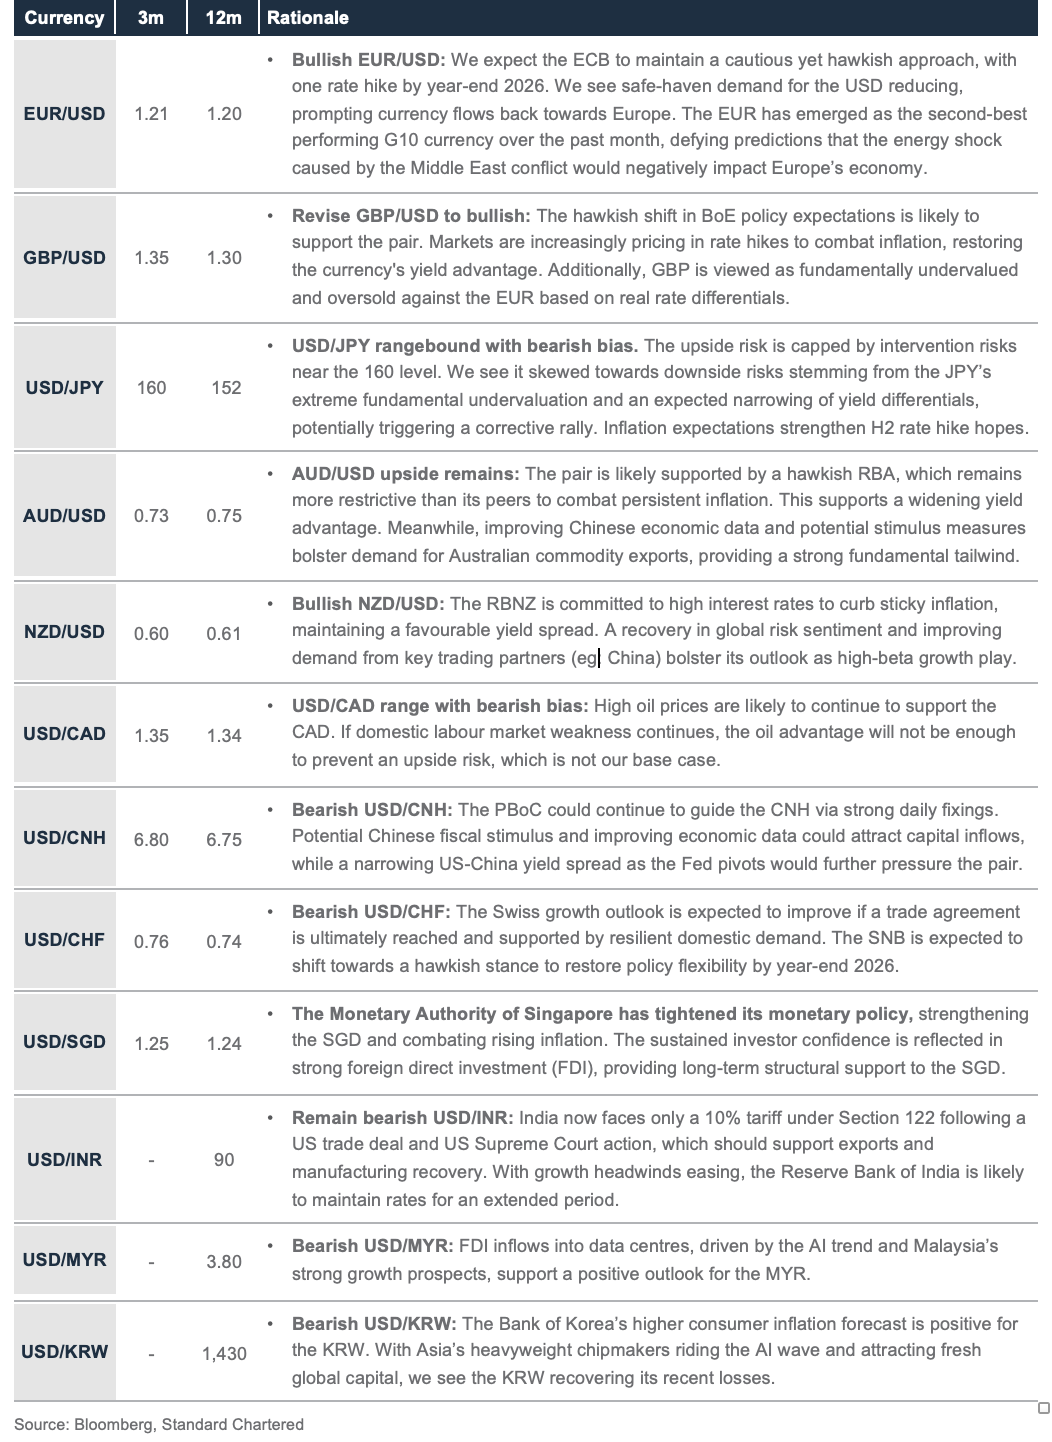
Fig. 33 Summary of currency forecasts and drivers
Additional perspectives
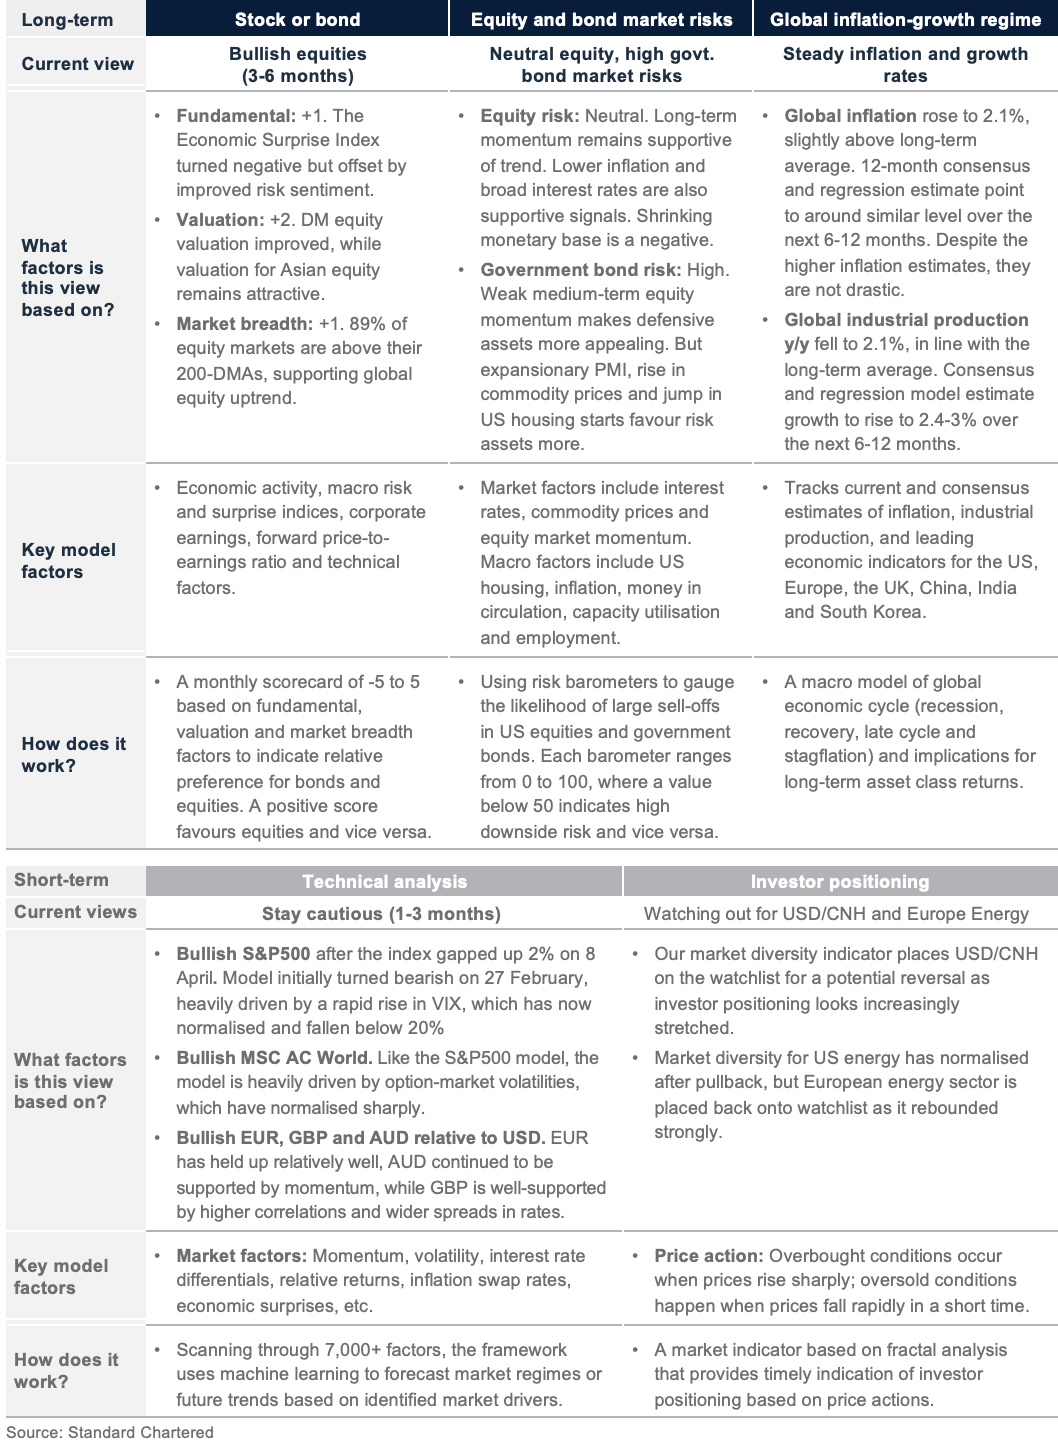
Quant perspective: Bullish equities
Bullish equities over both short and long term
|
|
||||
Summary
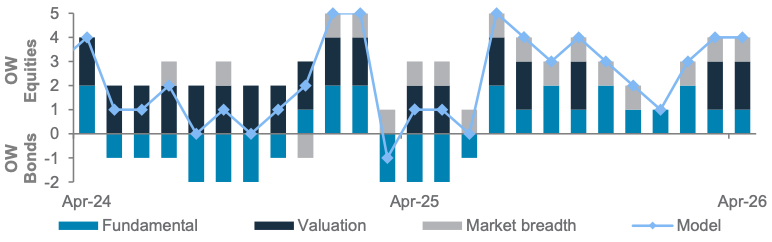
Our 3-6-month stock-bond model maintains a score of +4 out of 5, reflecting a sizeable Overweight in global equities. The allocation to global equities was increased in March following market weakness triggered by the Middle East conflict. The rationale of maintaining this positioning remains unchanged: (i) more attractive valuation for DM equities, (ii) still-supportive fundamentals and (iii) a healthy market breadth, with more than 89% of equity markets trading above their 200-day moving averages (DMAs). While some economic data has recently come in weaker than expected, investor sentiment has improved after global equities rebounded strongly. As a result, the model has delivered a 5.9% gain YTD and is now ahead of the traditional 60/40 equity-bond benchmark by 1.67%, largely due to the timely increase in equity allocation.
Our 1-3-month short-term equity models for S&P500 and MSCI AC World also turned bullish in early April. Both models are heavily driven by option-market implied volatility indicators, including the Volatility Index (VIX), which has normalised sharply – falling from a late-March peak of 31% to below 20%. While there are early signs of renewed upward pressure on VIX as the US-Iran peace talks have stalled, markets appear more resilient and less reactive than during the initial phase of the conflict in February. That said, the model signal for MSCI AC World is relatively more cautious due to a widening trading range and heightened global sensitivity to inflation-related shocks.
Our market diversity indicator places USD/CNH and Europe energy sector on the watchlist for potential reversals. Investor positionings in both are becoming increasingly stretched, but they have yet to reach levels that trigger a reversal signal. Market diversity indicators for the US has normalised after its recent pullbacks.
Key chart
Our stock-bond model increased its Overweight allocation to equity in March, on the back of improved equity valuation, still-supportive fundamentals and healthy market breadth.
Fig. 34 Breakdown of our stock-bond rotation model’s scores
Model score for April 2026 remains at +4 (every mid-month)
Our short-term models turned bullish on equities as option-market implied volatilities tapered off sharply.
|
|
Fig. 35 Our technical model turned bullish on S&P500
S&P500 Index; model’s bearish signal; technical support and resistance levels
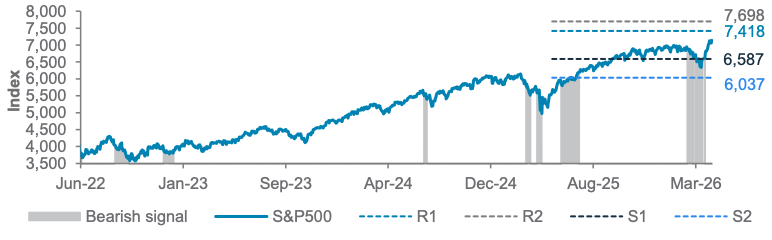
Fig. 36 Long- and short-term quantitative models remain bullish risk assets
Long-term models below have a typical time horizon of 3-6 months, while short-term models have a 1-3-month horizon
Performance review
Foundation: Asset allocation summary
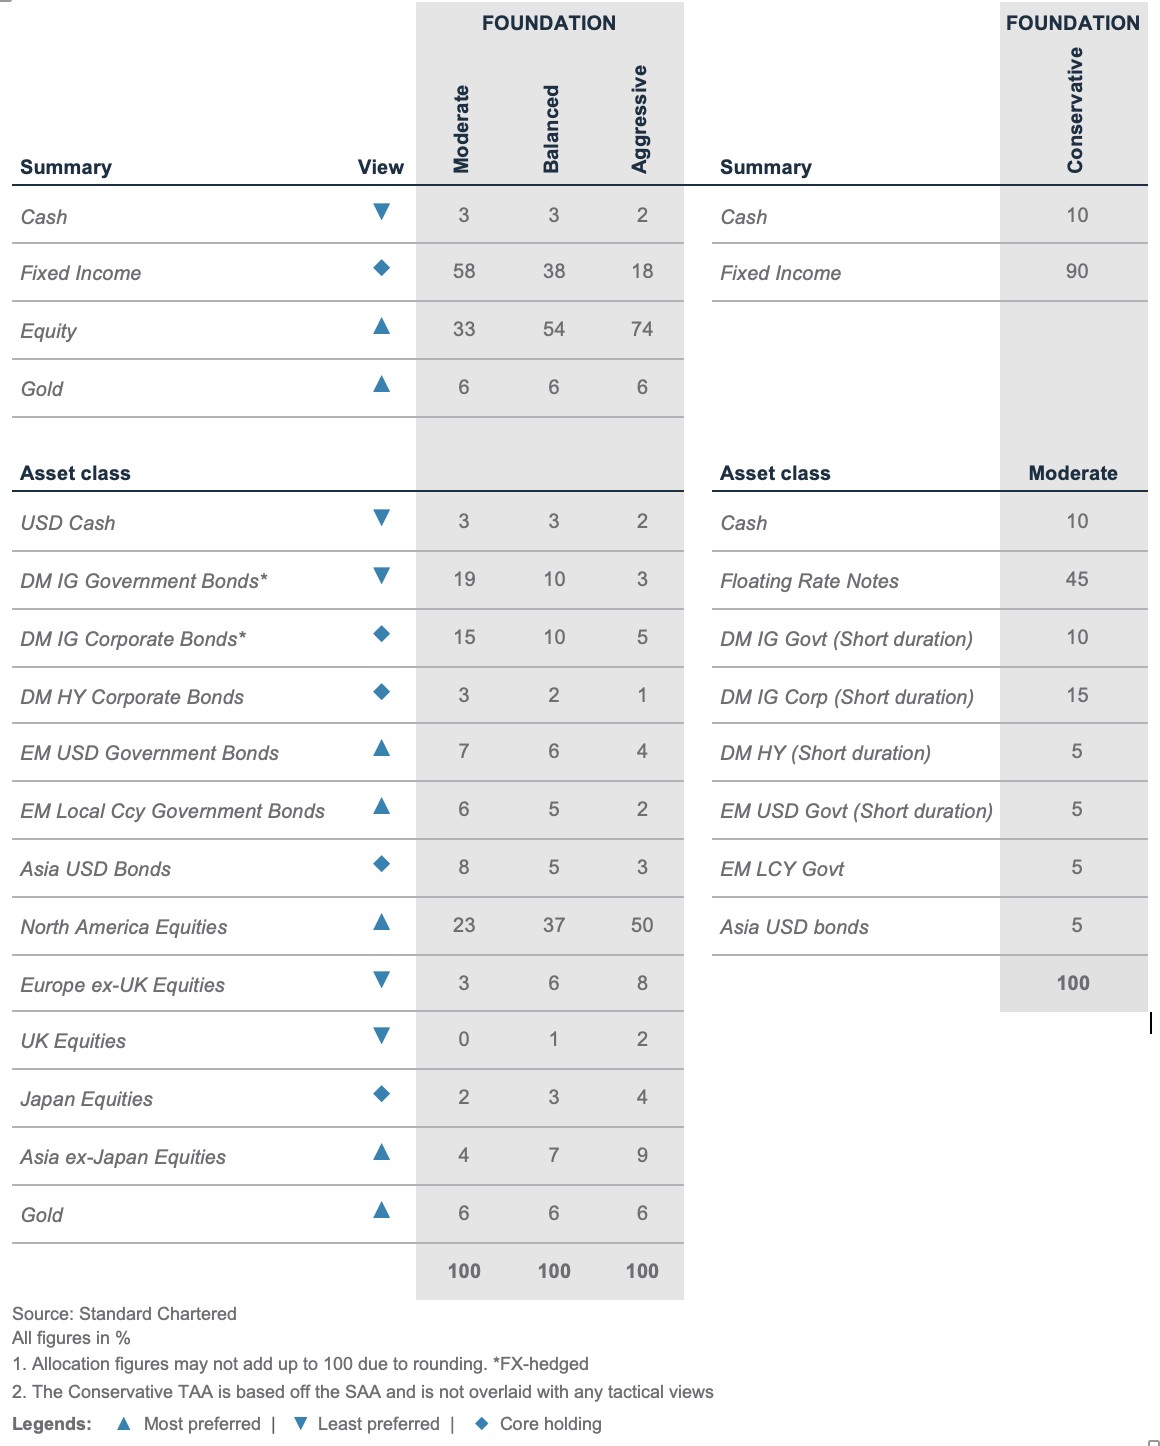
Foundation+: Asset allocation summary
Market performance summary
*All performance shown in USD terms, unless otherwise stated
*YTD performance data from 31 December 2025 to 23 April 2026; 1-week performance from 16 April 2026 to 23 April 2026
Our key forecasts and calendar events
SC Wealth Select

Explanatory notes
- The figures on page 5 show allocations for a moderately aggressive risk profile only – different risk profiles may produce significantly different asset allocation results. Page 5 is only an example, provided for general information only and they do not constitute investment advice, an offer, recommendation or solicitation. They do not take into account the specific investment objectives, needs or risk tolerances of a particular person or class of persons and they have not been prepared for any particular person or class of persons.
- Contingent Convertibles are complex financial instruments and are not a suitable or appropriate investment for all investors. This document is not an offer to sell or an invitation to buy any securities or any beneficial interests therein. Contingent convertible securities are not intended to be sold and should not be sold to retail clients in the European Economic Area (EEA) (each as defined in the Policy Statement on the Restrictions on the Retail Distribution of Regulatory Capital Instruments (Feedback to CP14/23 and Final Rules) (“Policy Statement”), read together with the Product Intervention (Contingent Convertible Instruments and Mutual Society Shares) Instrument 2015 (“Instrument”, and together with the Policy Statement, the “Permanent Marketing Restrictions”), which were published by the United Kingdom’s Financial Conduct Authority in June 2015), other than in circumstances that do not give rise to a contravention of the Permanent Marketing Restrictions.
Disclosure
This document is confidential and may also be privileged. If you are not the intended recipient, please destroy all copies and notify the sender immediately. This document is being distributed for general information only and is subject to the relevant disclaimers available at our Standard Chartered website under Regulatory disclosures. It is not and does not constitute research material, independent research, an offer, recommendation or solicitation to enter into any transaction or adopt any hedging, trading or investment strategy, in relation to any securities or other financial instruments. This document is for general evaluation only. It does not take into account the specific investment objectives, financial situation or particular needs of any particular person or class of persons and it has not been prepared for any particular person or class of persons. You should not rely on any contents of this document in making any investment decisions. Before making any investment, you should carefully read the relevant offering documents and seek independent legal, tax and regulatory advice. In particular, we recommend you to seek advice regarding the suitability of the investment product, taking into account your specific investment objectives, financial situation or particular needs, before you make a commitment to purchase the investment product. Opinions, projections and estimates are solely those of SC at the date of this document and subject to change without notice. Past performance is not indicative of future results and no representation or warranty is made regarding future performance. The value of investments, and the income from them, can go down as well as up, and you may not recover the amount of your original investment. You are not certain to make a profit and may lose money. Any forecast contained herein as to likely future movements in rates or prices or likely future events or occurrences constitutes an opinion only and is not indicative of actual future movements in rates or prices or actual future events or occurrences (as the case may be). This document must not be forwarded or otherwise made available to any other person without the express written consent of the Standard Chartered Group (as defined below). Standard Chartered Bank is incorporated in England with limited liability by Royal Charter 1853 Reference Number ZC18. The Principal Office of the Company is situated in England at 1 Basinghall Avenue, London, EC2V 5DD. Standard Chartered Bank is authorised by the Prudential Regulation Authority and regulated by the Financial Conduct Authority and Prudential Regulation Authority. Standard Chartered PLC, the ultimate parent company of Standard Chartered Bank, together with its subsidiaries and affiliates (including each branch or representative office), form the Standard Chartered Group. Standard Chartered Global Private Bank is the private banking division of Standard Chartered. Private banking activities may be carried out internationally by different legal entities and affiliates within the Standard Chartered Group (each an “SC Group Entity”) according to local regulatory requirements. Not all products and services are provided by all branches, subsidiaries and affiliates within the Standard Chartered Group. Some of the SC Group Entities only act as representatives of Standard Chartered Global Private Bank and may not be able to offer products and services or offer advice to clients.
Copyright © 2026, Accounting Research & Analytics, LLC d/b/a CFRA (and its affiliates, as applicable). Reproduction of content provided by CFRA in any form is prohibited except with the prior written permission of CFRA. CFRA content is not investment advice and a reference to or observation concerning a security or investment provided in the CFRA SERVICES is not a recommendation to buy, sell or hold such investment or security or make any other investment decisions. The CFRA content contains opinions of CFRA based upon publicly-available information that CFRA believes to be reliable and the opinions are subject to change without notice. This analysis has not been submitted to, nor received approval from, the United States Securities and Exchange Commission or any other regulatory body. While CFRA exercised due care in compiling this analysis, CFRA, ITS THIRD-PARTY SUPPLIERS, AND ALL RELATED ENTITIES SPECIFICALLY DISCLAIM ALL WARRANTIES, EXPRESS OR IMPLIED, INCLUDING, BUT NOT LIMITED TO, ANY WARRANTIES OF MERCHANTABILITY OR FITNESS FOR A PARTICULAR PURPOSE OR USE, to the full extent permitted by law, regarding the accuracy, completeness, or usefulness of this information and assumes no liability with respect to the consequences of relying on this information for investment or other purposes. No content provided by CFRA (including ratings, credit-related analyses and data, valuations, model, software or other application or output therefrom) or any part thereof may be modified, reverse engineered, reproduced or distributed in any form by any means, or stored in a database or retrieval system, without the prior written permission of CFRA, and such content shall not be used for any unlawful or unauthorized purposes. CFRA and any third-party providers, as well as their directors, officers, shareholders, employees or agents do not guarantee the accuracy, completeness, timeliness or availability of such content. In no event shall CFRA, its affiliates, or their third-party suppliers be liable for any direct, indirect, special, or consequential damages, costs, expenses, legal fees, or losses (including lost income or lost profit and opportunity costs) in connection with a subscriber’s, subscriber’s customer’s, or other’s use of CFRA’s content.
Market Abuse Regulation (MAR) Disclaimer
Banking activities may be carried out internationally by different branches, subsidiaries and affiliates within the Standard Chartered Group according to local regulatory requirements. Opinions may contain outright “buy”, “sell”, “hold” or other opinions. The time horizon of this opinion is dependent on prevailing market conditions and there is no planned frequency for updates to the opinion. This opinion is not independent of Standard Chartered Group’s trading strategies or positions. Standard Chartered Group and/or its affiliates or its respective officers, directors, employee benefit programmes or employees, including persons involved in the preparation or issuance of this document may at any time, to the extent permitted by applicable law and/or regulation, be long or short any securities or financial instruments referred to in this document or have material interest in any such securities or related investments. Therefore, it is possible, and you should assume, that Standard Chartered Group has a material interest in one or more of the financial instruments mentioned herein. Please refer to our Standard Chartered website under Regulatory disclosures for more detailed disclosures, including past opinions/ recommendations in the last 12 months and conflict of interests, as well as disclaimers. A covering strategist may have a financial interest in the debt or equity securities of this company/issuer. All covering strategist are licensed to provide investment recommendations under Monetary Authority of Singapore or Hong Kong Monetary Authority. This document must not be forwarded or otherwise made available to any other person without the express written consent of Standard Chartered Group.
Sustainable Investments
Any ESG data used or referred to has been provided by Morningstar, Sustainalytics, MSCI or Bloomberg. Refer to 1) Morningstar website under Sustainable Investing, 2) Sustainalytics website under ESG Risk Ratings, 3) MCSI website under ESG Business Involvement Screening Research and 4) Bloomberg green, social & sustainability bonds guide for more information. The ESG data is as at the date of publication based on data provided, is for informational purpose only and is not warranted to be complete, timely, accurate or suitable for a particular purpose, and it may be subject to change. The ESG data providers may not provide data coverage of all companies or securities in our Sustainable Investment Universe or Fund Select funds. As a result, a small subset of companies or securities will not be in scope for exclusionary screening. Sustainable Investments (SI): This refers to funds that have been classified as ‘ESG Intentional Investments – Overall’ by Morningstar. SI funds have explicitly stated in their prospectus and regulatory filings that they either incorporate ESG factors into the investment process or have a thematic focus on the environment, gender diversity, low carbon, renewable energy, water or community development. For equity, it refers to shares/stocks issued by companies with Sustainalytics ESG Risk Rating of Low/Negligible. For bonds, it refers to debt instruments issued by issuers with Sustainalytics ESG Risk Rating of Low/Negligible, and/or those being certified green, social, sustainable bonds by Bloomberg. For structured products, it refers to products that are issued by any issuer who has a Sustainable Finance framework that aligns with Standard Chartered’s Green and Sustainable Product Framework, with underlying assets that are part of the Sustainable Investment universe or separately approved by Standard Chartered’s Sustainable Finance Governance Committee. Sustainalytics ESG risk ratings shown are factual and are not an indicator that the product is classified or marketed as “green”, “sustainable” or similar under any particular classification system or framework.
Country/Market Specific Disclosures
Bahrain: This document is being distributed in Bahrain by Standard Chartered Bank, Bahrain Branch, having its address at P.O. 29, Manama, Kingdom of Bahrain, is a branch of Standard Chartered Bank and is licensed by the Central Bank of Bahrain as a conventional retail bank. Botswana: This document is being distributed in Botswana by, and is attributable to, Standard Chartered Bank Botswana Limited which is a financial institution licensed under the Section 6 of the Banking Act CAP 46.04 and is listed in the Botswana Stock Exchange. Brunei Darussalam: This document is being distributed in Brunei Darussalam by, and is attributable to, Standard Chartered Bank (Brunei Branch) | Registration Number RFC/61 and Standard Chartered Securities (B) Sdn Bhd | Registration Number RC20001003. Standard Chartered Bank is incorporated in England with limited liability by Royal Charter 1853 Reference Number ZC18. Standard Chartered Securities (B) Sdn Bhd is a limited liability company registered with the Registry of Companies with Registration Number RC20001003 and licensed by Brunei Darussalam Central Bank as a Capital Markets Service License Holder with License Number BDCB/R/CMU/S3-CL and it is authorised to conduct Islamic investment business through an Islamic window. China Mainland: This document is being distributed in China by, and is attributable to, Standard Chartered Bank (China) Limited which is mainly regulated by National Financial Regulatory Administration (NFRA), State Administration of Foreign Exchange (SAFE), and People’s Bank of China (PBOC). Hong Kong: In Hong Kong, this document, except for any portion advising on or facilitating any decision on futures contracts trading, is distributed by Standard Chartered Bank (Hong Kong) Limited (“SCBHK”), a subsidiary of Standard Chartered PLC. SCBHK has its registered address at 32/F, Standard Chartered Bank Building, 4-4A Des Voeux Road Central, Hong Kong and is regulated by the Hong Kong Monetary Authority and registered with the Securities and Futures Commission (“SFC”) to carry on Type 1 (dealing in securities), Type 4 (advising on securities), Type 6 (advising on corporate finance) and Type 9 (asset management) regulated activity under the Securities and Futures Ordinance (Cap. 571) (“SFO”) (CE No. AJI614). The contents of this document have not been reviewed by any regulatory authority in Hong Kong and you are advised to exercise caution in relation to any offer set out herein. If you are in doubt about any of the contents of this document, you should obtain independent professional advice. Any product named herein may not be offered or sold in Hong Kong by means of any document at any time other than to “professional investors” as defined in the SFO and any rules made under that ordinance. In addition, this document may not be issued or possessed for the purposes of issue, whether in Hong Kong or elsewhere, and any interests may not be disposed of, to any person unless such person is outside Hong Kong or is a “professional investor” as defined in the SFO and any rules made under that ordinance, or as otherwise may be permitted by that ordinance. In Hong Kong, Standard Chartered Global Private Bank is the private banking division of SCBHK, a subsidiary of Standard Chartered PLC. Ghana: Standard Chartered Bank Ghana Limited accepts no liability and will not be liable for any loss or damage arising directly or indirectly (including special, incidental or consequential loss or damage) from your use of these documents. Past performance is not indicative of future results and no representation or warranty is made regarding future performance. You should seek advice from a financial adviser on the suitability of an investment for you, taking into account these factors before making a commitment to invest in an investment. To unsubscribe from receiving further updates, please send an email to feedback.ghana@sc.com. Please do not reply to this email. Call our Priority Banking on 0302610750 for any questions or service queries. You are advised not to send any confidential and/or important information to Standard Chartered via e-mail, as Standard Chartered makes no representations or warranties as to the security or accuracy of any information transmitted via e-mail. Standard Chartered shall not be responsible for any loss or damage suffered by you arising from your decision to use e-mail to communicate with the Bank. India: This document is being distributed in India by Standard Chartered in its capacity as a distributor of mutual funds and referrer of any other third party financial products. Standard Chartered does not offer any ‘Investment Advice’ as defined in the Securities and Exchange Board of India (Investment Advisers) Regulations, 2013 or otherwise. Services/products related securities business offered by Standard Charted are not intended for any person, who is a resident of any jurisdiction, the laws of which imposes prohibition on soliciting the securities business in that jurisdiction without going through the registration requirements and/or prohibit the use of any information contained in this document. Indonesia: This document is being distributed in Indonesia by Standard Chartered Bank, Indonesia branch, which is a financial institution licensed and supervised by Otoritas Jasa Keuangan (Financial Service Authority) and Bank Indonesia. Jersey: In Jersey, Standard Chartered Global Private Bank is the Registered Business Name of the Jersey Branch of Standard Chartered Bank. The Jersey Branch of Standard Chartered Bank is regulated by the Jersey Financial Services Commission. Copies of the latest audited accounts of Standard Chartered Bank are available from its principal place of business in Jersey: PO Box 80, 15 Castle Street, St Helier, Jersey JE4 8PT. Standard Chartered Bank is incorporated in England with limited liability by Royal Charter in 1853 Reference Number ZC 18. The Principal Office of the Company is situated in England at 1 Basinghall Avenue, London, EC2V 5DD. Standard Chartered Bank is authorised by the Prudential Regulation Authority and regulated by the Financial Conduct Authority and Prudential Regulation Authority. The Jersey Branch of Standard Chartered Bank is also an authorised financial services provider under license number 44946 issued by the Financial Sector Conduct Authority of the Republic of South Africa. Jersey is not part of the United Kingdom and all business transacted with Standard Chartered Bank, Jersey Branch and other SC Group Entity outside of the United Kingdom, are not subject to some or any of the investor protection and compensation schemes available under United Kingdom law. Kenya: This document is being distributed in Kenya by and is attributable to Standard Chartered Bank Kenya Limited. Investment Products and Services are distributed by Standard Chartered Investment Services Limited, a wholly owned subsidiary of Standard Chartered Bank Kenya Limited that is licensed by the Capital Markets Authority in Kenya, as a Fund Manager. Standard Chartered Bank Kenya Limited is regulated by the Central Bank of Kenya. Malaysia: This document is being distributed in Malaysia by Standard Chartered Bank Malaysia Berhad (“SCBMB”). Recipients in Malaysia should contact SCBMB in relation to any matters arising from, or in connection with, this document. This document has not been reviewed by the Securities Commission Malaysia. The product lodgement, registration, submission or approval by the Securities Commission of Malaysia does not amount to nor indicate recommendation or endorsement of the product, service or promotional activity. Investment products are not deposits and are not obligations of, not guaranteed by, and not protected by SCBMB or any of the affiliates or subsidiaries, or by Perbadanan Insurans Deposit Malaysia, any government or insurance agency. Investment products are subject to investment risks, including the possible loss of the principal amount invested. SCBMB expressly disclaim any liability and responsibility for any loss arising directly or indirectly (including special, incidental or consequential loss or damage) arising from the financial losses of the Investment Products due to market condition. Nigeria: This document is being distributed in Nigeria by Standard Chartered Bank Nigeria Limited (SCB Nigeria), a bank duly licensed and regulated by the Central Bank of Nigeria. SCB Nigeria accepts no liability for any loss or damage arising directly or indirectly (including special, incidental or consequential loss or damage) from your use of these documents. You should seek advice from a financial adviser on the suitability of an investment for you, taking into account these factors before making a commitment to invest in an investment. To unsubscribe from receiving further updates, please send an email to clientcare.ng@sc.com requesting to be removed from our mailing list. Please do not reply to this email. Call our Priority Banking on 02 012772514 for any questions or service queries. SCB Nigeria shall not be responsible for any loss or damage arising from your decision to send confidential and/or important information to Standard Chartered via e-mail. SCB Nigeria makes no representations or warranties as to the security or accuracy of any information transmitted via e-mail. Pakistan: This document is being distributed in Pakistan by, and attributable to Standard Chartered Bank (Pakistan) Limited having its registered office at PO Box 5556, I.I Chundrigar Road Karachi, which is a banking company registered with State Bank of Pakistan under Banking Companies Ordinance 1962 and is also having licensed issued by Securities & Exchange Commission of Pakistan for Security Advisors. Standard Chartered Bank (Pakistan) Limited acts as a distributor of mutual funds and referrer of other third-party financial products. Singapore: This document is being distributed in Singapore by, and is attributable to, Standard Chartered Bank (Singapore) Limited (Registration No. 201224747C/ GST Group Registration No. MR-8500053-0, “SCBSL”). Recipients in Singapore should contact SCBSL in relation to any matters arising from, or in connection with, this document. SCBSL is an indirect wholly owned subsidiary of Standard Chartered Bank and is licensed to conduct banking business in Singapore under the Singapore Banking Act, 1970. Standard Chartered Global Private Bank is the private banking division of SCBSL. IN RELATION TO ANY SECURITY OR SECURITIES-BASED DERIVATIVES CONTRACT REFERRED TO IN THIS DOCUMENT, THIS DOCUMENT, TOGETHER WITH THE ISSUER DOCUMENTATION, SHALL BE DEEMED AN INFORMATION MEMORANDUM (AS DEFINED IN SECTION 275 OF THE SECURITIES AND FUTURES ACT, 2001 (“SFA”)). THIS DOCUMENT IS INTENDED FOR DISTRIBUTION TO ACCREDITED INVESTORS, AS DEFINED IN SECTION 4A(1)(a) OF THE SFA, OR ON THE BASIS THAT THE SECURITY OR SECURITIES-BASED DERIVATIVES CONTRACT MAY ONLY BE ACQUIRED AT A CONSIDERATION OF NOT LESS THAN S$200,000 (OR ITS EQUIVALENT IN A FOREIGN CURRENCY) FOR EACH TRANSACTION. Further, in relation to any security or securities-based derivatives contract, neither this document nor the Issuer Documentation has been registered as a prospectus with the Monetary Authority of Singapore under the SFA. Accordingly, this document and any other document or material in connection with the offer or sale, or invitation for subscription or purchase, of the product may not be circulated or distributed, nor may the product be offered or sold, or be made the subject of an invitation for subscription or purchase, whether directly or indirectly, to persons other than a relevant person pursuant to section 275(1) of the SFA, or any person pursuant to section 275(1A) of the SFA, and in accordance with the conditions specified in section 275 of the SFA, or pursuant to, and in accordance with the conditions of, any other applicable provision of the SFA. In relation to any collective investment schemes referred to in this document, this document is for general information purposes only and is not an offering document or prospectus (as defined in the SFA). This document is not, nor is it intended to be (i) an offer or solicitation of an offer to buy or sell any capital markets product; or (ii) an advertisement of an offer or intended offer of any capital markets product. Deposit Insurance Scheme: Singapore dollar deposits of non-bank depositors are insured by the Singapore Deposit Insurance Corporation, for up to S$100,000 in aggregate per depositor per Scheme member by law. Foreign currency deposits, dual currency investments, structured deposits and other investment products are not insured. This advertisement has not been reviewed by the Monetary Authority of Singapore. Taiwan: SC Group Entity or Standard Chartered Bank (Taiwan) Limited (“SCB (Taiwan)”) may be involved in the financial instruments contained herein or other related financial instruments. The author of this document may have discussed the information contained herein with other employees or agents of SC or SCB (Taiwan). The author and the above-mentioned employees of SC or SCB (Taiwan) may have taken related actions in respect of the information involved (including communication with customers of SC or SCB (Taiwan) as to the information contained herein). The opinions contained in this document may change, or differ from the opinions of employees of SC or SCB (Taiwan). SC and SCB (Taiwan) will not provide any notice of any changes to or differences between the above-mentioned opinions. This document may cover companies with which SC or SCB (Taiwan) seeks to do business at times and issuers of financial instruments. Therefore, investors should understand that the information contained herein may serve as specific purposes as a result of conflict of interests of SC or SCB (Taiwan). SC, SCB (Taiwan), the employees (including those who have discussions with the author) or customers of SC or SCB (Taiwan) may have an interest in the products, related financial instruments or related derivative financial products contained herein; invest in those products at various prices and on different market conditions; have different or conflicting interests in those products. The potential impacts include market makers’ related activities, such as dealing, investment, acting as agents, or performing financial or consulting services in relation to any of the products referred to in this document. UAE: DIFC – Standard Chartered Bank is incorporated in England with limited liability by Royal Charter 1853 Reference Number ZC18.The Principal Office of the Company is situated in England at 1 Basinghall Avenue, London, EC2V 5DD. Standard Chartered Bank is authorised by the Prudential Regulation Authority and regulated by the Financial Conduct Authority and Prudential Regulation Authority. Standard Chartered Bank, Dubai International Financial Centre having its offices at Dubai International Financial Centre, Building 1, Gate Precinct, P.O. Box 999, Dubai, UAE is a branch of Standard Chartered Bank and is regulated by the Dubai Financial Services Authority (“DFSA”). This document is intended for use only by Professional Clients and is not directed at Retail Clients as defined by the DFSA Rulebook. In the DIFC we are authorised to provide financial services only to clients who qualify as Professional Clients and Market Counterparties and not to Retail Clients. As a Professional Client you will not be given the higher retail client protection and compensation rights and if you use your right to be classified as a Retail Client we will be unable to provide financial services and products to you as we do not hold the required license to undertake such activities. For Islamic transactions, we are acting under the supervision of our Shariah Supervisory Committee. Relevant information on our Shariah Supervisory Committee is currently available on the Standard Chartered Bank website in the Islamic banking section. For residents of the UAE – Standard Chartered UAE (“SC UAE”) is licensed by the Central Bank of the U.A.E. SC UAE is licensed by Securities and Commodities Authority to practice Promotion Activity. SC UAE does not provide financial analysis or consultation services in or into the UAE within the meaning of UAE Securities and Commodities Authority Decision No. 48/r of 2008 concerning financial consultation and financial analysis. Uganda: Our Investment products and services are distributed by Standard Chartered Bank Uganda Limited, which is licensed by the Capital Markets Authority as an investment adviser. United Kingdom: In the UK, Standard Chartered Bank is authorised by the Prudential Regulation Authority and regulated by the Financial Conduct Authority and Prudential Regulation Authority. This communication has been approved by Standard Chartered Bank for the purposes of Section 21 (2) (b) of the United Kingdom’s Financial Services and Markets Act 2000 (“FSMA”) as amended in 2010 and 2012 only. Standard Chartered Bank (trading as Standard Chartered Global Private Bank) is also an authorised financial services provider (license number 45747) in terms of the South African Financial Advisory and Intermediary Services Act, 2002. The Materials have not been prepared in accordance with UK legal requirements designed to promote the independence of investment research, and that it is not subject to any prohibition on dealing ahead of the dissemination of investment research. Vietnam: This document is being distributed in Vietnam by, and is attributable to, Standard Chartered Bank (Vietnam) Limited which is mainly regulated by State Bank of Vietnam (SBV). Recipients in Vietnam should contact Standard Chartered Bank (Vietnam) Limited for any queries regarding any content of this document. Zambia: This document is distributed by Standard Chartered Bank Zambia Plc, a company incorporated in Zambia and registered as a commercial bank and licensed by the Bank of Zambia under the Banking and Financial Services Act Chapter 387 of the Laws of Zambia.