28 October 2022
Global Market Outlook
Global Market Outlook
Capturing the yield
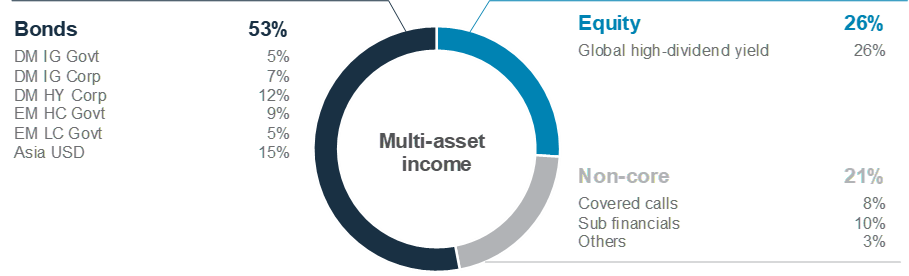
We continue to see multi-asset income generation strategies providing some of the best opportunities today, given the decade-high yields offered by bonds.
Developed Markets equities are rebounding from extremely oversold positions, but this is likely to be a bear market rally until the Fed more clearly signals a pivot. Asia ex-Japan equities offer value, in our assessment, but await a catalyst.
Overall, we continue to like a strategy that focuses on (i) rebalancing into Investment Grade corporate bonds and some deeply undervalued equity markets, (ii) rotating into high quality income assets, and (iii) risk managing via hedges, cash and cash-like assets to navigate the current environment.
Is the Fed close to pivoting?
What’s the outlook for the China Common Prosperity themes?
What are the key macro drivers to watch?
Strategy
Investment strategy and key themes
|
|
||||
|

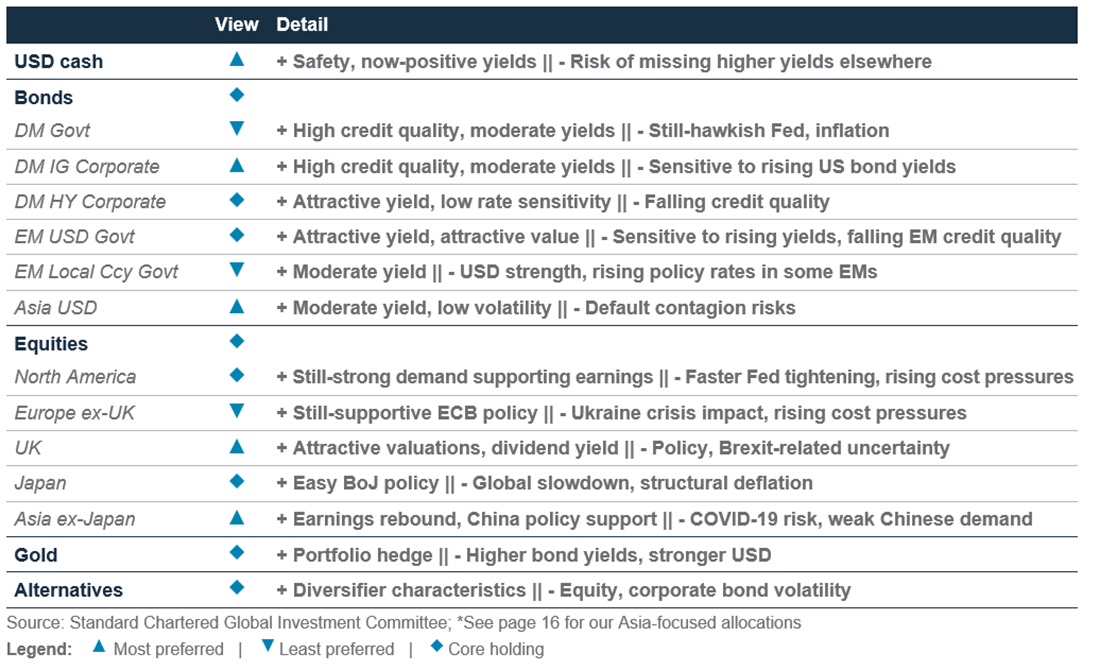
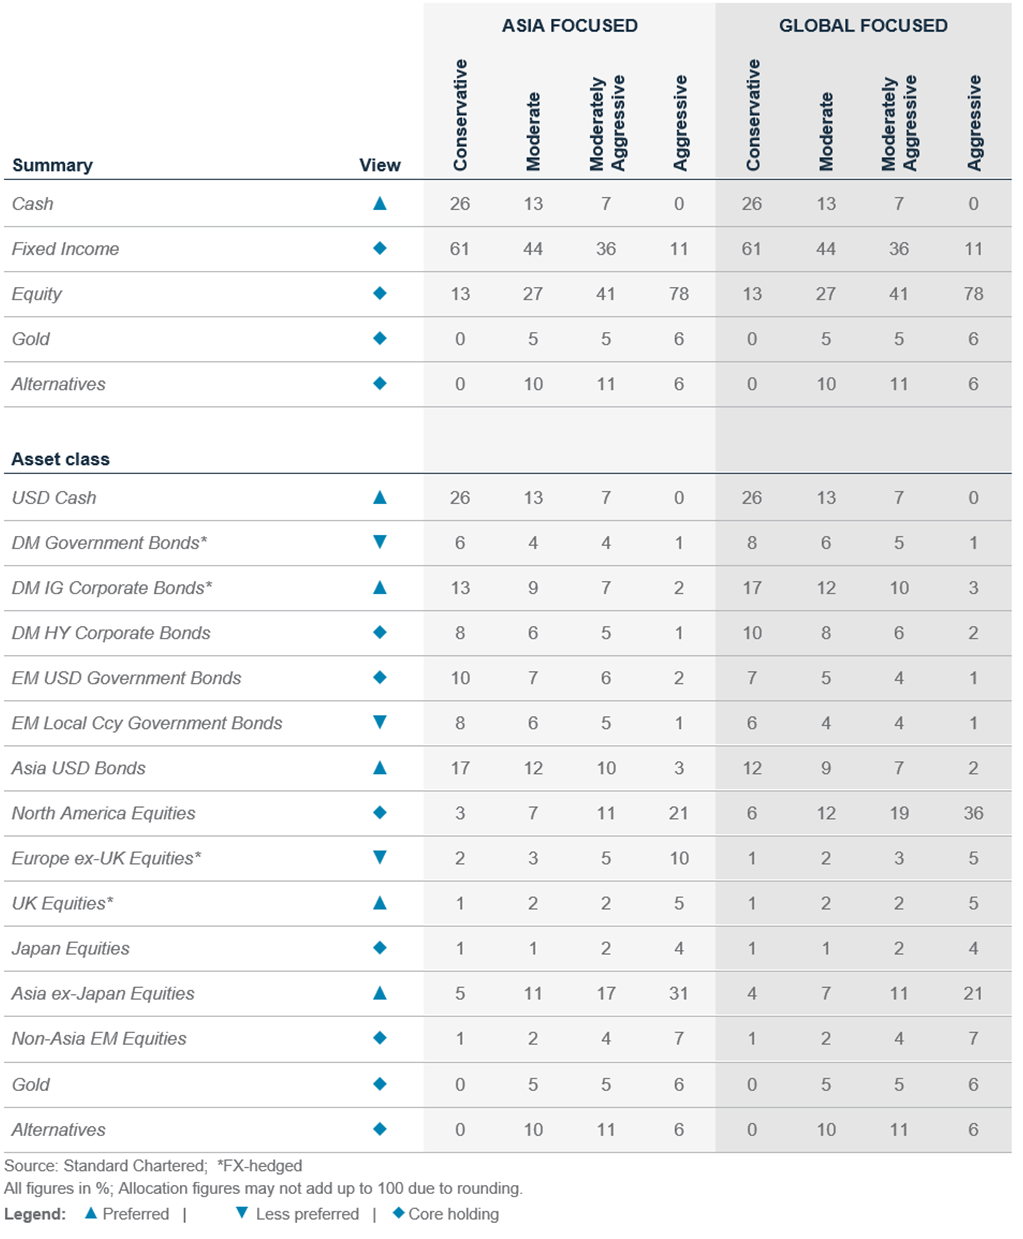
Our preferences (12-month view)
Foundation allocation preferences
- Prefer Cash
- In equities: Asia ex-Japan and the UK
- In bonds: DM IG corporate, Asia USD
Sector preferences
- US: Energy, Healthcare
- Europe: Energy, Financials
- China: Energy
Longer-term themes
- The Winds of Climate Change
- Clean Technology, Electric Vehicles, Water Scarcity, Infrastructure/ Green Capex
- China’s ‘Common Prosperity’
- Hard Tech/Semiconductor, Renewables
Our 3-month FX views
Bullish USD; bearish EUR, GBP, JPY and CNH
Capturing the yield
- We continue to see multi-asset income generation strategies providing some of the best opportunities, given the decade-high yields offered by bonds.
- Developed Markets equities are rebounding from extremely oversold positions, but this is likely to be a bear market rally until the Fed more clearly signals a pivot. Asia ex-Japan equities offer value, in our assessment, but await a catalyst.
- Overall, we continue to like a strategy that focuses on (i) rebalancing into Investment Grade corporate bonds and some deeply undervalued equity markets, (ii) rotating into high quality income assets, and (iii) risk managing via hedges, cash and cash-like assets to navigate the current environment.
A bear market rally ahead?
Last month, we laid out a 3R strategy, our preferred way to manage investments through to year end. When it comes to the first R – Rebalance into undervalued markets – we see three key questions relevant for investors today.
The first is whether the US equity market rebound from key support levels has legs. We believe it does on very short horizons because (i) several indicators argue markets are oversold or the sentiment is extremely bearish, (ii) markets failed to break below key technical support around the 200-week moving average we highlighted last month, and (iii) Q3 US earnings are surprising positively vs (lowered) expectations. However, we continue to see any such rebound as a temporary bear market rally, given 12-month earnings expectations have room to be revised lower amid a still-heightened risk of recession, continued Fed tightening and rising bond yields.
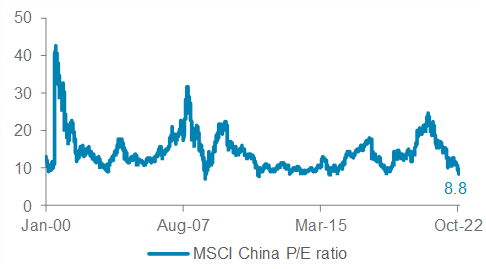
The second question is whether Asian and UK equities continue to offer a rebalancing opportunity. We believe they do over a 6-12-month horizon. While Chinese equities (as the largest component of Asian equities) have remained under pressure, the weakness has meant valuations are now not far from the 2008 crisis lows. This, in our assessment, suggests the case for rebalancing remains intact, even if a catalyst is currently absent. Indian equities – currently a preferred market within Asia – are expected to continue to outperform given their relative economic and earnings growth advantage. For UK equities, our positive view (on a FX-hedged basis) remains unchanged given (i) the market’s attractive dividend yield and (ii) large-cap firms’ largely global earnings.
Fig. 1 Rising bond yields pressure equity
valuations
S&P500 12m forward P/E vs. US 10yr bond yield (inverse)
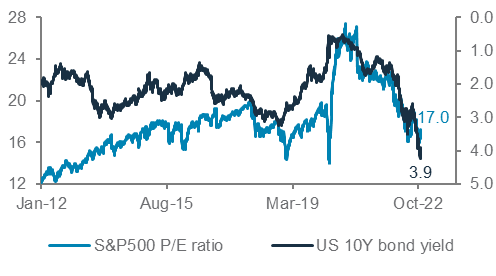
The third question is how long the rising US government bond yields are likely to stand in the way of taking advantage of today’s yields on high quality income assets. We believe risk/reward favours taking advantage of the yields today, particularly on any spike. This was the second R of our ‘RRR’ investing theme for Q4 – Recovery using high quality income.
Taking advantage of yield spikes
Bond market volatility remains unusually high, as reflected in the c.70bps move in the 10-year US government bond yield from the intraday low-to-high in October (before the recent consolidation). This remains a key headwind for income asset classes for now, given higher yields mean lower bond prices.
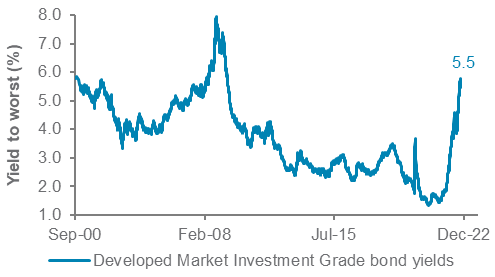
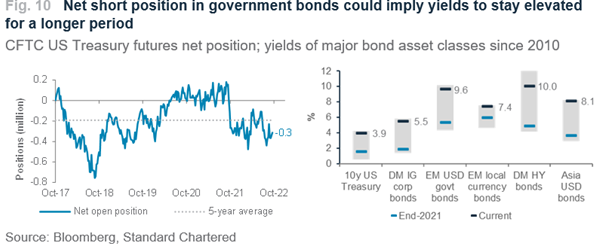
However, we still see today’s yields in high quality bonds – around 5.5% on DM IG corporate bonds, over 7% on multi-asset income strategies and over 8% on Asia USD bonds – offering an attractive opportunity. As the chart illustrates, bond yields are firmly back in their pre-2008 ranges.
It is tempting to wait out bond market volatility in the safety of asset classes such as cash, where yields are also no longer zero. However, while we do see a place for cash in asset allocations today, we would not allow this to hold us back from adding to high quality income assets: (i) price volatility is visible up front, but the yield is collected after staying invested for 12 months; (ii) the higher yield means it forms a larger component of 12-month returns, which also helps reduce the sensitivity of bonds’ returns to changes in government bond yields; and (iii) adding exposure today, well into a Fed hiking cycle, lowers ‘re-investment risk’ – ie, the risk that bond yields are much lower in a year’s time (or longer), potentially forcing investors to accept lower income at that point.
The third R – Risk-manage via hedges – is something we continue to see as relevant, even if we experience a brief bear market rally, with a higher-than-usual allocation to cash/cash-like assets and the USD as two potential options.
What could go wrong?
One question raised frequently in the aftermath of the recent volatility in UK assets is whether the Fed’s policy tightening
Fig. 2 Mainland China equity valuations have slumped to historical lows
MSCI China 12m forward P/E
eventually causes “something to break” in financial markets. By its nature, it is difficult to forecast specifically where unexpected volatility could occur – potential candidates include sovereign default risks (especially in Emerging Markets), illiquidity in parts of the corporate bond market or the Bank of Japan policy. While the history of financial market ‘hedges’ shows us that there is no such thing as a perfect hedge, we believe a strategy of staying well-diversified, balancing preferred assets with more than a single risk-hedge and ensuring an ability to ride out any unexpected jump in volatility are ways to address this uncertainty.
Fig. 3 DM IG bond yields back into pre-2008 ranges
DM Investment Grade corporate bond yield (%)
EUR, GBP likely set for more weakness
USD strength has paused but is unlikely to firmly reverse until the Fed more clearly signals a pause or pivot in its rate hiking cycle. We believe this means the EUR has room to test 0.93-0.95 over 1-3 months, making it more attractive as a potential funding currency than the CHF. The GBP is likely to follow suit as well: a resolution of immediate political challenges may involve a brief bout of optimism and test of the 1.15-1.17 range, but fundamental challenges of high inflation and weak growth remain. The BoJ’s contrasting position vs the Fed makes another test of 150 likely, but the risk of intervention-induced volatility makes it less attractive as a funding currency candidate, in our view.
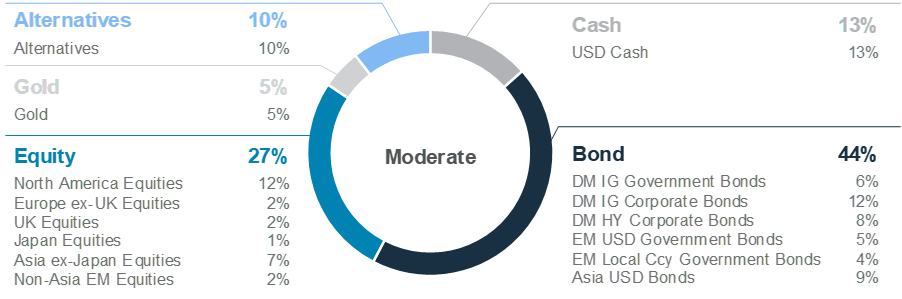
Foundation: Tactical asset allocation
Global* allocation model for a moderate risk profile
Multi-asset income allocation model for a moderate risk profile
Perspectives on key client questions
|
|
||||
To pivot or not?
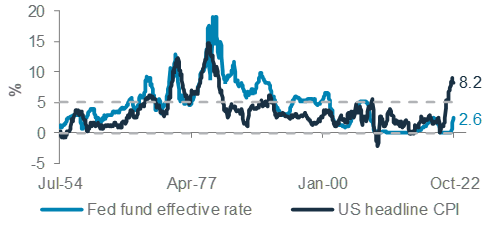
Investors expecting a policy pivot have been disappointed by the renewed hawkish rhetoric from Fed officials. While headline inflation moderated to 8.2% in September from 8.3% in August, core inflation (excluding food and energy) rose to 6.6%, the fastest such pace in four decades. The increase in inflationary pressure was led by growing price momentum in shelter and other services, which tend to be much stickier and persistent. This underscores the need for the Fed to continue acting aggressively to control inflation and raises the likelihood that recessionary conditions will be needed to bring the overall inflation to the Fed’s target of 2%.
All this led market expectations for the Fed terminal rate to rise from 4.5% to 5% in a matter of weeks in October and drive real interest rates positive across all but the shortest maturities, which is one of Powell’s explicit objectives – to encourage increased savings, reduce demand, cool the labour markets and slow the economy.
How long will this process take to play out? Will this be sufficient to cool the red-hot labour markets and how high will yields eventually end up in the current hiking cycle are important questions for investors. Without trying to predict a specific peak in bond yields, we believe the risk-reward balance favours taking advantage of higher yields, particularly on any spikes, in quality bond assets.
In the subsequent sections, we explore episodes of past Fed policy pivots to determine how long it takes for bond yields to peak. Here, we also investigate what a policy pivot means for equity and bond markets.

Fig. 4 Historical episodes of hiking cycles; how equity markets reacted post a Fed policy pivot
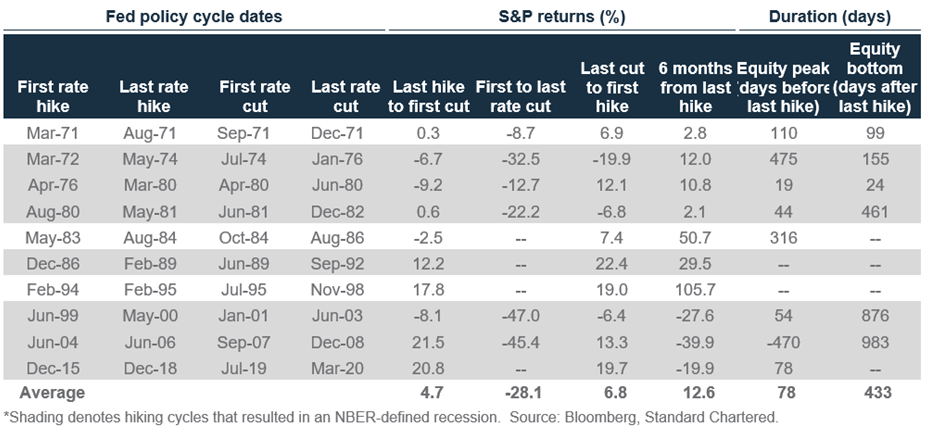
10-year government yields peak before the last rate hike
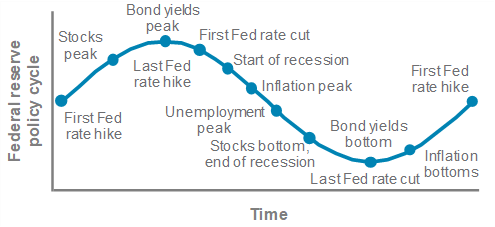
For bond investors, accurately identifying where the peak in bond yields (terminal rate) might be, is one important gauge for an investable bottom in bond assets. While shorter-term rates tend to track the Fed’s policy moves closely, intermediate- and longer-maturity yields often reflect the outlook for growth and inflation expectations. Historically, peaks in 10-year government bond yields have almost always occurred just before the last rate hike. Rising policy rates undermines growth and weakens labour markets, depressing yields on longer-tenure government bonds. Real yields, therefore, unsurprisingly also tended to peak around the same time as the highs in policy rates.
Fig. 5 Bond yields tend to peak right before the final rate hike, while inflation may continue to trudge higher
Stylistic view of how bond yields, inflation and equity performance tend to evolve historically
When might bond yields peak this time?
This is the all-important question for investors. Fed Chair Powell has given three criteria he will use to decide when it will be appropriate to stop hiking: i) below-trend growth for a sustained period, ii) a softening in labour markets, and iii) evidence that inflation is moving back towards its 2% target.
The first criteria has yet to be met, with US Q3 GDP recovering above trend, easing recessionary fears after the previous two quarters of contraction. That’s said, the Q3 growth in part came from a transitory jump to net exports, which is not expected to be repeated, according to BCA Research.
Fig. 6 Whenever inflation rises above 5%, we have tended to see the Fed policy rate rising above inflation
Fed fund rate vs consumer price index (CPI)
On labour markets, there are limited signs that would justify a Fed pivot any time soon. The labour market remains very tight – jobless claims are around its 1-year lows, with the
unemployment rate hitting a new cycle low of 3.57% in September. The Fed is projecting unemployment to rise to 4.4% by end 2024. History suggests once unemployment rises by over 0.6% ppt, it tends to keep rising by at least 2.1% from the trough, perhaps not quite the soft landing the Fed envisages or at least hopes for. Therefore, the Fed needs to pull off an extremely delicate balancing act to engineer a growth/labour market slowdown while fighting inflation.
Finally, on inflation, what is different this time is, it has arguably peaked much earlier. Since 1970s, inflation peaked on average six months after the final hike rate during hiking cycles. This time, while the Fed is expected to hike further, headline inflation has likely peaked, while longer-term inflation measures are back down to the 2-3% long-term range.
Policymakers, however, do not appear to be relenting, conscious of the 1970s’ perils of premature easing, given still high inflation. Since the Global Financial Crisis, inflation has been consistently higher than the Fed funds policy rate, as policymakers suppressed real rates to spur growth and inflation. The reverse is now occurring, with inflation at c.8% and policymakers hiking rates aggressively, lifting long-term real rates, to reduce aggregate demand and, thus, inflation.
Markets are expecting a pause in the Fed’s tightening cycle sometime in the first half of 2023. Whether the pause will be followed by a rate cut or a resumption of rate hikes will depend on how much disinflation occurs and the eventual impact it has on the labour markets.
Fed pivot ≠ better equity returns in early phase of a cut
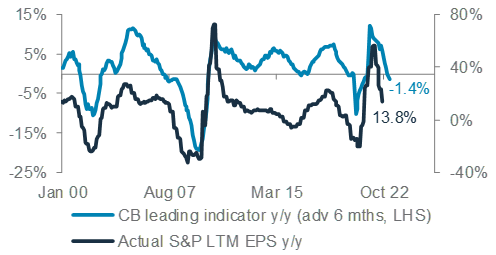
A Fed pivot has had mixed impact on equity markets historically. Policy pivots during recessionary periods generally see equity markets declining further, regardless of rate cuts. Rate cutting cycles over the past three recessions also coincided with significant falls in equity markets.
Episodes that saw equities climbing further after a policy pivot witnessed modest gains, c.8% post the final hike. The best equity performance, however, tends to occur during the tail end of the easing cycle and just before the first Fed hike. This is usually a time when inflation is mild, unemployment is falling, and growth/earnings outlook are starting to improve.
So, a Fed pivot is not always a necessary condition for equities to advance. What is perhaps more important is an improvement in the economic and earnings outlook.
Fig. 7 Growth deterioration to weigh on earnings
Leading indicator vs S&P trailing 12m EPS y/y
Our thematic ideas
|
Our Mainland China Common Prosperity themes get strong policy support
President Xi’s keynote speech at the 20th Party Congress placed emphasis on national security, technological self-sufficiency and the country’s green goals, which bodes well for our sub-themes in China Common Prosperity.
Development of renewable sector a rising focus
The emphasis on national security in President Xi’s speech is clear, not only in the agenda for military reforms, but also in the promotion of renewable energy. Greater generation of renewable energy reduces import dependency, increases energy security and ultimately improves national security. This indicates a continuation of policy support for Mainland China’s renewables sector.
But the drive to develop China’s renewable energy capacity is only partially driven by national security. More so than any other leader of the Chinese Communist Party, Xi has sought to make the environment part of his lasting legacy. Under his watch, China’s share of renewable energy in the country’s energy mix has risen from 1% to 5% and Xi has also dramatically cut air pollution for urban residents. In his keynote speech, President Xi reiterated the nation’s dual-carbon goals of reaching peak carbon emissions before 2030 and carbon neutrality by 2060. This is the first time that the dual-carbon goals were mentioned at the Party Congress and reflects buy-in at the highest level of government.
However, it is important to note that Xi did also temper expectations of low-carbon energy development by emphasising the need for steady energy transition, including the use of coal to avoid disruptions. This suggests that while the development of renewable energy is key to ensuring long-term security against environmental challenges, it is to be balanced against the need for energy security, particularly amid the current energy crisis, both globally and domestically.
NEV sales continue to be robust
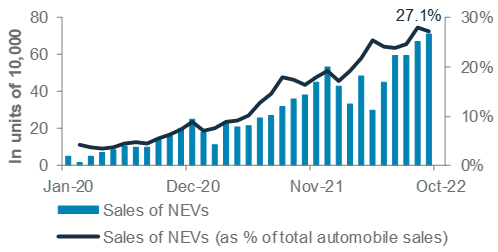
Meanwhile, Mainland China’s New Energy Vehicles (NEV) sector, which is a major component of our Renewables subtheme, continues to make strong fundamental progress. Sales remain robust, with September seeing 708k in NEV sales, representing an annual growth rate of 98%. More than one in four automobile sales in Mainland China continue to be an electric vehicle, although the penetration rate in September has slipped marginally from 28% in the previous month to
27%. Q4 is a seasonally strong quarter for automobile sales, and with the order backlogs tight and inventories thin, the momentum in NEV sales is expected to continue for the remainder of 2022, with full-year sales now expected to exceed industry consensus estimate of 6m.
Beyond 2022, we continue to expect the sale of NEVs to grow at an annual rate of roughly 25%, a rate of increase that is similar to the adoption of private passenger vehicle ownership in the early 1980s. Along with the ongoing government support and an improving supply of better EV models, NEV sales are expected to rise to 7.5m in 2023 and 9.5m in 2024
Fig. 8 NEVs account for more than one in four automobile sales in Mainland China
Monthly sales of NEVs in units of 10,000
Semiconductors a strategic focus, but near-term headwinds remain
Linked to the emphasis for national security is the pledge to become technologically self-sufficient, which bodes well for our Hard Tech and Semiconductor sub-theme over the long term. Xi pledged to accelerate the realisation of a high level of technological self-sufficiency and win the battle of key core technologies. These comments come amid a fresh push by the US to cut off China’s access to advanced semiconductor technologies.
Although the semiconductor sector remains a strategic focus, near-term headwinds remain. Slowing household income growth is likely to curb consumption and weigh on demand for electronics and semiconductors. Semiconductor consumption is now expected to enter a phase of contraction over the coming quarters, with a destocking process likely after a stockpiling drive in 2020/21. Valuations in the near term at 20.4x 12-month forward P/E has also widened against the MSCI China index at 8.8x and we would recommend waiting for a better entry point to increase exposure to the theme.
Macro overview – at a glance
|
|
||||
Key themes
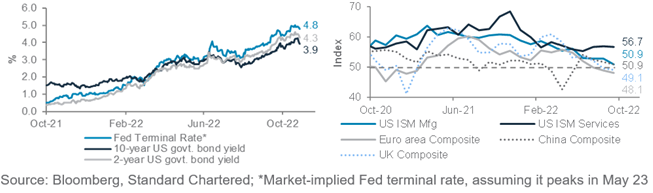
The risk of a global economic recession has risen over the past month after upside inflation surprises and still-robust job markets hardened expectations of tighter monetary policies. Policymakers at the Fed, ECB and BoE have reiterated their resolve to continue with their policy tightening until they see clear and sustained signs of inflation heading back towards their 2% target. This has driven bond yields higher, lifting the USD and tightening financial conditions worldwide. As a result, money markets now estimate the Fed funds rate and the ECB deposit rate to peak in the current hiking cycle close to 4.8% and 2.75% in Q2 and Q3 2023, respectively, compared with 4.5% and 3.25% estimated barely a month ago.
In contrast with slowing growth in the US and Europe, Mainland China continues to recover from its Q2 contraction, with GDP expanding a stronger-than-expected 3.9% q/q in Q3. The authorities remain committed to zero-COVID policies, which is likely to constrain the recovery. Nevertheless, we believe markets are ignoring President Xi’s long-term policy emphasis of developing a self-reliant ‘prosperous society’ by 2035, with focus on energy and supply chain security, technology innovation, defence and domestic consumption. The Central Economic Work Conference in December is likely to unveil the leadership’s growth plans.
Key chart
A sustained hawkish stance adopted by the Fed and other Development Market central banks (excluding Japan) has raised the risk of an imminent recession in Europe and a likely recession in the US in 2023
Fig. 9 Hawkish monetary policies have raised the risk of a global recession
Fed terminal rate and US government bond yields; business confidence indicators (PMIs)
Macro factors to watch
- US inflation, job market, mid-term elections. Markets are now pricing the Fed terminal rate (4.8%) in line with the Fed’s projections (4.75%). We will closely watch Fed policymakers’ resolve after the 2 Nov policy meeting (where they are expected to raise the key rate by another 75bps to 4%) on continuing with the current pace of rate hikes amid a heightened risk of a recession, now that the US 10y-3m government bond yield curve has inverted, following earlier inversion of the 10y-2y curve (the two have a strong track record of predicting a recession). We believe a sustained decline in m/m inflation for at least 2-3 months is likely needed before the Fed pauses rate hikes. The US job market remains too tight, with job openings elevated despite falling from record levels. The tight job market is driving up wages and shelter costs, raising the risk that inflation could broaden and become stickier. Meanwhile, the 8 November US mid-term elections are likely to see Republicans winning control of the House and the Senate, according to RealClearPolitics. A Republican control of Congress could constrain President Biden’s ability to fiscally support the economy if a recession hits.
- China’s new policy objectives. China is likely to maintain its zero-COVID policies until spring, while it vaccinates the elderly and stockpiles enough anti-COVID treatments. Property sector challenges are likely to persist, despite the recent measures to boost demand. Nevertheless, President Xi’s emphasis on self-reliant and ‘quality’ economic development points to coordinated measures in the months ahead to develop China’s high-tech industries in areas such as semiconductors, green energy and 5G. We also note that Li Qiang, who is likely to become the next Premier and in-charge of economic policy from next year, has a track record of promoting growth, especially through the support of small-scale industries.
- ECB’s resolve to keep hiking rates. Among major economies, the Euro area faces the highest risk of a recession. Thus, we are sceptical that the ECB can raise rates as high as 3% as the market is estimating. President Lagarde, after raising rates by 75bps to 1.5% this week, reiterated the ECB’s resolve of lowering inflation towards its 2% target. The ECB’s hawkish stance could turn out to be a policy mistake, deepening Euro area’s recession.
Asset Classes
Bonds – at a glance
|
|
||||
Key themes
The 10-year US Treasuries yield retreated after failing to break above technical resistance of 4.34%. We expect the yield to stay above 4% into year end, before edging lower towards 3.50-3.75% in 2023 as higher recession risks and a potential Fed pivot start to be priced in. We do not expect the Fed to capitulate soon, given a still-strong job market. However, signposts such as peaking inflation, a slowing labour market and a softer housing market would likely point to a potential Fed pause ahead.
Developed Market (DM) Investment Grade (IG) corporate bonds remain a preferred holding. We believe their risk and reward has grown more attractive after the spike in yields.
We also like Asia USD bonds, despite the notable market volatility recently. We believe their predominantly IG rating, on average, should help mitigate a likely surge in credit risk should a recession come due. Also, we assess the impact of the Chinese property sector on this bond asset class is likely to be contained going forward, with the distressed sector’s share having fallen substantially to single digit.
Key chart
The US 10-year government bond yield could likely stay elevated at or above 4% as long as the market continues to price a hawkish Fed
What is your latest view on US bond yields?
US government bond yields have retreated to c.4%, after failing to break above the 4.34% technical resistance level. Nonetheless, market indicators, such as a relatively heavy net short positions in US government bonds and Fed fund futures pricing a terminal rate of ~4.8% as of May 2023, could hint at a near-term overshoot in yields remains likely. Hence, we expect the 10-year yield to stay above 4% until year end.
In 2023, we believe tightening financial conditions will cause markets to reprice recession risks, eventually driving long-maturity bond yields lower. We expect the 10-year US government bond yield to move below 3.75% in the next 12 months. Signposts that could signal a turn lower in yields include (1) an inflation peak as a result of energy price and supply chain normalisation; (2) a weakening labour market led by fewer job openings and private sector job cuts; and (3) a slowing housing market due to surging mortgage rates.
We expect the US government bond yield curve to stay relatively flat in the next 6 to 12 months as a persistently hawkish Fed is slow to pivot, increasing the risk of a deeper recession.
How should investors position in bonds?
We prefer Asia USD bonds and DM Investment Grade corporate bonds among major bond asset classes.
In our view, the surge in bond yields to levels last seen over a decade ago has created an attractive entry point for high quality bonds. We believe the recent overshoot in government bond yields should have largely priced in expectations of more hawkish monetary policies. Given our expectation that similar sharp surge in yields is behind us, we see the interest rate risk component for bond investments as contained for now.
Among Asia USD bonds, we have a preference for Investment Grade issuers over High Yield bonds. While the peak of bond defaults, especially in the Chinese real estate sector, is likely behind us, and arguably should have been largely priced-in, we remain cautious based on the observation that developers, especially private-owned enterprises, continue to struggle from liquidity concerns and weak demand.
Equity – at a glance
|
|
||||
|
Key themes
Global equities remain a core holding on a 12-month horizon even as we remain cautious over the next few months, given our expectation for front-loaded US interest rate hikes. We believe the rate hiking cycle can pause once the Fed sees clear signs that inflation is falling consistently towards the 2% target. We expect a clear downtrend in inflation over the next 12-months.
The US Q3 earnings season is currently underway. According to Refinitiv, 45% of companies in the S&P500 have reported as of 27-Oct, with 74% of those which reported beating earnings expectations. Historically, 66% of companies “beat expectations” on average; so this is a positive sign, although 2023 earnings growth estimates are being trimmed on cautious guidance. With valuations having derated significantly, we maintain US equities as a core holding.
Asia ex-Japan remains a preferred region, where we see the strongest earnings growth in 2023. We expect supportive government policies in Mainland China to support growth in 2023. Although there is no official guidance on the easing of COVID-19 lockdowns, we expect some easing post-winter, which would be supportive of the 2023 growth when it happens.
UK equities is another preferred region, with attractive valuations, though we prefer to take exposure on a currency-hedged basis, given a volatile GBP. We have a core view of Japan equities, where we expect it can perform in line with global equities, and we have a less preferred view of Euro area equities, given energy cost pressures, a growth slowdown and rising interest rates.
Key chart
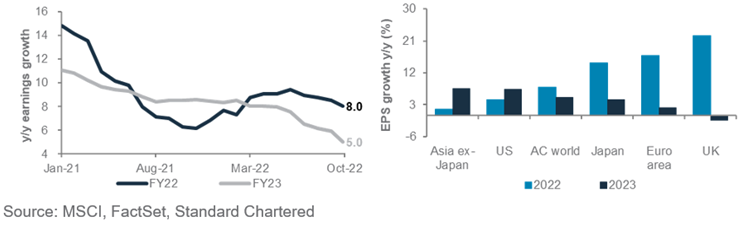
Global earnings estimates may come under further pressure as the US Q3 earnings season progresses. On a 12-month horizon, we expect policy stimulus and an earnings rebound to enable Asia ex-Japan equities to outperform
Fig. 11 Consensus earnings growth for global equities have been revised down since mid-2022. We expect earnings to rebound in 2023 to support Asia ex-Japan equities
Consensus earnings growth for MSCI ACWI since Jan-2021. Consensus earnings growth for various regional MSCI equity indices
When will rate hikes pause?
Global equities are being held back by rising interest rates in our view, as the Fed, ECB and other central banks remain focused on controlling inflation. While near-term inflation remains near 40-year highs, we expect it to gradually cool over the next 12-months. A pause in the rate hike cycle then would remove a significant headwind to equity valuations. Hence, we continue to view global equities as a core holding on a 12-month horizon.
We are also watching earnings closely for downside risks. The US Q3 earnings season is underway, and while estimates are being revised down, they are still relatively robust for 2023 with consensus expectations of 7.3% earnings growth. This estimate may come under further pressure as the earnings season progresses. With valuations having de-rated and a still
strong labour market, we expect US equities to perform in line with global equities over the next 12-months.
One preferred market remains Asia ex-Japan, where we see a strong earnings rebound in 2023. With government leadership firmed up in Mainland China, we expect further details of pro-growth policies over the next 12-months. In addition, we expect an easing of COVID-19 lockdowns post-winter to support 2023 growth. Valuations for Asia ex-Japan remain attractive, in our view.
UK equities also remain preferred, where we continue to like the deep valuation discount, high dividend yield and sector exposure that benefit from an inflationary environment. Given the GBP volatility driven by the political uncertainty, we prefer to take UK exposure on a currency-hedged basis.
FX – at a glance
|
|
||||
Key themes
We expect the USD to move higher over the next 1-3 months. The currency has softened modestly since the end of September amid reports that Fed policymakers intended to discuss a slowing of Fed rate hikes, better support for the GBP as UK political clouds have started to clear out tentatively and official intervention in the JPY market. However, we still expect the USD Index (DXY) to rise c.3% over the next 1-3 months as (i) the Fed hikes continue to outpace those in other markets, (ii) global growth concerns remain in place, and (iii) geopolitical worries stay elevated.
EUR/USD remains in a downtrend, in our view, making a move towards 0.93-0.95 likely on a 1-3 month horizon. The rebound in the GBP following the resignation of the Truss government has taken the currency back to its prior downtrend ranges – this suggests that while an end to political uncertainty could lead to a re-test of 1.15-1.17, the ongoing downtrend is likely to cause a move back to 1.08-1.10. We expect USD/CHF to be an outlier among European currencies, holding in a range around 1.00 over the next 1-3 months as the Swiss National Bank (SNB) offers the CHF some support.
In Asia, the reported JPY intervention is unlikely to be long-lasting, resulting in the return of USD/JPY to test 150-151 in the coming 1-3 months. Similarly, USD/CNH is likely to test resistance at 7.30 amid widening rate differentials vs the USD and a likely continuation of the zero-COVID policies for now.
On a longer 6-12 month horizon, we continue to expect USD strength to fade as an expensive valuations backdrop coincides with the gradually softening US inflation, narrowing rate differentials vs other major currencies, capital flows towards non-US markets and easing geopolitical uncertainty. We continue to expect the AUD and JPY to be the key outperformers on this horizon.
Key chart
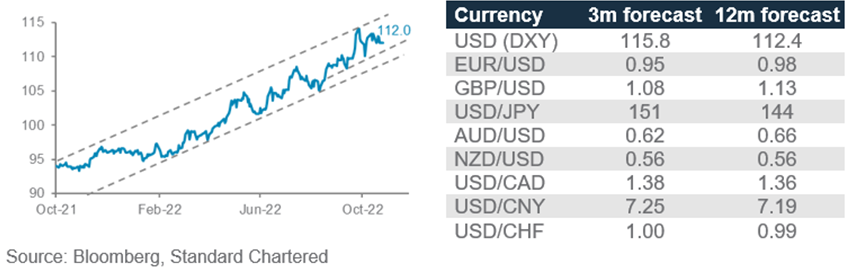
The USD uptrend is likely to resume on a 1-3 month horizon, with the EUR, GBP, JPY and CNH the most susceptible.
Fig. 12 USD remains in an uptrend for now
USD Index (DXY); table of forecasts
What is your view on USD/CHF?
We hold a neutral view on USD/CHF, expecting it to maintain a range around parity vs the USD on a shorter 1-3 month horizon, while strengthening modestly towards 0.99 on a longer 6-12 month horizon.
Key drivers of the CHF include relative interest rate differentials, safe-haven demand (particularly against global or European growth risks), inflation, the Swiss National Bank’s policy (especially via intervention) and trade balances.
Unsurprisingly, interest differentials have been one key driver of the CHF during much of the current period of USD strength. However, the SNB’s policy signals that it would likely aim for an avoidance of ‘excessive’ strength or weakness, combined with data indicating active intervention efforts, suggests a rangebound outcome now looks increasingly likely.
Swiss inflation has remained contained relative to peer economies. Having said that, the rise in inflation expectations means the policy is likely to tighten further and the central bank is likely to be biased to favour a stronger currency.
What is your preferred funding currency?
Based on our 1-3 month currency views, the EUR and GBP remain two of our top funding currency candidates given a combination of expected weakness and still-contained borrowing costs vs the USD. The JPY is arguably a third, though the risk of unexpected volatility from intervention and the risk of significant strength when the Fed eventually pivots mean we see a somewhat weaker case here. Given the heightened FX market volatility, though, we would continue to emphasise the need to ensure any funding views remain diversified and actively risk-managed. See our Daily Navigator publication for high frequency updates on 1-3 month views.
Gold, crude oil – at a glance
|
|
||||
Key themes
We continue to see gold as a core holding and a key portfolio diversifier. Gold prices have remained in a downtrend channel since the peak earlier in February. Rising yields and unyielding USD strength are exerting downward pressure on gold as the Fed stays on its tightening path. Tactical and ETF interest continues to wane as a result; YTD net flows turned negative in September. Having said that, we expect the physical market to pick up the baton from here as we enter the seasonally strong period for consumption. The recent escalation of the Russia-Ukraine conflict is likely to drive safe-haven flows to gold, keeping it well supported. On a 12-month horizon, we believe gold will move higher as bond yields moderate and the USD rolls over.
We remain neutral on oil prices over a 12-month horizon given the high probability of a recession. Demand will continue to contract as central banks stick to the course of policy tightening. On the supply side, we have already seen 2.1mb/d of cut in the last two meetings. OPEC+ is likely to react accordingly to ensure a balanced demand-supply dynamic in oil markets. However, we remain constructive on oil prices in the next three months as demand outweighs the still-tight supply. Looming EU sanctions, the proposed oil price cap and tapering oil reserve release could tighten supply and increase the volatility of oil prices.
Key chart
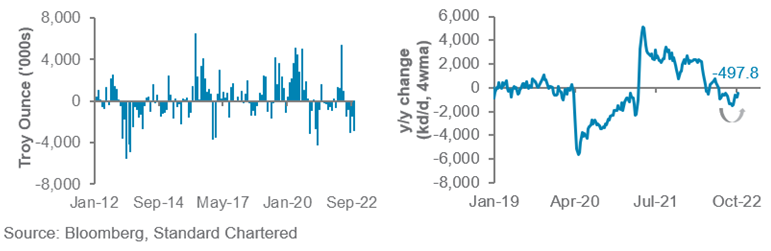
Gold remains an attractive portfolio diversifier, supported by robust physical markets demand and geopolitical risks
Oil demand recovered slightly on lower gasoline prices, but we believe it will resume its decline as gasoline prices stabilise
Fig. 13 YTD gold ETF flows turned negative; US oil demand recovered slightly in October after lower gasoline prices restored purchasing power
LHS chart: Monthly changes in Gold ETF holdings (troy ounce)
RHS chart: US EIA weekly product supplied (an oil demand measure; y/y kbpd)
Waning investor interest a challenge for gold
Gold tested the year’s low this month with higher-than-expected US consumer price inflation print raising terminal rate expectations close to 4.75% by Q2 2023. The continued USD strength did not help either. Gold has broken below USD 1,700/oz and the next key support lies at USD 1,600/oz.
Additionally, global gold ETFs have been experiencing net outflows for the past five months on lower investor interest. YTD net flows turned negative in September. Fortunately, positioning looks extremely short on a historical basis and a near-term rebound in oil is probable. The resilient physical market is likely to provide extra firepower.
We see two signposts for gold to move higher in the next 12 months: (i) bond yields moderate as Fed rate expectations stabilise; and (ii) USD strength eases and rolls over.
OPEC+ rebalances oil markets
Oil prices rose initially following an additional 2mb/d production quota cut by OPEC+ starting in November. There are also signs of recovering demand as the rollover of gasoline prices since June restore purchasing power for US households. The rally did not last as the focus shifted back to demand concerns, driving oil prices back below 85. The US reportedly releasing another 15m barrels of oil from its Strategic Petroleum Reserve (SPR) was another driver.
The actual OPEC+ output cut is probably closer to 1mb/d as some members were already producing below their quota in the recent months. Even so, the additional SPR oil is unlikely to offset the reduction in supply from the OPEC+ cut. Hence, we see oil heading higher in the next three months as demand exceeds the tighter supply. On a 12-month timeframe, demand destruction will likely catch up to balance out supply cuts.
Quant perspective
US market risk model – still elevated equity risks
|
Higher equity risk, lower bond market risk
Our US Equity-Bond Market Risk (EBMR) models the downside risks in US equities and the US 10-year government bonds. It uses 11 economic and market factors to create equity and bond risk barometers. If the value of a barometer falls below 50, it signals higher downside risks and vice versa.
There has been no change to the model output since Jun-22 when it shifted to Stage 1, where US equity market risks are expected to stay elevated, and US government bond risks should subside. The model’s equity barometer has remained bearish since it fell below 50 in January and captured the bear market in the S&P500 early into the trend (-20% YTD). Our bond barometer, which previously captured a c.2.2% rise in the government bond yield (Aug-2020 to May-2022), has remained bullish on bonds since its view changed in Jun-22.
Fig. 14 EBMR: Higher equity risks, lower bond risks
US equity and bond market risk barometers
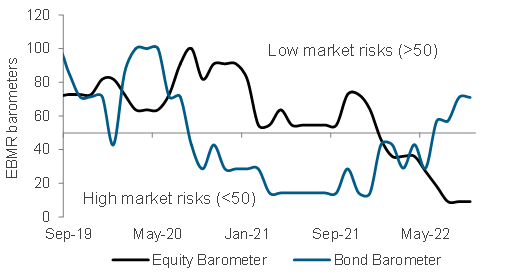
The equity barometer consists of 11 equity indicators. The barometer has remained at a low point of 9 since July, as we find very few supportive factors. Factors that are bearish on equity market risks include elevated inflation and rising bond yields. In terms of market factors, we also have bearish equity and commodity momentum, which have yet to show signs of a turnaround. As we highlighted earlier, the equity barometer is unlikely to turn bullish in the near term given the combination of depressed factors.
Meanwhile, the bond barometer, which tracks six bond indicators, remains bullish at 71 after it improved significantly from a low of 29 in May. The primary drivers are the slowdown of growth factors, such as US housing starts and PMI, and a peaking US capacity utilisation. These signals indicate any rise in yields is unlikely to be growth driven. The only bearish factor for the bond barometer now is the US jobless claims, which is more pertinent to the current economic backdrop.
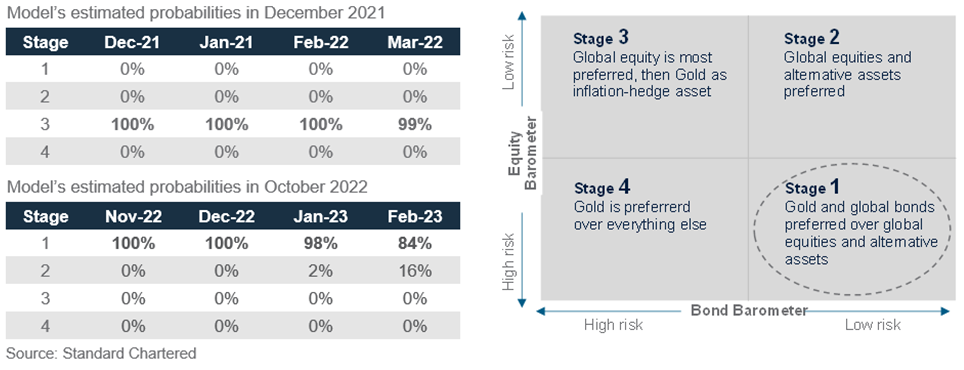
The model’s projections are currently skewed towards Stage 1 over the next four months. However, we caution that near-term risks in bonds remain with monetary policy uncertainty, as high inflation and tight labour market continue to dominate headlines.
Implications on global assets
Data since 1999 suggest gold and bonds are the most preferred in Stage 1. The model’s preference for the asset is based on its long-term relationship with the market cycle, which favours gold and bonds as defensive assets in Stage 1.
Fig. 15 Scenarios over the coming months till February 2023 vs December 2021 (Outlook 2022) projections
Probability of the evolution of financial market risk cycle from the current Stage 1 and preferred assets
Tracking market diversity
|
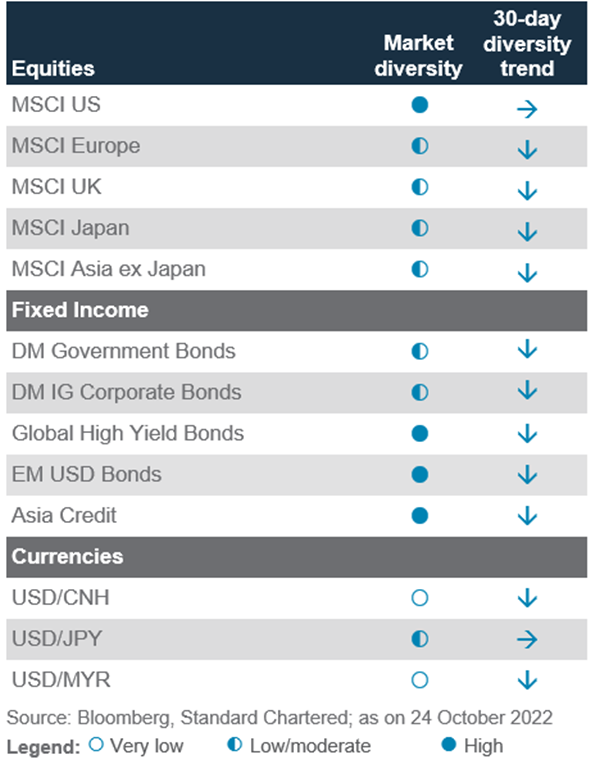
About our market diversity indicators
Our market diversity indicators help to identify a potential change in short-term trends due to a fall in market breadth across equities, credit, FX and commodities. When market diversity falls, it implies either buyers or sellers are dominating, leading to a rapid rise or fall in asset prices. This is usually unsustainable and is likely to be followed by a slowdown or a reversal. Our diversity indicator is based on a statistical index called fractal dimension; a value below 1.25 serves as a guideline that prices are rising or falling too fast.
Where is diversity falling or rising this month?
Our diversity indicators at the asset class level are not showing any significant reversal risks, despite continued weakness in both bond and equity markets and continued strength in the USD. This is due to the higher market volatility seen this year as they have been quick to balance out any supply demand imbalances that typically lead to short-term reversal opportunities.
Except for Asia ex Japan, diversity across equities have been uneventful as they have been hovering above our indicator’s reversal threshold of 1.25. The lack of triggers for a reversal event is due to the large market swings seen this year, as they help to balance out any supply demand imbalances before our diversity indicators can be triggered. A clear example of this is the rally between June and August, which saw the S&P500 rise by 17%, before subsequently falling by similar magnitude. MSCI Asia ex Japan is currently the only equity market being flagged for a short-term bounce.
Fig. 16 Average market diversity score by asset class
General diversity does not signal reversal risks
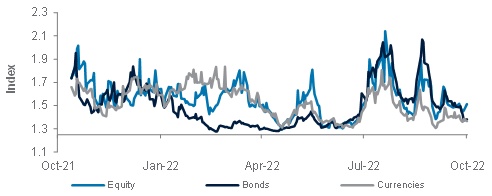
Fig. 17 Percentage of assets with diversity score <1.25
Only currencies show pockets of reversal opportunities
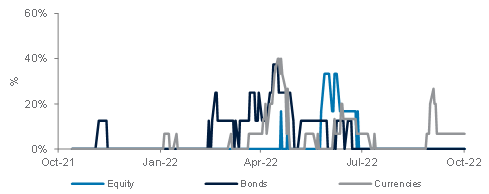
We find a similar situation in the bond space where most bond markets we track do not appear stretched based on our diversity indicator. This is after accounting for the fact that bonds tend to have lower market volatility than equities. DM government bonds are currently the only asset class our indicator suggests keeping an eye on as its diversity is now close to the 1.25 threshold.
A further deterioration will drive up the probability of an upward reversal, over the short-term.
For currencies, some USD pairs we flagged last month reversed intra-month, but the reversal was short-lived as a hawkish Fed and market uncertainties continue to underpin the USD strength. USD/MYR and USD/INR are currently the only two currencies with diversity below the threshold of 1.25.
Fig. 18 Diversity across key assets
Performance Review
Foundation: Asset allocation summary
Market performance summary*
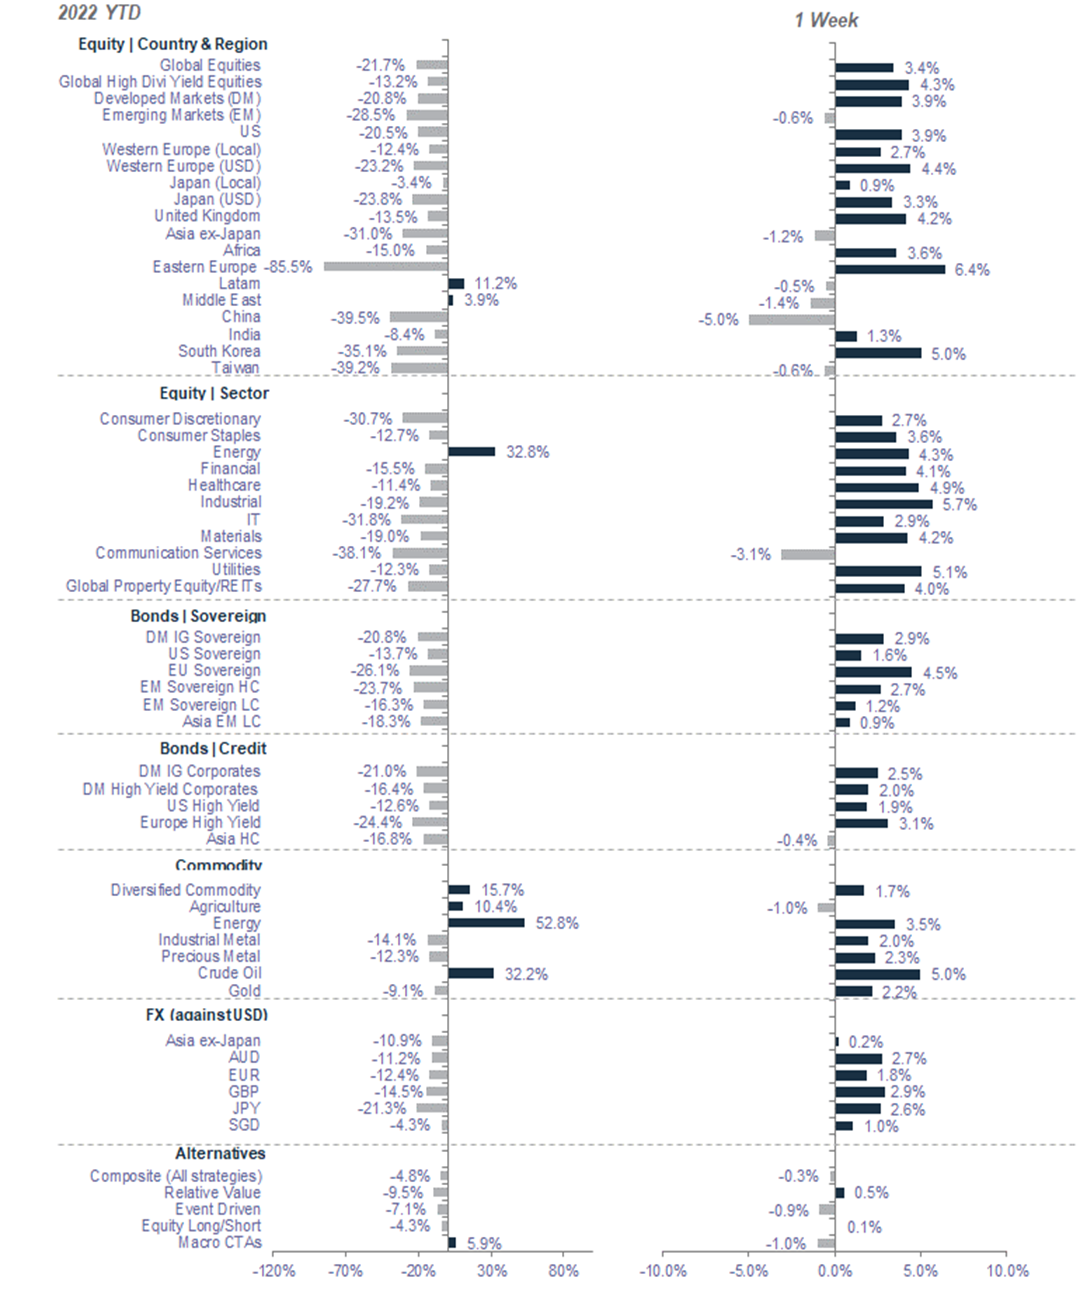
*All performance shown in USD terms, unless otherwise stated
*YTD performance data from 31 December 2021 to 27 October 2022 and 1 week-performance from 20 October 2022 to 27 October 2022
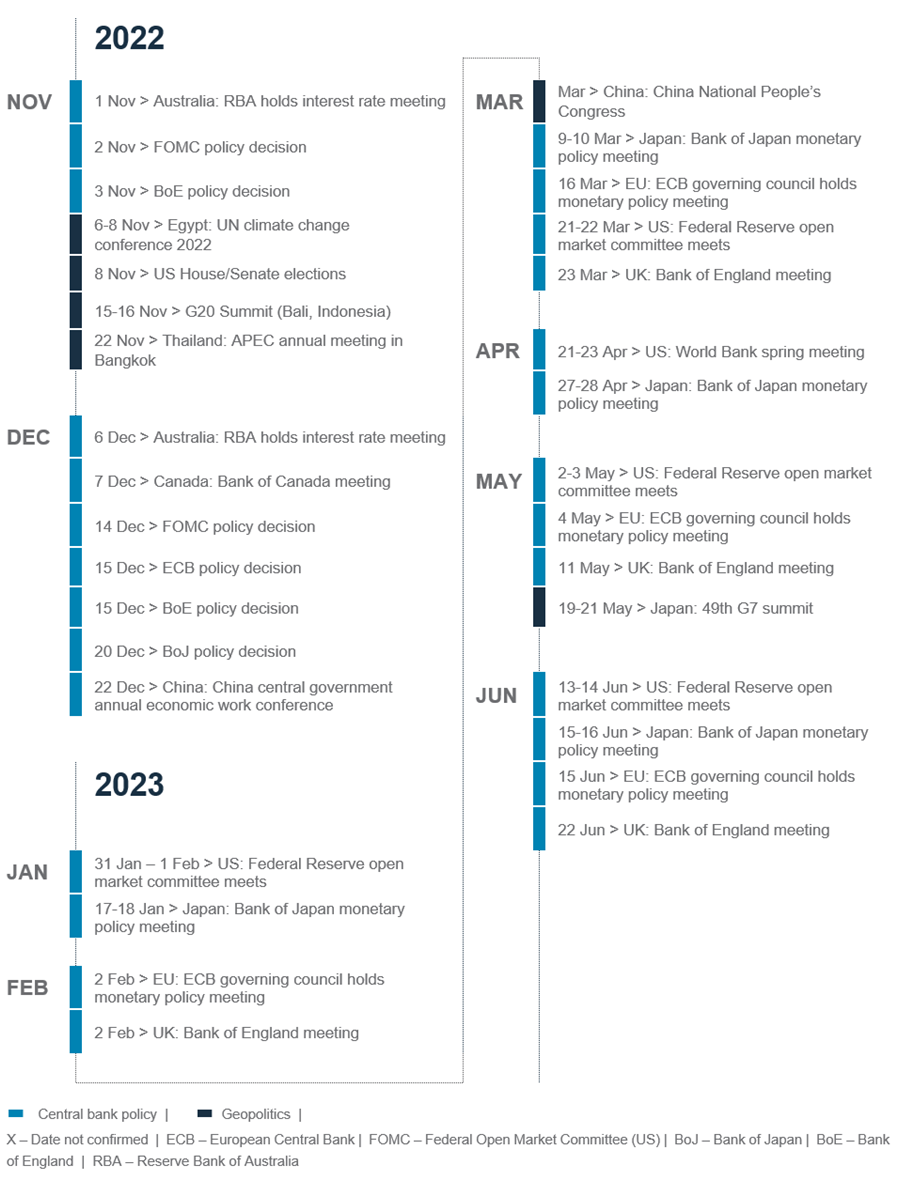
Key events
For more insights

Explanatory notes
1. The figures on page 5 show allocations for a moderate risk profile only – different risk profiles may produce significantly different asset allocation results. Page 5 is only an example, provided for general information only and they do not constitute investment advice, an offer, recommendation or solicitation. They do not take into account the specific investment objectives, needs or risk tolerances of a particular person or class of persons and they have not been prepared for any particular person or class of persons.
2. Contingent Convertibles are complex financial instruments and are not a suitable or appropriate investment for all investors. This document is not an offer to sell or an invitation to buy any securities or any beneficial interests therein. Contingent convertible securities are not intended to be sold and should not be sold to retail clients in the European Economic Area (EEA) (each as defined in the Policy Statement on the Restrictions on the Retail Distribution of Regulatory Capital Instruments (Feedback to CP14/23 and Final Rules) (“Policy Statement”), read together with the Product Intervention (Contingent Convertible Instruments and Mutual Society Shares) Instrument 2015 (“Instrument”, and together with the Policy Statement, the “Permanent Marketing Restrictions”), which were published by the United Kingdom’s Financial Conduct Authority in June 2015), other than in circumstances that do not give rise to a contravention of the Permanent Marketing Restrictions.
Disclosure
This document is confidential and may also be privileged. If you are not the intended recipient, please destroy all copies and notify the sender immediately. This document is being distributed for general information only and is subject to the relevant disclaimers available at our Standard Chartered website under Regulatory disclosures. It is not and does not constitute research material, independent research, an offer, recommendation or solicitation to enter into any transaction or adopt any hedging, trading or investment strategy, in relation to any securities or other financial instruments. This document is for general evaluation only. It does not take into account the specific investment objectives, financial situation or particular needs of any particular person or class of persons and it has not been prepared for any particular person or class of persons. You should not rely on any contents of this document in making any investment decisions. Before making any investment, you should carefully read the relevant offering documents and seek independent legal, tax and regulatory advice. In particular, we recommend you to seek advice regarding the suitability of the investment product, taking into account your specific investment objectives, financial situation or particular needs, before you make a commitment to purchase the investment product. Opinions, projections and estimates are solely those of SC at the date of this document and subject to change without notice. Past performance is not indicative of future results and no representation or warranty is made regarding future performance. The value of investments, and the income from them, can go down as well as up, and you may not recover the amount of your original investment. You are not certain to make a profit and may lose money. Any forecast contained herein as to likely future movements in rates or prices or likely future events or occurrences constitutes an opinion only and is not indicative of actual future movements in rates or prices or actual future events or occurrences (as the case may be). This document must not be forwarded or otherwise made available to any other person without the express written consent of the Standard Chartered Group (as defined below). Standard Chartered Bank is incorporated in England with limited liability by Royal Charter 1853 Reference Number ZC18. The Principal Office of the Company is situated in England at 1 Basinghall Avenue, London, EC2V 5DD. Standard Chartered Bank is authorised by the Prudential Regulation Authority and regulated by the Financial Conduct Authority and Prudential Regulation Authority. Standard Chartered PLC, the ultimate parent company of Standard Chartered Bank, together with its subsidiaries and affiliates (including each branch or representative office), form the Standard Chartered Group. Standard Chartered Private Bank is the private banking division of Standard Chartered. Private banking activities may be carried out internationally by different legal entities and affiliates within the Standard Chartered Group (each an “SC Group Entity”) according to local regulatory requirements. Not all products and services are provided by all branches, subsidiaries and affiliates within the Standard Chartered Group. Some of the SC Group Entities only act as representatives of Standard Chartered Private Bank and may not be able to offer products and services or offer advice to clients.
Copyright © 2025, Accounting Research & Analytics, LLC d/b/a CFRA (and its affiliates, as applicable). Reproduction of content provided by CFRA in any form is prohibited except with the prior written permission of CFRA. CFRA content is not investment advice and a reference to or observation concerning a security or investment provided in the CFRA SERVICES is not a recommendation to buy, sell or hold such investment or security or make any other investment decisions. The CFRA content contains opinions of CFRA based upon publicly-available information that CFRA believes to be reliable and the opinions are subject to change without notice. This analysis has not been submitted to, nor received approval from, the United States Securities and Exchange Commission or any other regulatory body. While CFRA exercised due care in compiling this analysis, CFRA, ITS THIRD-PARTY SUPPLIERS, AND ALL RELATED ENTITIES SPECIFICALLY DISCLAIM ALL WARRANTIES, EXPRESS OR IMPLIED, INCLUDING, BUT NOT LIMITED TO, ANY WARRANTIES OF MERCHANTABILITY OR FITNESS FOR A PARTICULAR PURPOSE OR USE, to the full extent permitted by law, regarding the accuracy, completeness, or usefulness of this information and assumes no liability with respect to the consequences of relying on this information for investment or other purposes. No content provided by CFRA (including ratings, credit-related analyses and data, valuations, model, software or other application or output therefrom) or any part thereof may be modified, reverse engineered, reproduced or distributed in any form by any means, or stored in a database or retrieval system, without the prior written permission of CFRA, and such content shall not be used for any unlawful or unauthorized purposes. CFRA and any third-party providers, as well as their directors, officers, shareholders, employees or agents do not guarantee the accuracy, completeness, timeliness or availability of such content. In no event shall CFRA, its affiliates, or their third-party suppliers be liable for any direct, indirect, special, or consequential damages, costs, expenses, legal fees, or losses (including lost income or lost profit and opportunity costs) in connection with a subscriber’s, subscriber’s customer’s, or other’s use of CFRA’s content.
Market Abuse Regulation (MAR) Disclaimer
Banking activities may be carried out internationally by different branches, subsidiaries and affiliates within the Standard Chartered Group according to local regulatory requirements. Opinions may contain outright “buy”, “sell”, “hold” or other opinions. The time horizon of this opinion is dependent on prevailing market conditions and there is no planned frequency for updates to the opinion. This opinion is not independent of Standard Chartered Group’s trading strategies or positions. Standard Chartered Group and/or its affiliates or its respective officers, directors, employee benefit programmes or employees, including persons involved in the preparation or issuance of this document may at any time, to the extent permitted by applicable law and/or regulation, be long or short any securities or financial instruments referred to in this document or have material interest in any such securities or related investments. Therefore, it is possible, and you should assume, that Standard Chartered Group has a material interest in one or more of the financial instruments mentioned herein. Please refer to our Standard Chartered website under Regulatory disclosures for more detailed disclosures, including past opinions/ recommendations in the last 12 months and conflict of interests, as well as disclaimers. A covering strategist may have a financial interest in the debt or equity securities of this company/issuer. All covering strategist are licensed to provide investment recommendations under Monetary Authority of Singapore or Hong Kong Monetary Authority. This document must not be forwarded or otherwise made available to any other person without the express written consent of Standard Chartered Group.
Sustainable Investments
Any ESG data used or referred to has been provided by Morningstar, Sustainalytics, MSCI or Bloomberg. Refer to 1) Morningstar website under Sustainable Investing, 2) Sustainalytics website under ESG Risk Ratings, 3) MCSI website under ESG Business Involvement Screening Research and 4) Bloomberg green, social & sustainability bonds guide for more information. The ESG data is as at the date of publication based on data provided, is for informational purpose only and is not warranted to be complete, timely, accurate or suitable for a particular purpose, and it may be subject to change. Sustainable Investments (SI): This refers to funds that have been classified as ‘Sustainable Investments’ by Morningstar. SI funds have explicitly stated in their prospectus and regulatory filings that they either incorporate ESG factors into the investment process or have a thematic focus on the environment, gender diversity, low carbon, renewable energy, water or community development. For equity, it refers to shares/stocks issued by companies with Sustainalytics ESG Risk Rating of Low/Negligible. For bonds, it refers to debt instruments issued by issuers with Sustainalytics ESG Risk Rating of Low/Negligible, and/or those being certified green, social, sustainable bonds by Bloomberg. For structured products, it refers to products that are issued by any issuer who has a Sustainable Finance framework that aligns with Standard Chartered’s Green and Sustainable Product Framework, with underlying assets that are part of the Sustainable Investment universe or separately approved by Standard Chartered’s Sustainable Finance Governance Committee. Sustainalytics ESG risk ratings shown are factual and are not an indicator that the product is classified or marketed as “green”, “sustainable” or similar under any particular classification system or framework.
Country/Market Specific Disclosures
Botswana: This document is being distributed in Botswana by, and is attributable to, Standard Chartered Bank Botswana Limited which is a financial institution licensed under the Section 6 of the Banking Act CAP 46.04 and is listed in the Botswana Stock Exchange. Brunei Darussalam: This document is being distributed in Brunei Darussalam by, and is attributable to, Standard Chartered Bank (Brunei Branch) | Registration Number RFC/61 and Standard Chartered Securities (B) Sdn Bhd | Registration Number RC20001003. Standard Chartered Bank is incorporated in England with limited liability by Royal Charter 1853 Reference Number ZC18. Standard Chartered Securities (B) Sdn Bhd is a limited liability company registered with the Registry of Companies with Registration Number RC20001003 and licensed by Brunei Darussalam Central Bank as a Capital Markets Service License Holder with License Number BDCB/R/CMU/S3-CL and it is authorised to conduct Islamic investment business through an Islamic window. China Mainland: This document is being distributed in China by, and is attributable to, Standard Chartered Bank (China) Limited which is mainly regulated by National Financial Regulatory Administration (NFRA), State Administration of Foreign Exchange (SAFE), and People’s Bank of China (PBOC). Hong Kong: In Hong Kong, this document, except for any portion advising on or facilitating any decision on futures contracts trading, is distributed by Standard Chartered Bank (Hong Kong) Limited (“SCBHK”), a subsidiary of Standard Chartered PLC. SCBHK has its registered address at 32/F, Standard Chartered Bank Building, 4-4A Des Voeux Road Central, Hong Kong and is regulated by the Hong Kong Monetary Authority and registered with the Securities and Futures Commission (“SFC”) to carry on Type 1 (dealing in securities), Type 4 (advising on securities), Type 6 (advising on corporate finance) and Type 9 (asset management) regulated activity under the Securities and Futures Ordinance (Cap. 571) (“SFO”) (CE No. AJI614). The contents of this document have not been reviewed by any regulatory authority in Hong Kong and you are advised to exercise caution in relation to any offer set out herein. If you are in doubt about any of the contents of this document, you should obtain independent professional advice. Any product named herein may not be offered or sold in Hong Kong by means of any document at any time other than to “professional investors” as defined in the SFO and any rules made under that ordinance. In addition, this document may not be issued or possessed for the purposes of issue, whether in Hong Kong or elsewhere, and any interests may not be disposed of, to any person unless such person is outside Hong Kong or is a “professional investor” as defined in the SFO and any rules made under that ordinance, or as otherwise may be permitted by that ordinance. In Hong Kong, Standard Chartered Private Bank is the private banking division of SCBHK, a subsidiary of Standard Chartered PLC. Ghana: Standard Chartered Bank Ghana Limited accepts no liability and will not be liable for any loss or damage arising directly or indirectly (including special, incidental or consequential loss or damage) from your use of these documents. Past performance is not indicative of future results and no representation or warranty is made regarding future performance. You should seek advice from a financial adviser on the suitability of an investment for you, taking into account these factors before making a commitment to invest in an investment. To unsubscribe from receiving further updates, please send an email to feedback.ghana@sc.com. Please do not reply to this email. Call our Priority Banking on 0302610750 for any questions or service queries. You are advised not to send any confidential and/or important information to Standard Chartered via e-mail, as Standard Chartered makes no representations or warranties as to the security or accuracy of any information transmitted via e-mail. Standard Chartered shall not be responsible for any loss or damage suffered by you arising from your decision to use e-mail to communicate with the Bank. India: This document is being distributed in India by Standard Chartered in its capacity as a distributor of mutual funds and referrer of any other third party financial products. Standard Chartered does not offer any ‘Investment Advice’ as defined in the Securities and Exchange Board of India (Investment Advisers) Regulations, 2013 or otherwise. Services/products related securities business offered by Standard Charted are not intended for any person, who is a resident of any jurisdiction, the laws of which imposes prohibition on soliciting the securities business in that jurisdiction without going through the registration requirements and/or prohibit the use of any information contained in this document. Indonesia: This document is being distributed in Indonesia by Standard Chartered Bank, Indonesia branch, which is a financial institution licensed and supervised by Otoritas Jasa Keuangan (Financial Service Authority) and Bank Indonesia. Jersey: In Jersey, Standard Chartered Private Bank is the Registered Business Name of the Jersey Branch of Standard Chartered Bank. The Jersey Branch of Standard Chartered Bank is regulated by the Jersey Financial Services Commission. Copies of the latest audited accounts of Standard Chartered Bank are available from its principal place of business in Jersey: PO Box 80, 15 Castle Street, St Helier, Jersey JE4 8PT. Standard Chartered Bank is incorporated in England with limited liability by Royal Charter in 1853 Reference Number ZC 18. The Principal Office of the Company is situated in England at 1 Basinghall Avenue, London, EC2V 5DD. Standard Chartered Bank is authorised by the Prudential Regulation Authority and regulated by the Financial Conduct Authority and Prudential Regulation Authority. The Jersey Branch of Standard Chartered Bank is also an authorised financial services provider under license number 44946 issued by the Financial Sector Conduct Authority of the Republic of South Africa. Jersey is not part of the United Kingdom and all business transacted with Standard Chartered Bank, Jersey Branch and other SC Group Entity outside of the United Kingdom, are not subject to some or any of the investor protection and compensation schemes available under United Kingdom law. Kenya: This document is being distributed in Kenya by and is attributable to Standard Chartered Bank Kenya Limited. Investment Products and Services are distributed by Standard Chartered Investment Services Limited, a wholly owned subsidiary of Standard Chartered Bank Kenya Limited that is licensed by the Capital Markets Authority in Kenya, as a Fund Manager. Standard Chartered Bank Kenya Limited is regulated by the Central Bank of Kenya. Malaysia: This document is being distributed in Malaysia by Standard Chartered Bank Malaysia Berhad (“SCBMB”). Recipients in Malaysia should contact SCBMB in relation to any matters arising from, or in connection with, this document. This document has not been reviewed by the Securities Commission Malaysia. The product lodgement, registration, submission or approval by the Securities Commission of Malaysia does not amount to nor indicate recommendation or endorsement of the product, service or promotional activity. Investment products are not deposits and are not obligations of, not guaranteed by, and not protected by SCBMB or any of the affiliates or subsidiaries, or by Perbadanan Insurans Deposit Malaysia, any government or insurance agency. Investment products are subject to investment risks, including the possible loss of the principal amount invested. SCBMB expressly disclaim any liability and responsibility for any loss arising directly or indirectly (including special, incidental or consequential loss or damage) arising from the financial losses of the Investment Products due to market condition. Nigeria: This document is being distributed in Nigeria by Standard Chartered Bank Nigeria Limited (SCB Nigeria), a bank duly licensed and regulated by the Central Bank of Nigeria. SCB Nigeria accepts no liability for any loss or damage arising directly or indirectly (including special, incidental or consequential loss or damage) from your use of these documents. You should seek advice from a financial adviser on the suitability of an investment for you, taking into account these factors before making a commitment to invest in an investment. To unsubscribe from receiving further updates, please send an email to clientcare.ng@sc.com requesting to be removed from our mailing list. Please do not reply to this email. Call our Priority Banking on 02 012772514 for any questions or service queries. SCB Nigeria shall not be responsible for any loss or damage arising from your decision to send confidential and/or important information to Standard Chartered via e-mail. SCB Nigeria makes no representations or warranties as to the security or accuracy of any information transmitted via e-mail. Pakistan: This document is being distributed in Pakistan by, and attributable to Standard Chartered Bank (Pakistan) Limited having its registered office at PO Box 5556, I.I Chundrigar Road Karachi, which is a banking company registered with State Bank of Pakistan under Banking Companies Ordinance 1962 and is also having licensed issued by Securities & Exchange Commission of Pakistan for Security Advisors. Standard Chartered Bank (Pakistan) Limited acts as a distributor of mutual funds and referrer of other third-party financial products. Singapore: This document is being distributed in Singapore by, and is attributable to, Standard Chartered Bank (Singapore) Limited (Registration No. 201224747C/ GST Group Registration No. MR-8500053-0, “SCBSL”). Recipients in Singapore should contact SCBSL in relation to any matters arising from, or in connection with, this document. SCBSL is an indirect wholly owned subsidiary of Standard Chartered Bank and is licensed to conduct banking business in Singapore under the Singapore Banking Act, 1970. Standard Chartered Private Bank is the private banking division of SCBSL. IN RELATION TO ANY SECURITY OR SECURITIES-BASED DERIVATIVES CONTRACT REFERRED TO IN THIS DOCUMENT, THIS DOCUMENT, TOGETHER WITH THE ISSUER DOCUMENTATION, SHALL BE DEEMED AN INFORMATION MEMORANDUM (AS DEFINED IN SECTION 275 OF THE SECURITIES AND FUTURES ACT, 2001 (“SFA”)). THIS DOCUMENT IS INTENDED FOR DISTRIBUTION TO ACCREDITED INVESTORS, AS DEFINED IN SECTION 4A(1)(a) OF THE SFA, OR ON THE BASIS THAT THE SECURITY OR SECURITIES-BASED DERIVATIVES CONTRACT MAY ONLY BE ACQUIRED AT A CONSIDERATION OF NOT LESS THAN S$200,000 (OR ITS EQUIVALENT IN A FOREIGN CURRENCY) FOR EACH TRANSACTION. Further, in relation to any security or securities-based derivatives contract, neither this document nor the Issuer Documentation has been registered as a prospectus with the Monetary Authority of Singapore under the SFA. Accordingly, this document and any other document or material in connection with the offer or sale, or invitation for subscription or purchase, of the product may not be circulated or distributed, nor may the product be offered or sold, or be made the subject of an invitation for subscription or purchase, whether directly or indirectly, to persons other than a relevant person pursuant to section 275(1) of the SFA, or any person pursuant to section 275(1A) of the SFA, and in accordance with the conditions specified in section 275 of the SFA, or pursuant to, and in accordance with the conditions of, any other applicable provision of the SFA. In relation to any collective investment schemes referred to in this document, this document is for general information purposes only and is not an offering document or prospectus (as defined in the SFA). This document is not, nor is it intended to be (i) an offer or solicitation of an offer to buy or sell any capital markets product; or (ii) an advertisement of an offer or intended offer of any capital markets product. Deposit Insurance Scheme: Singapore dollar deposits of non-bank depositors are insured by the Singapore Deposit Insurance Corporation, for up to S$100,000 in aggregate per depositor per Scheme member by law. Foreign currency deposits, dual currency investments, structured deposits and other investment products are not insured. This advertisement has not been reviewed by the Monetary Authority of Singapore. Taiwan: SC Group Entity or Standard Chartered Bank (Taiwan) Limited (“SCB (Taiwan)”) may be involved in the financial instruments contained herein or other related financial instruments. The author of this document may have discussed the information contained herein with other employees or agents of SC or SCB (Taiwan). The author and the above-mentioned employees of SC or SCB (Taiwan) may have taken related actions in respect of the information involved (including communication with customers of SC or SCB (Taiwan) as to the information contained herein). The opinions contained in this document may change, or differ from the opinions of employees of SC or SCB (Taiwan). SC and SCB (Taiwan) will not provide any notice of any changes to or differences between the above-mentioned opinions. This document may cover companies with which SC or SCB (Taiwan) seeks to do business at times and issuers of financial instruments. Therefore, investors should understand that the information contained herein may serve as specific purposes as a result of conflict of interests of SC or SCB (Taiwan). SC, SCB (Taiwan), the employees (including those who have discussions with the author) or customers of SC or SCB (Taiwan) may have an interest in the products, related financial instruments or related derivative financial products contained herein; invest in those products at various prices and on different market conditions; have different or conflicting interests in those products. The potential impacts include market makers’ related activities, such as dealing, investment, acting as agents, or performing financial or consulting services in relation to any of the products referred to in this document. UAE: DIFC – Standard Chartered Bank is incorporated in England with limited liability by Royal Charter 1853 Reference Number ZC18.The Principal Office of the Company is situated in England at 1 Basinghall Avenue, London, EC2V 5DD. Standard Chartered Bank is authorised by the Prudential Regulation Authority and regulated by the Financial Conduct Authority and Prudential Regulation Authority. Standard Chartered Bank, Dubai International Financial Centre having its offices at Dubai International Financial Centre, Building 1, Gate Precinct, P.O. Box 999, Dubai, UAE is a branch of Standard Chartered Bank and is regulated by the Dubai Financial Services Authority (“DFSA”). This document is intended for use only by Professional Clients and is not directed at Retail Clients as defined by the DFSA Rulebook. In the DIFC we are authorised to provide financial services only to clients who qualify as Professional Clients and Market Counterparties and not to Retail Clients. As a Professional Client you will not be given the higher retail client protection and compensation rights and if you use your right to be classified as a Retail Client we will be unable to provide financial services and products to you as we do not hold the required license to undertake such activities. For Islamic transactions, we are acting under the supervision of our Shariah Supervisory Committee. Relevant information on our Shariah Supervisory Committee is currently available on the Standard Chartered Bank website in the Islamic banking section. For residents of the UAE – Standard Chartered Bank UAE does not provide financial analysis or consultation services in or into the UAE within the meaning of UAE Securities and Commodities Authority Decision No. 48/r of 2008 concerning financial consultation and financial analysis. Uganda: Our Investment products and services are distributed by Standard Chartered Bank Uganda Limited, which is licensed by the Capital Markets Authority as an investment adviser. United Kingdom: In the UK, Standard Chartered Bank is authorised by the Prudential Regulation Authority and regulated by the Financial Conduct Authority and Prudential Regulation Authority. This communication has been approved by Standard Chartered Bank for the purposes of Section 21 (2) (b) of the United Kingdom’s Financial Services and Markets Act 2000 (“FSMA”) as amended in 2010 and 2012 only. Standard Chartered Bank (trading as Standard Chartered Private Bank) is also an authorised financial services provider (license number 45747) in terms of the South African Financial Advisory and Intermediary Services Act, 2002. The Materials have not been prepared in accordance with UK legal requirements designed to promote the independence of investment research, and that it is not subject to any prohibition on dealing ahead of the dissemination of investment research. Vietnam: This document is being distributed in Vietnam by, and is attributable to, Standard Chartered Bank (Vietnam) Limited which is mainly regulated by State Bank of Vietnam (SBV). Recipients in Vietnam should contact Standard Chartered Bank (Vietnam) Limited for any queries regarding any content of this document. Zambia: This document is distributed by Standard Chartered Bank Zambia Plc, a company incorporated in Zambia and registered as a commercial bank and licensed by the Bank of Zambia under the Banking and Financial Services Act Chapter 387 of the Laws of Zambia.