Table of Contents
In a rush? Read the summary:
- The price-to-earnings (P/E) ratio measures a company’s share price relative to its earnings per share (EPS), enabling investors to evaluate if a stock is trading below or above its fair value.
- Trailing and forward P/E ratios offer insights into a company’s past and expected performance, facilitating the evaluation of future growth potential.
- While applicable for relative valuation and value investing, the P/E ratio doesn’t account for cash flow or debt and should be interpreted within the context of the industry and market.
The price-to-earnings (P/E) ratio is one of the most significant valuation metrics for stocks, comparing a company’s share price to its earnings per share (EPS). Investors and analysts review the relative valuation of a stock and can determine whether it’s overvalued or undervalued.
The P/E ratio also helps compare a company’s valuation against its historical performance and determine its valuation relative to other firms within the industry and the overall market. It’s a benchmark against other available stocks in the same industry or in the broader market.
P/E ratio formula
One can calculate the P/E ratio by dividing the current stock price by its EPS.
- P/E Ratio = Stock Price ÷ EPS
For example, if a company’s stock trades at AED 100 and its EPS is AED 4, investors have to pay AED 25 for every AED 1 of earnings.
Therefore, the PE Ratio: 25 = AED 100 ÷ 4
To calculate the P/E ratio, one can determine a company’s current share price, which is usually available on stock exchanges, and the company’s EPS, which is typically reported in the company’s financial statements. Alternatively, the P/E ratio can be calculated by dividing the company’s net income by the number of outstanding shares.
Understanding key variants of the P/E ratio
When analysing the P/E ratio of a stock, investors can look at various forms of the metric. Each explains to investors something slightly different about the valuation of a company.
Trailing P/E ratio
It is calculated based on a company’s earnings over the past 12 months. The trailing P/E ratio relies on actual data. It’s a reliable metric that helps investors understand how a stock performed recently. Remember, it only reflects the past performance, and the performance can change quickly.
Forward P/E ratio
Unlike the trailing P/E ratio, the forward P/E ratio examines a company’s projected earnings for the next 12 months. It helps investors assess how a stock might perform in the future. Sometimes both companies and analysts can be overly pessimistic or optimistic about a stock’s future performance. Therefore, the forward P/E ratio comes with risks, especially if the earnings forecasts are inaccurate.
High P/E ratio versus low P/E ratio
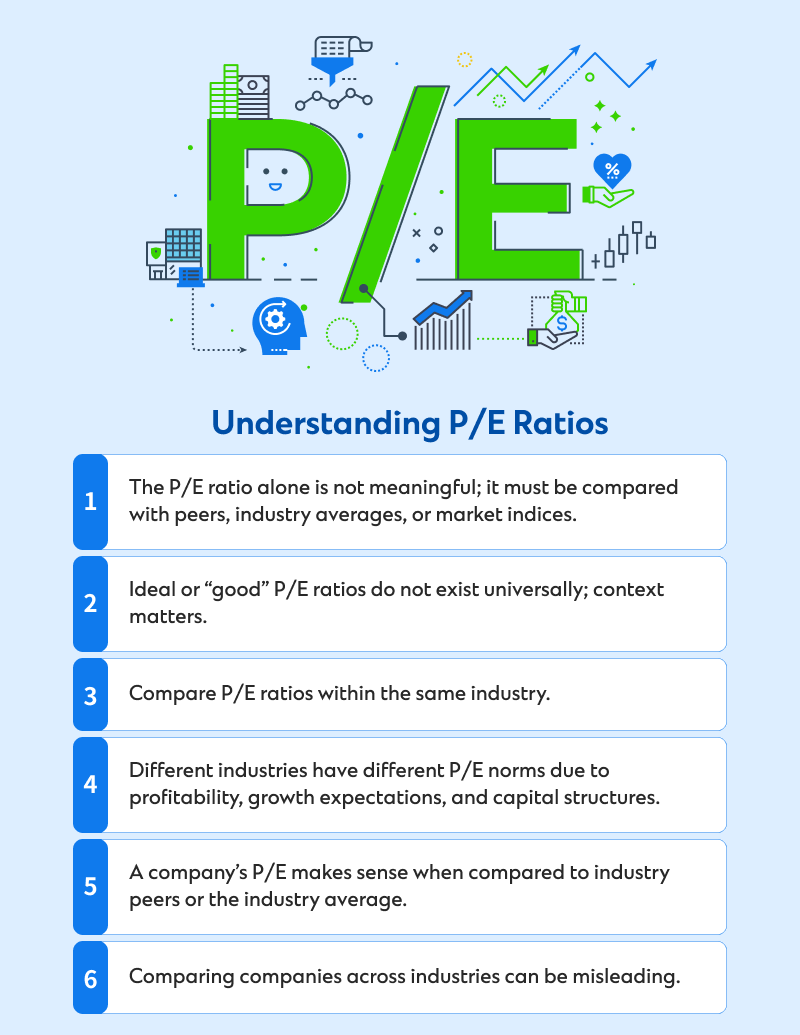
While the P/E ratio can be a powerful reference point for evaluating stocks, remember that its effectiveness depends on how it is used in context. Whether a stock is overvalued or undervalued, investors can easily determine this by comparing a company’s P/E ratio to those of other companies in the same industry and analysing their historical performance through the trailing P/E ratio.
- High value P/E ratio: This indicates that investors can expect significant growth from the company. For example, a P/E ratio above 25 is often considered high, except in the case of the company.
- Low P/E ratio: When the P/E ratio is typically below 15, it suggests that a stock may be undervalued compared to its intrinsic worth. This can sometimes reflect market concerns about the company’s growth prospects or financial health.
The P/E ratio depends on various factors like industry averages, the specific nature of our business, and prevailing market conditions. Sometimes, highly valued stocks can also have a lower P/E ratio due to their slower growth rate.
Investors who want to make informed comparisons can assess how a company’s P/E ratio compares to that of a peer company with similar growth trajectories and characteristics within the same industry.
For example, if a company has a P/E ratio of 40 and is trading at a significantly higher premium compared to another company with a P/E ratio of 10, it simply suggests that the investors are willing to pay more for each AED of earnings in the former company.
Factors to keep in mind when using the P/E ratio
Despite the different insights that investors can gain by calculating the P/E ratio, this metric also comes with limitations.
- The P/E ratio does not give investors insights about the cash flow of a company, nor does it check our company’s debts
- The P/E ratio is not an effective comparison metric when analysing different companies from different industries or sectors
Determining the P/E ratio for value investing
Investors who want to understand a company’s intrinsic value of its underlying assets compared to its current market price can use this information to help identify potential mispricing. While a high P/E ratio suggests that the share price of the company is significantly higher than its earnings, some investors avoid such stocks as they might be subject to significant price corrections.
On the other hand, a below-average P/E ratio typically indicates that the stock is undervalued, offering investors a favourable buying opportunity. However, contextual analysis is needed for more accurate investment decisions as valuation standards can vary across different sectors.
Speak to Standard Chartered’s relationship manager or contact us to learn more about the P/E ratio.